

This list excludes humans, who would otherwise lead the ranks of most common primates by a significant margin.


Today, China dominates the trade market, accounting for almost 15% of all merchandise.
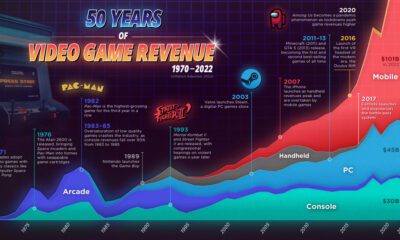

As technology has evolved, so too has the video game industry, consumer preferences, and drivers of growth. We do a deep dive.


Media trust among Americans has reached its lowest point since Trump won the 2016 presidential election.


The world's millionaire population has more than doubled in the last decade between 2012 and 2022. We visualize these numbers here.


Explore the age distribution of the 422 nuclear reactors operating globally in this infographic.
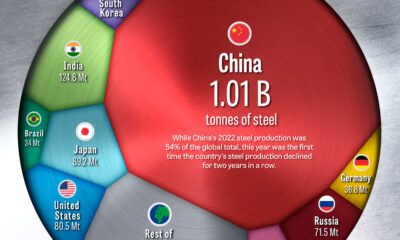

China has dominated global steel production the past few decades, but how did the country get here, and is its production growth over?


Globally, central banks bought a record 1,136 tonnes of gold in 2022. How has central bank gold demand changed over the last three decades?


While Russia still makes billions from fossil fuel exports, revenues are declining. Here are the largest importers since the start of the invasion.


How much oil, coal, and natural gas do we extract each year? See the scale of annual fossil fuel production in perspective.
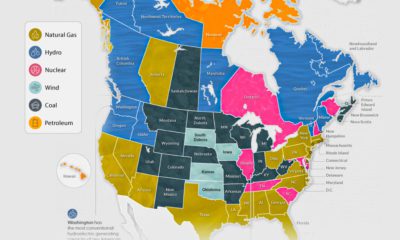

The U.S. and Canada rely on a different makeup of sources to generate their electricity. How does each state and province make theirs?
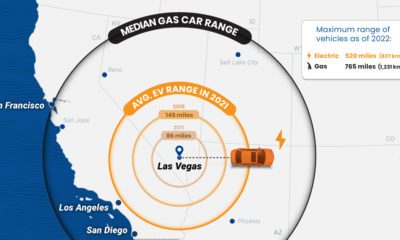

With range anxiety being a barrier to EV adoption, how far can an electric car go on one charge, and how do EV ranges compare with...
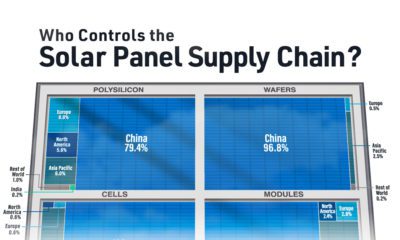

The supply chain is key for the renewable energy revolution, and this chart visualizes where the world's solar panels are manufactured.
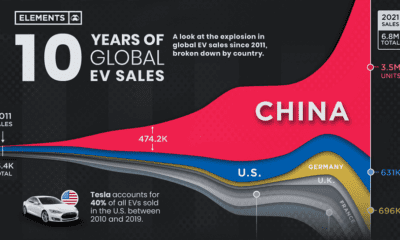

Global EV sales have grown exponentially, more than doubling in 2021 to 6.8 million units. Here's a look at EV sales by country since 2011.
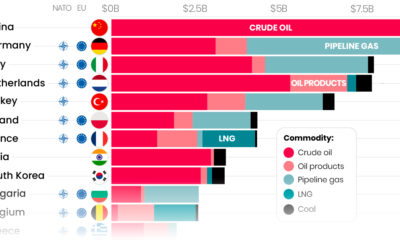

Here are the top importers of Russian fossil fuels since the start of the war.
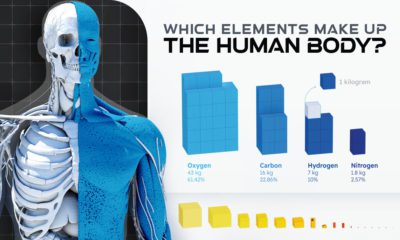

Of the 118 chemical elements found on Earth, only 21 make up the human body. Here we break down the elemental composition of the average human.
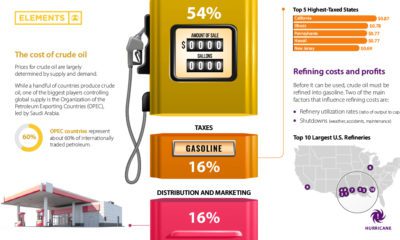

Gasoline prices across the U.S. have reached record-highs. Why? This graphic helps explain what factors influence the cost of gasoline.
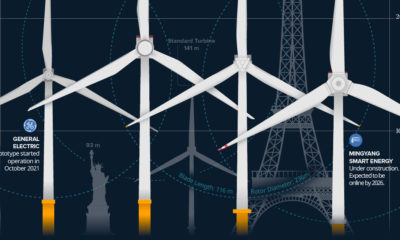

The biggest wind turbines can reach over 200 meters and cost more than $12 million to manufacture and install.


With some esports companies more valuable than traditional sports teams, we visualize esports vs sports in franchise value.


This graphic explores 20 years of Nintendo console sales and the success of the Nintendo Switch.
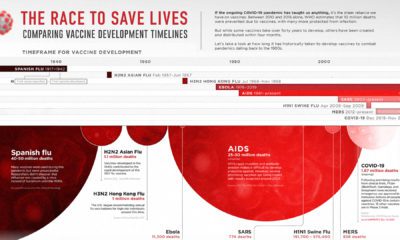

This graphic looks at how long vaccine development has historically taken for pandemics dating back to the 1900s.
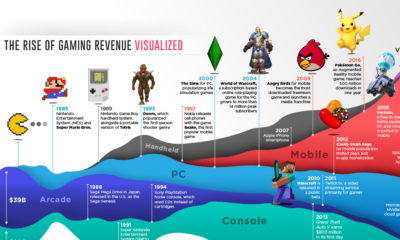

Visualizing 50 years of gaming history, from the first wave of arcades and home consoles to a tsunami of mobile gaming.
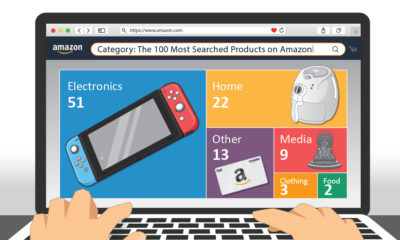

This graphic highlights the top product searches on Amazon in the U.S., providing a glimpse of what items American consumers are after.
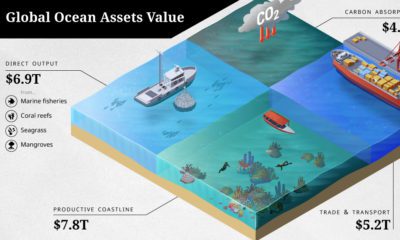

The ocean economy is under threat. How are human activities impacting the sustainable use of our ocean assets, valued at over $24 trillion?
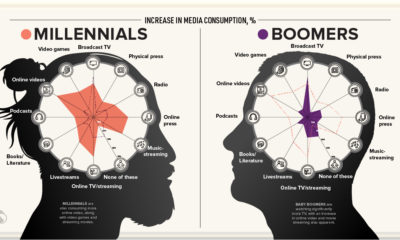

This visualization explores how each generation's media consumption is changing amid the frenzy of pandemic-induced quarantines.


Social distancing has been the first line of defense against COVID-19. We look at the math and science behind social distancing, to show how it works.
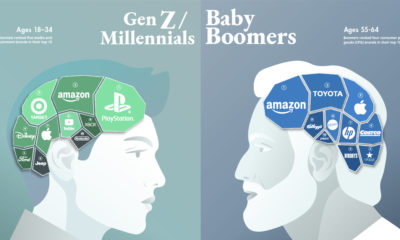

Can a brand transcend time and be all things to all people? This graphic seeks to find out by visualizing the most loved brands by generation.


