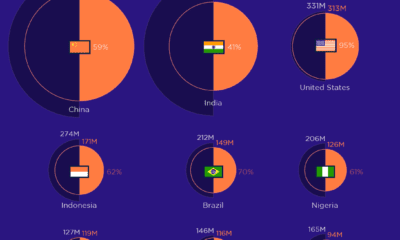

When it comes to internet users, some of the largest digital communities across the globe still hold massive amounts of untapped potential.
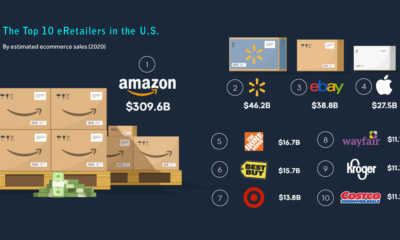

Amazon dominates the U.S. ecommerce market. By the end of 2020, the tech giant is expected to make up 39% of total U.S. ecommerce sales.
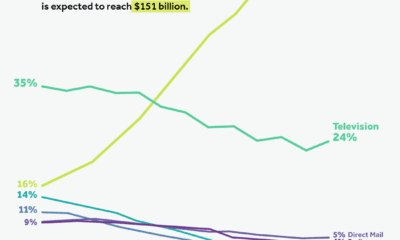

Internet advertising has shown steady growth in the last decade. By 2024, it’s projected to capture 60% of total ad spend in the United States.
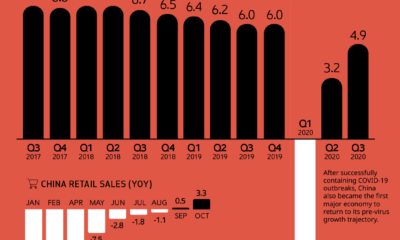

China’s economy took a massive hit in 2020 because of COVID-19, but Q2 2020 showed a speedy recovery. Here’s how the country fared in Q3.
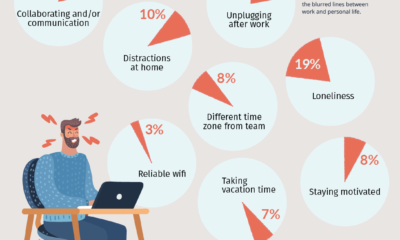

Despite the many benefits of working from home, remote workers have their own set of challenges. Here are the top struggles remote workers face.
Here’s a look at the different parts of Amazon’s revenue model, and how much money each business segment makes.
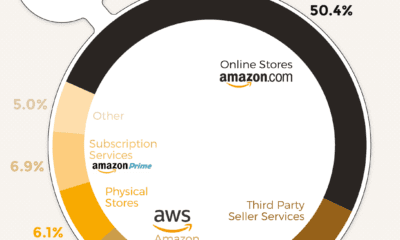

In 2019, Amazon generated $281 billion in total revenue—but where does all this revenue come from? Here’s a breakdown of how Amazon makes its money.
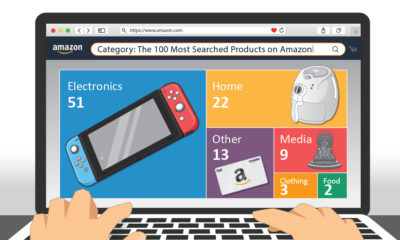

This graphic highlights the top product searches on Amazon in the U.S., providing a glimpse of what items American consumers are after.


From wildfire smoke molecules to the coronavirus, this graphic compares the relative size of particles that we, for the most part, can't see.
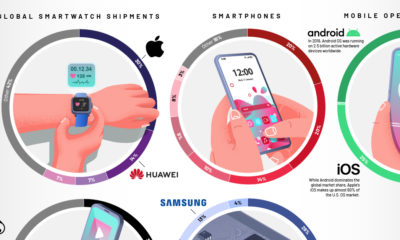

This graphic provides a snapshot of the leading brands currently dominating the personal tech market across the globe.


What’s America been craving? Here’s a look at the top 50 most popular fast food chains, ranked by U.S. sales in 2019.


This graphic looks at 29 different psychological tricks that marketers use to try and influence consumer behavior.
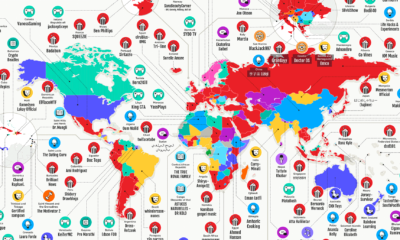

This interesting graphic gives an overview of the world’s most popular—and the highest paid—YouTubers in 187 different countries.
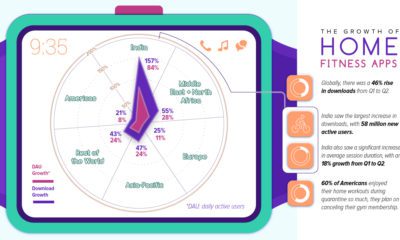

During lockdown, fitness apps have seen a huge spike in downloads worldwide. Which regions are driving this growth?
Who’s the richest of them all? Here's a look at the 25 wealthiest families in the world, and the companies that kickstarted their empires.
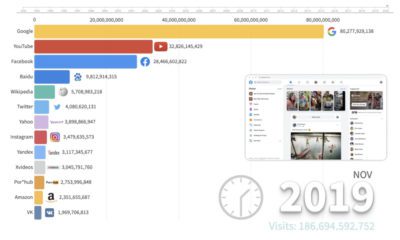

This animation provides an interesting overview of the websites with the highest traffic over the last few decades, and how the rankings have changed.
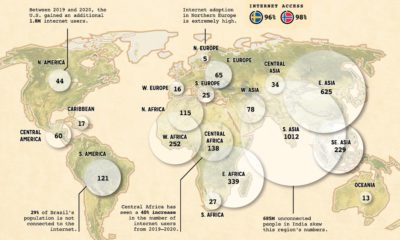

When it comes to worldwide internet use, which regions are the most disconnected? And which regions have the most opportunity for growth?
Ammonium nitrate is dangerous, and every few years, there's a new explosion that causes widespread damage. These are some of the biggest ones.
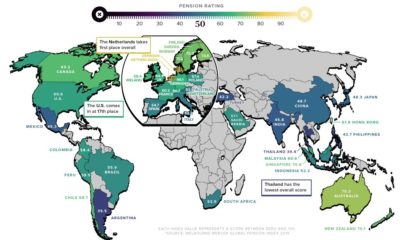

As the global population ages, pension reform is more important than ever. Here’s a breakdown of how key countries rank in terms of pension plans.
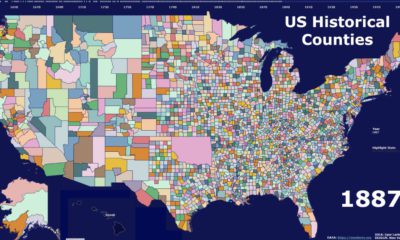

This video highlights the history of American counties, and how their boundaries have changed over the last 300 years.


This fascinating animated map provides an overview of the top trending Google searches in every state over the last decade.
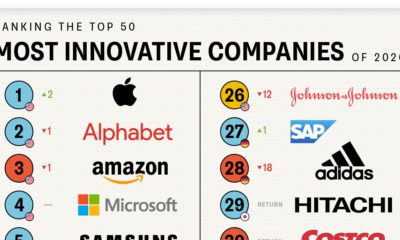

Companies need to adapt quickly to changing markets in order to thrive. Here’s a look at the top 50 most innovative companies in 2020.
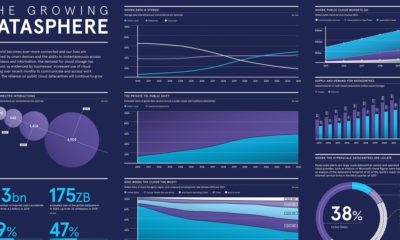

The size of the global datasphere is expected to hit 175 ZB by 2025, and this data is increasingly stored in the cloud.
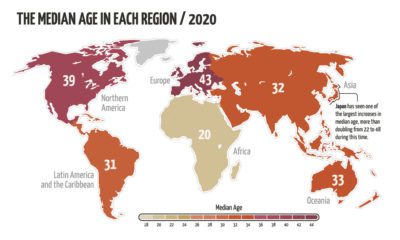

The world’s population is aging, but not at the same rate. This animated map visualizes the changes in median age in every region since 1950.
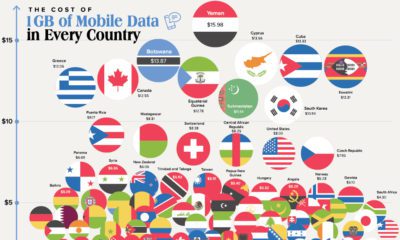

Globally, the cost of mobile data ranges between $0.09 per GB up to $27 per GB. Here's how it breaks down in 150+ countries.


