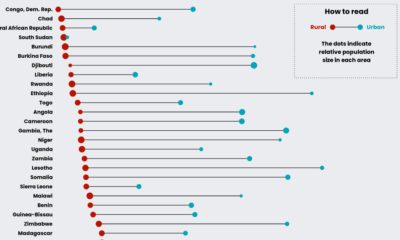

This graphic compares water accessibility in countries across Sub-Saharan Africa, showing the gap between its rural and urban populations.
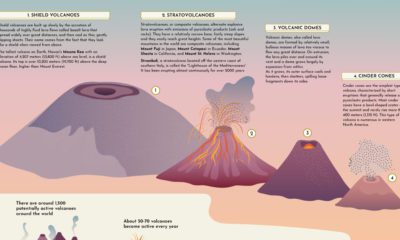

This graphic provides a brief introduction to volcanoes, explaining their different types of shapes and sizes, and how they erupt.
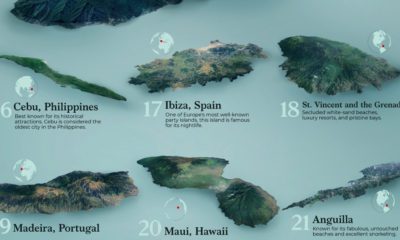

This graphic uses survey data from Travel + Leisure magazine to show the 25 best islands to visit around the world.
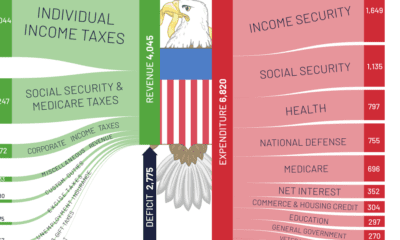

The U.S. deficit hit $2.7 trillion in 2021, the second highest on record. Here's a look at U.S. federal spending compared to revenue last year.
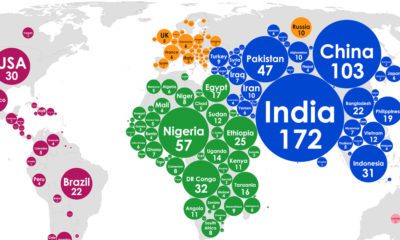

This graphic paints a picture of the world's population, showing which countries are most likely to welcome the next 1,000 babies.
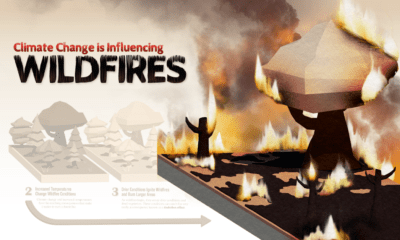

More carbon in the atmosphere is creating a hotter world—and gradually fueling both climate change and instances of wildfires.
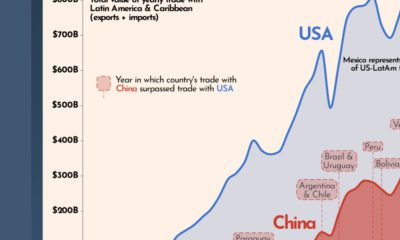

Over the last two decades, trade between China and Latin America has grown significantly, which has threatened U.S. dominance in the region.


Here are 10 razors, or rules of thumb, that help simplify decision-making, inspired by a list curated by the investor and thought leader Sahil Bloom.
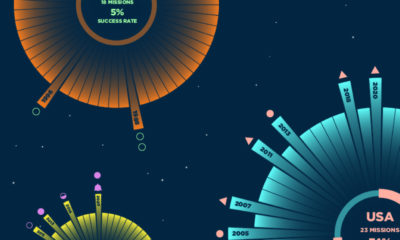

This graphic shows a timeline of every mission to Mars since 1960, highlighting which ones have been successful and which ones haven't.
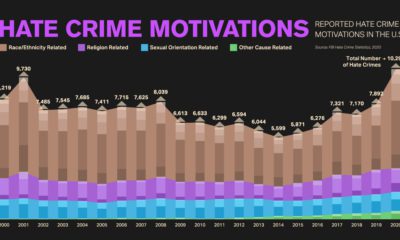

Hate crimes across the U.S. have been on the rise since 2014. Here's a look at the most common types of offenses over the years.

Mining bitcoin is costly. But the exact price fluctuates, depending on the location and the cost of electricity in the area.
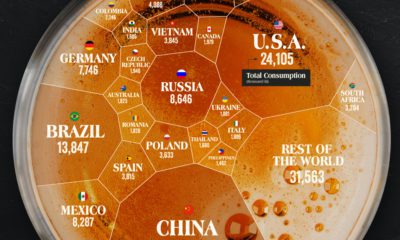

Which countries drink the most beer? China ranks number one due to its sheer size, and the Czech Republic comes out on top, per capita.

Global wheat production is concentrated in just a handful of countries. Here’s a look at the top wheat-producing countries worldwide.
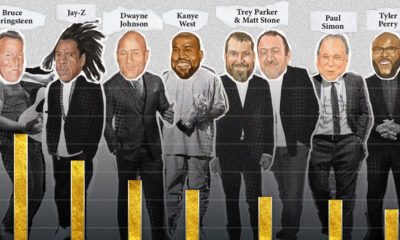

In 2021, the top 10 highest-paid celebrities earned a combined $2.7 billion. Peter Jackson came in first place, earning $580 million.
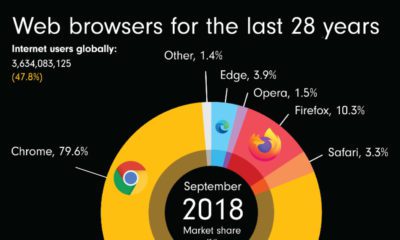

This animation shows the evolution of web browser market share since 1994, showing the rise and fall of various internet portals.
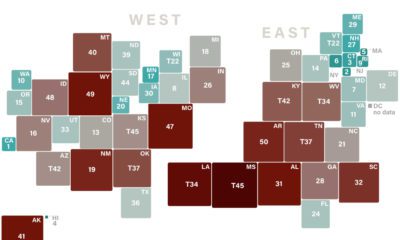

This graphic compares and contrasts gun laws and gun-related deaths across the U.S., by state.
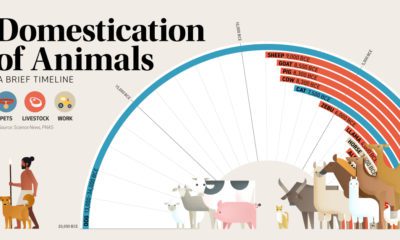

This graphic shows a timeline of when 15 different animals became domesticated, based on archaeological findings.
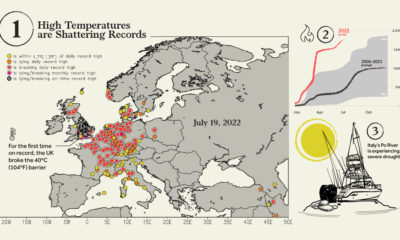

Smoldering temperatures are wreaking havoc across Europe. Here are 5 key things you should know about Europe's current heatwave.
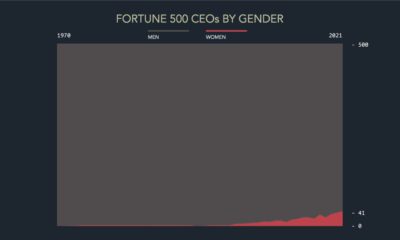

The gender gap in corporate America is still prevalent, especially in leadership roles. In 2021, only 8.2% of Fortune 500 CEOs were female.
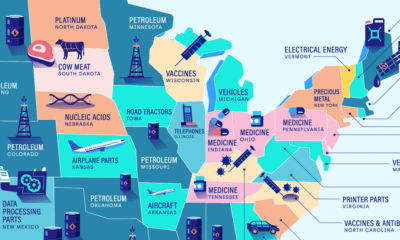

Petroleum is the top import in twelve states, making it the most commonly imported commodity across America. Here are America’s top imports.
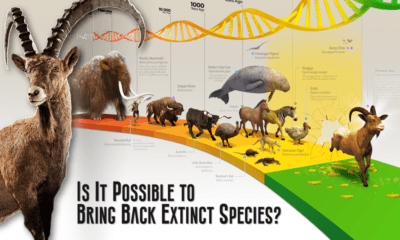

This graphic provides an introduction to de-extinction, a field of biology focused on reviving extinct animal species.
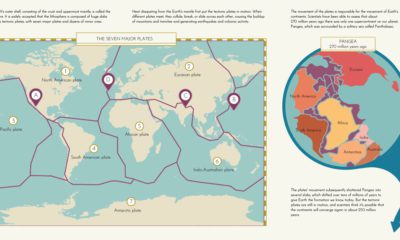

This graphic provides an explanation of plate tectonics and highlights the seven major tectonic plates that make up Earth’s outer crust.


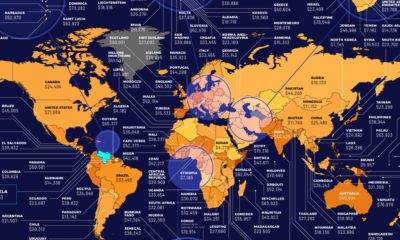
This graphic compares the cost of living and purchasing power of 578 cities worldwide, using New York City as a benchmark for comparison.
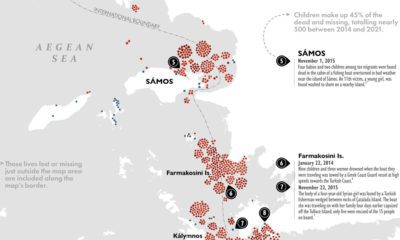

Each year, thousands of migrants take the journey along the Eastern Mediterranean to get to the EU. Some never make it to their destination.
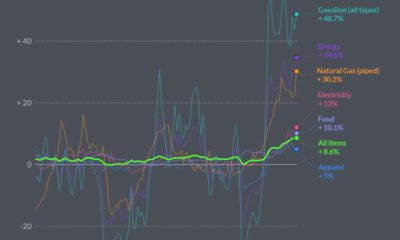

In May 2022, U.S. Inflation was the highest its been since 1981. Here’s a look at which products saw the biggest price jumps.
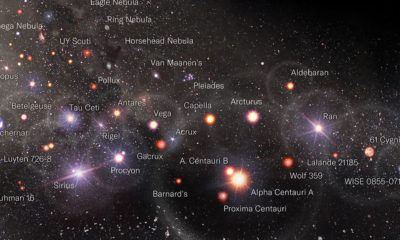

Scientists believe we've only discovered about 5% of the universe. Here's a map of what we've found so far, visualized using a log scale.
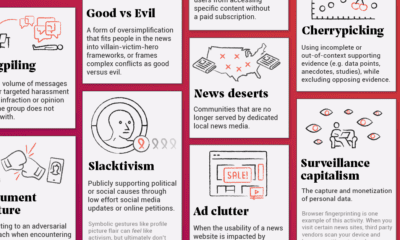

In this infographic, we catalog 33 problems with the social and mass media ecosystem.
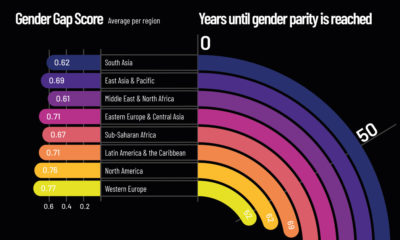

At our current rate of change, it will take up to 136 years to close the global gender gap. Here's a look at gender inequality across...
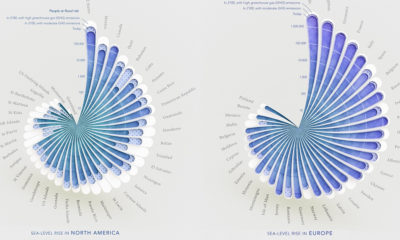

Here's a look at how people around the world could be impacted by coastal flooding by 2100, based on rising sea level projections.
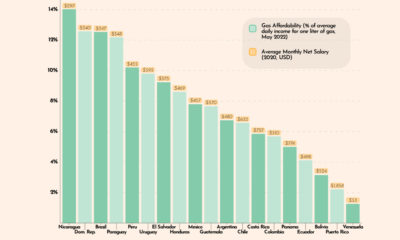

This graphic looks at gas affordability in Latin America, showing how much a liter of gas costs in 19 countries, relative to average incomes.
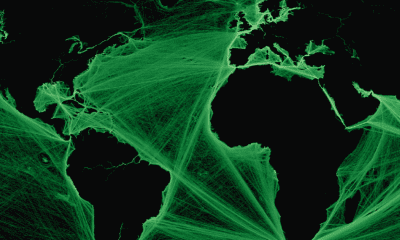

Where are the world’s major shipping lanes? These maps show global maritime traffic density, highlighting some of the busiest areas across the globe.
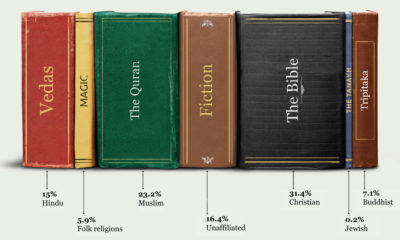

This graphic shows a breakdown of the world's major religions, and how much of the global population follows each one.
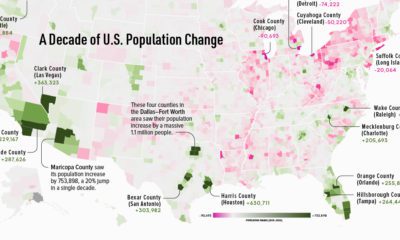

This map shows which counties in the U.S. have seen the most growth, and which places have seen their populations dwindle in the last 10 years.
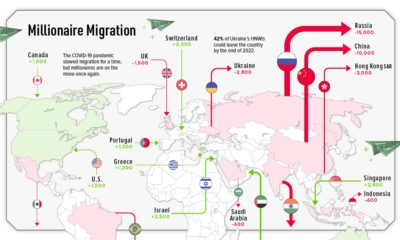

This graphic maps out the migration of millionaires across the globe, showing the top 10 countries the ultra-rich are moving to and from.
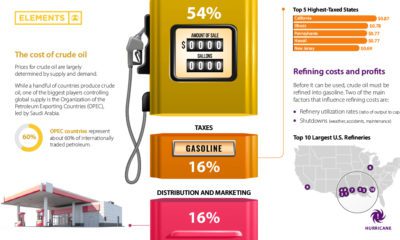

Gasoline prices across the U.S. have reached record-highs. Why? This graphic helps explain what factors influence the cost of gasoline.

Since 1950, global fertility rates have decreased steadily. Now. the average woman has less than 3 children on average.
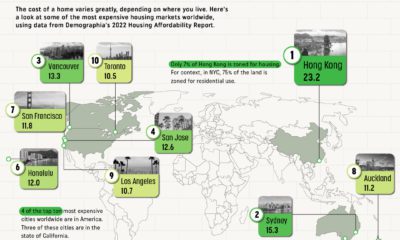

An analysis of 90+ major cities reveals which ones are the least affordable housing markets based on their price-to-income ratio.
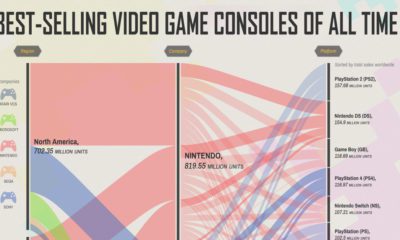

Video game consoles have changed drastically over the last 50 years. Here are some of the best-selling ones across the globe.
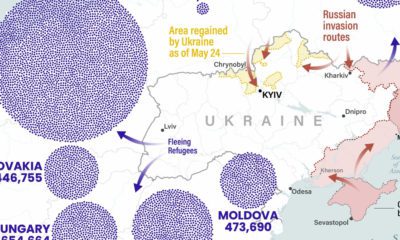

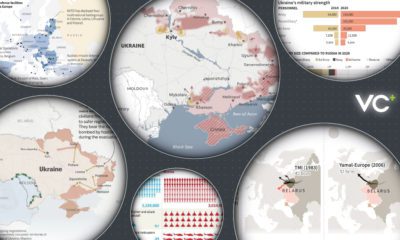
Russia’s invasion of Ukraine has sparked the largest European refugee crisis since WWII. See where refugees are fleeing to on this map.
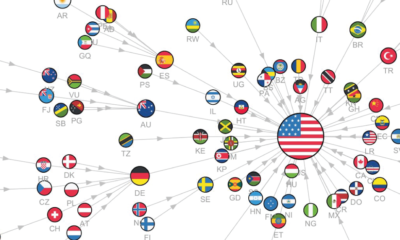

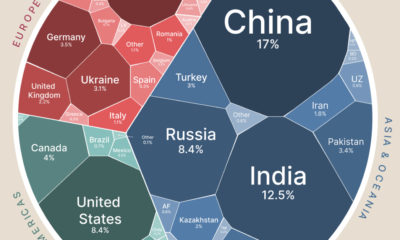
This series of visualizations uses Google trends search data to show the most googled countries around the world, from 2004 to 2022.
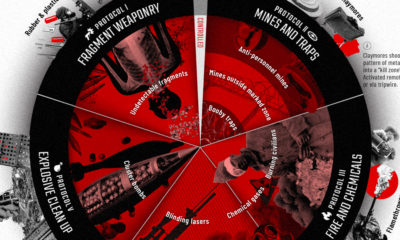

This infographic covers the various types of weapons that are restricted or prohibited in war, according to international humanitarian laws.


Six of the top 10 most downloaded apps in Q1 2022 were social media apps, and four of them are owned by Meta.
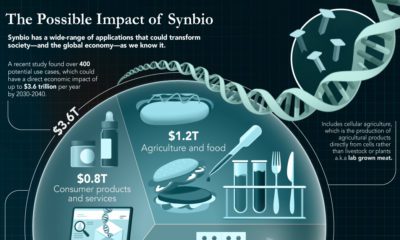

The field of synthetic biology could solve problems in a wide range of industries, from medicine to agriculture—here’s how.
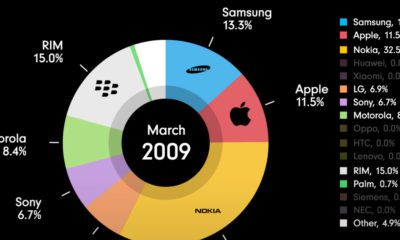

This animation chronicles the evolution of the mobile phone market, showing the rise and fall of various mobile phone manufacturers.


Here is what you need to know about PANS/PANDAS, and how your donations can help find a cure for these autoimmune disorders.
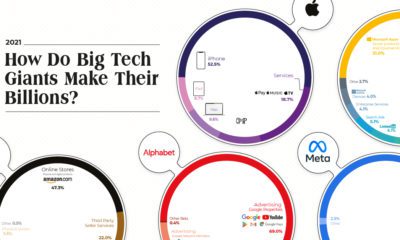

The Big Five tech companies made $1.4 trillion in revenue combined—more than Mexico’s entire GDP. Here's how they earned it all.
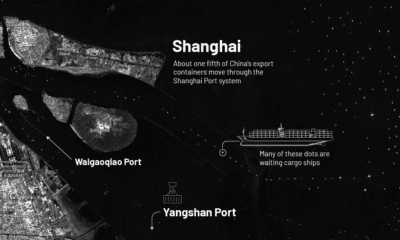

China's lockdown of Shanghai is causing massive back-ups at the world's largest container port. Hundreds of ships are now waiting at sea.
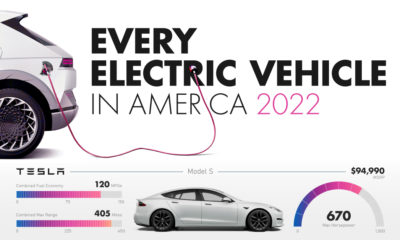

When it comes to purchasing electric cars, Americans have a few to choose from. Here’s a look at every electric vehicle sold in the U.S.
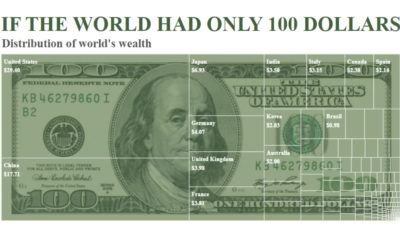

A majority of the world's wealth is concentrated in the U.S. and China. Here's a look at the distribution of household wealth worldwide.

Here's a sneak preview of features that VC+ members will have delivered straight to their inbox in April 2022.


 Creator Program