Visualizing the Interest Rates of U.S. Treasurys (2020-2025)
Visualizing the Global Stock Market by Sector
Ranked: The Worst Performing Stocks in the S&P 500 (2005-2024)
Charted: Average S&P 500 Return by Month Since 1950
Charted: S&P 500 Market Concentration Over 145 Years
Ranked: 2025’s Best Countries to Live and Work
Charted: The Decline of U.S. Software Developer Jobs
Mapped: Which U.S. States Import the Most From Canada and Mexico?
Ranked: The Top 20 Countries Holding the Most U.S. Debt
Ranked: The World’s Most Popular Programming Languages (2014-2024)
Mapped: Crypto Taxation Around the World
How Big is the Space Economy?
Charted: Which Jobs Are Using AI the Most?
Mapped: Billionaire Migration Over the Last Decade
Mapped: The Highest Marginal Income Tax Rate for Each U.S. State
The Average Income Tax by Wealth Bracket in America
Visualized: How Many Dollars Exist Per American?
Mapped: Europe’s Tobacco Use By Country
Charted: Cigarette Smoking’s Decline in U.S. Young Adults
Visualizing Drug Use Trends in U.S. Young Adults
Charted: The Surge of Vaping in America’s Young Adults
Visualized: Who Funds the World Health Organization?
Visualizing Chinese EV Market Share Overseas
Mapped: How Much Each Country Pays for Gas in 2025
How Many New Mines Are Needed for the Energy Transition?
Where the U.S. Gets Its Enriched Uranium
Oil & Gas Leases on Public Lands Under Obama, Trump, and Biden
Map Explainer: Greenland
Mapped: The State of Democracy Around the World
Mapped: Online Sports Betting Legality by State
Mapped: Ukraine’s Mineral Resources
How Rich is Canada in Natural Resources?
Charted: Top Suppliers of Aluminum and Steel to the U.S.
How Much Gold Exists for Every Person on Earth?
Charted: The Global Mining Industry, by Market Cap
Ranked: Google’s Thirstiest Data Centers
Visualizing California’s Drought Conditions (2000–2025)
How Much of the World’s Plastic Waste Actually Gets Recycled?
Mapped: Water Violations by State
Charted: Per-Capita CO2 Emissions by Global Region (1960-2022)
Just four states—California, New York, Florida, and Texas—account for more than 60% of all U.S. billionaires.
The top three economic powerhouses of Africa contribute more than one-third to the African economy. We rank the nations of the world's second-largest continent by 2024...
We chart current and effective retirement ages for 45 countries, revealing some stark regional differences.
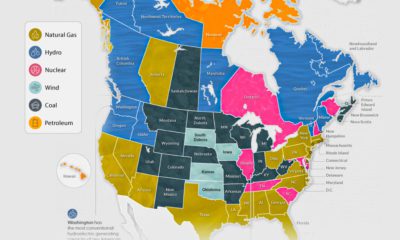
The U.S. and Canada rely on a different makeup of sources to generate their electricity. How does each state and province make theirs?
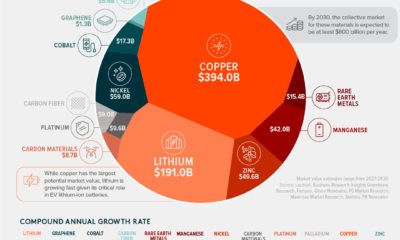
Disruptive materials are key inputs in emerging, next-generation technologies. See how the forecasted market value for these materials is expected to surge by billions in the...
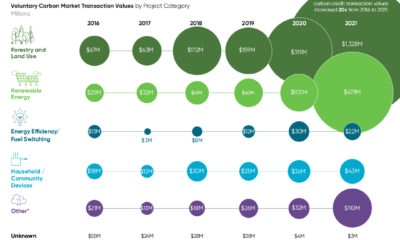
Carbon credits from nature-based solutions are in high demand as organizations look to shrink their carbon footprints.
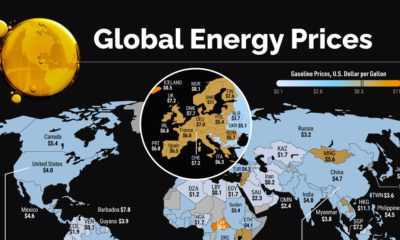
Energy prices have been extremely volatile in 2022. Which countries are seeing the highest prices in the world?
Many new technologies critical to the energy transition rely on copper. Here are the world's largest copper producers.
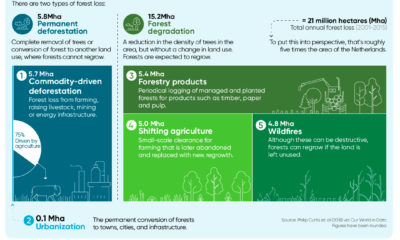
Approximately 15 billion trees are cut down annually across the world. Here's a look at the five major drivers of forest loss. (Sponsored)
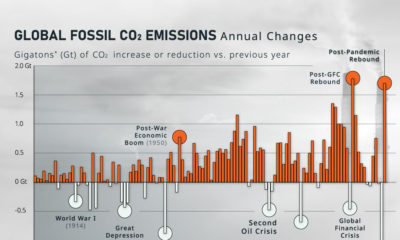
How much do global CO₂ emissions change on a year-to-year basis? Here, we show the annual rate of change in emissions since 1900.
2021 saw an alarming rise in the frequency and sophistication of corporate hacks. View this infographic to learn more.
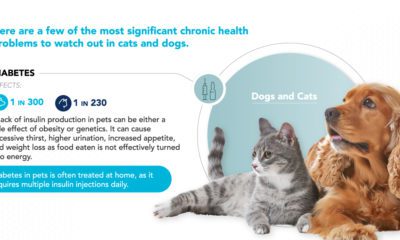
The global pet health care market is set to surpass $350 billion by 2027. Which chronic illnesses are most prevalent in pets?
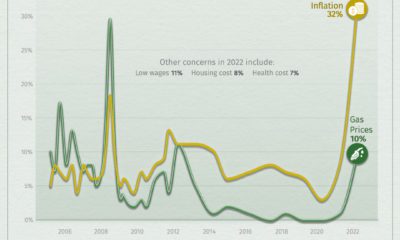
Many Americans are feeling the sting of inflation as everyday items like food and fuel have seen big price increases.
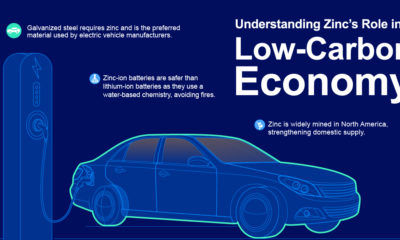
Many people are unaware of zinc’s powerful applications. This graphic by Teck looks at zinc's important role in the low-carbon economy.