Energy
Animation: How Wind Turbines Work
The windmill, which converts wind into rotational energy to mill grain or pump water, has been around since antiquity. It’s even been claimed that Ancient Babylonians planned to harness wind as early as almost 4,000 years ago, as part of a scheme for one of Hammurabi’s ambitious irrigation projects.
By the end of the 19th century, wind energy took on a whole new meaning as engineers in Scotland, Denmark, and the United States invented the first wind turbines that generated electricity. Many technological improvements have been made since, and now modern wind farms dot the landscapes of countries around the world.
Related Topic: What it Would Take to Power New York City
Today, wind power is an important element of the green energy mix, and its estimated that 432 GW of wind farms are installed globally. In the United States, nearly 5% of all power is now generated by wind.
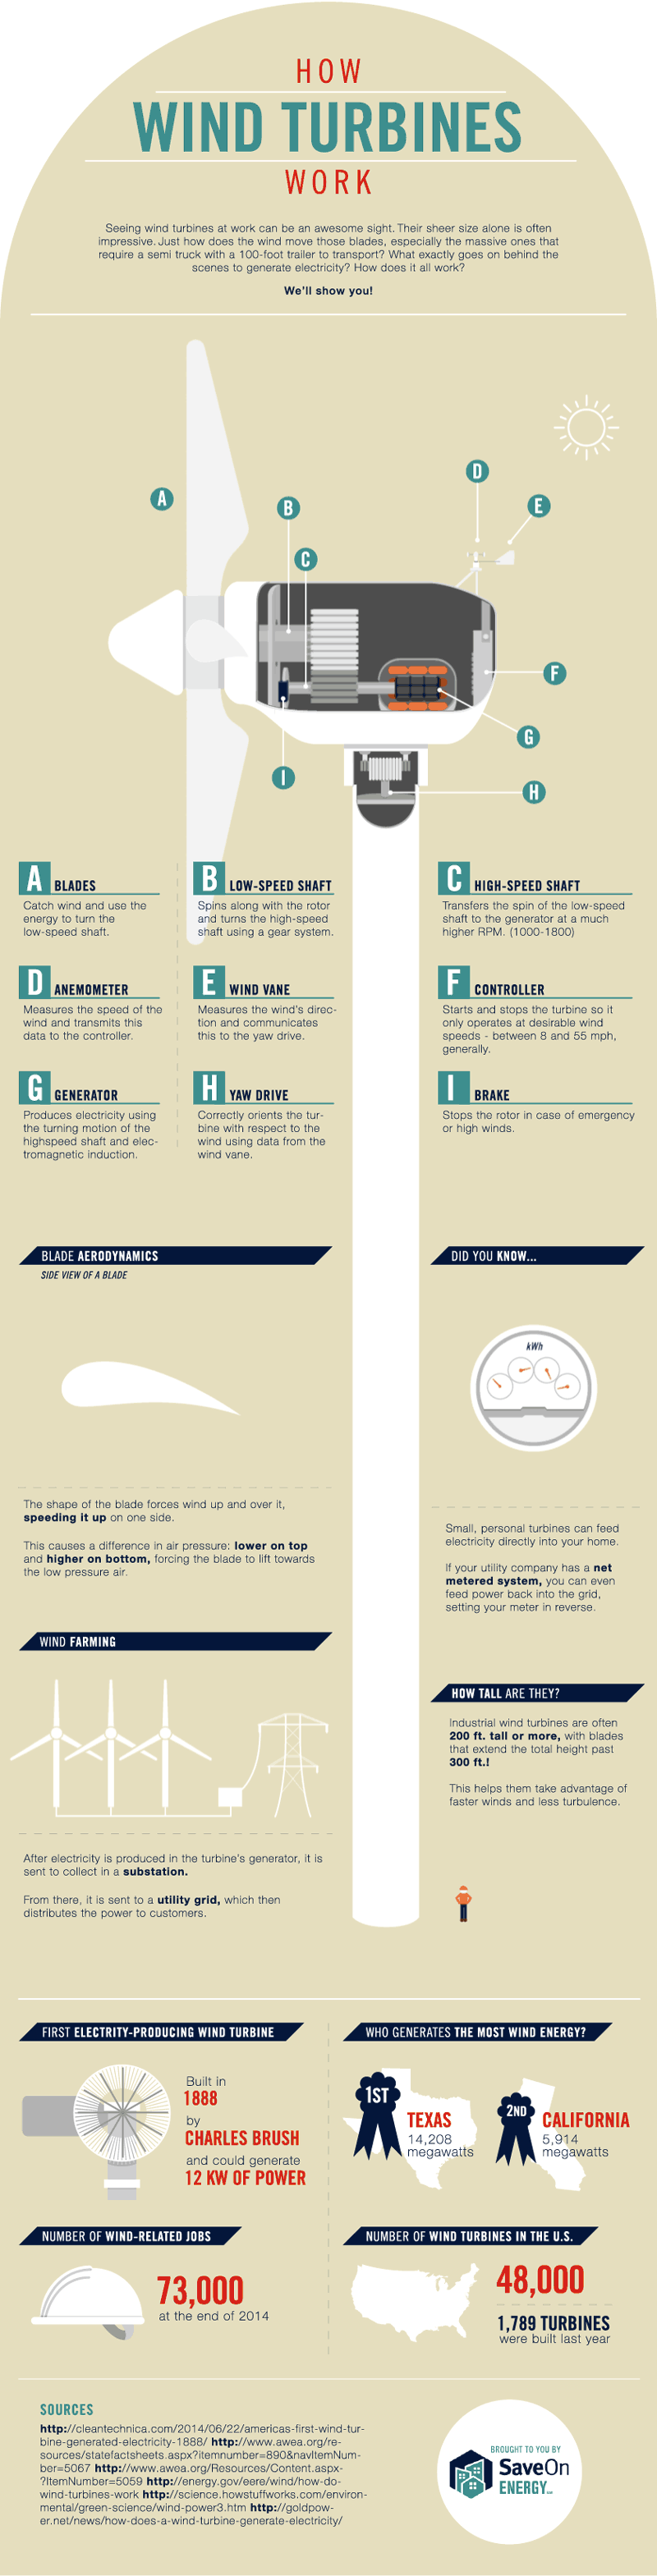
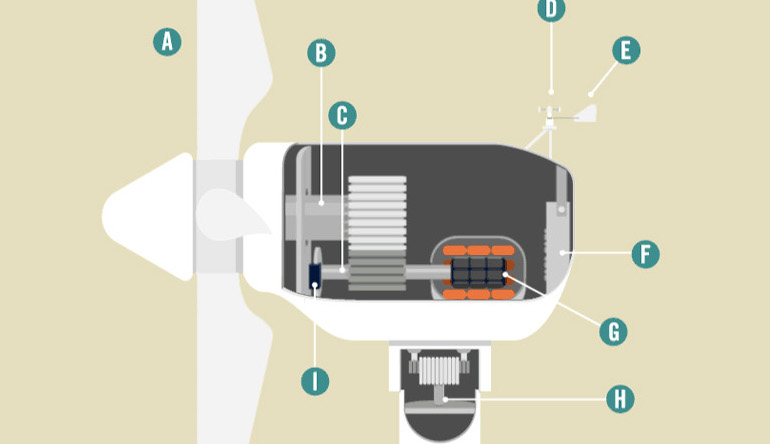
How Wind Turbines Work
How do these massive propellers get into motion? Once they are turning, what do they do?
As shown in the animation, it’s all about the lift and drag forces created by the shape of the blades. Lift acts perpendicular to the direction of wind flow and drag acts parallel to the direction of wind flow.
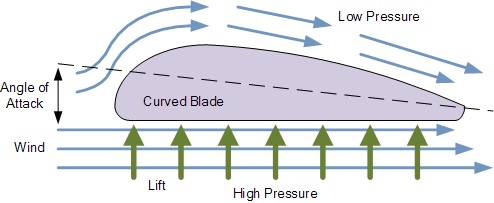
The blades are designed so that when wind passes, a low-pressure pocket of air is created by faster moving wind on the curved side of the blade. This sucks the blade in the downwind direction, creating lift. The blades are then connected to a series of shafts that spin an electromagnetic induction generator, and this creates electricity.
There are some other bells and whistles that help to maximize efficiency in a modern wind turbine as well.
The anemometer measures wind speed, while the controller starts and stops the turbines to operate only at desirable wind speeds (between 8 and 55 kmph). The wind vane measures the wind’s direction and communicates this information to the yaw drive, which helps make adjustments to the turbine’s orientation. Lastly, there is also a braking system installed which can be used for emergency stops when wind speeds get too extreme.
Original graphic by: SaveOnEnergy


Energy
The World’s Biggest Nuclear Energy Producers
China has grown its nuclear capacity over the last decade, now ranking second on the list of top nuclear energy producers.


The World’s Biggest Nuclear Energy Producers
This was originally posted on our Voronoi app. Download the app for free on Apple or Android and discover incredible data-driven charts from a variety of trusted sources.
Scientists in South Korea recently broke a record in a nuclear fusion experiment. For 48 seconds, they sustained a temperature seven times that of the sun’s core.
But generating commercially viable energy from nuclear fusion still remains more science fiction than reality. Meanwhile, its more reliable sibling, nuclear fission, has been powering our world for many decades.
In this graphic, we visualized the top producers of nuclear energy by their share of the global total, measured in terawatt hours (TWh). Data for this was sourced from the Nuclear Energy Institute, last updated in August 2022.
Which Country Generates the Most Nuclear Energy?
Nuclear energy production in the U.S. is more than twice the amount produced by China (ranked second) and France (ranked third) put together. In total, the U.S. accounts for nearly 30% of global nuclear energy output.
However, nuclear power only accounts for one-fifth of America’s electricity supply. This is in contrast to France, which generates 60% of its electricity from nuclear plants.
| Rank | Country | Nuclear Energy Produced (TWh) | % of Total |
|---|---|---|---|
| 1 | 🇺🇸 U.S. | 772 | 29% |
| 2 | 🇨🇳 China | 383 | 14% |
| 3 | 🇫🇷 France | 363 | 14% |
| 4 | 🇷🇺 Russia | 208 | 8% |
| 5 | 🇰🇷 South Korea | 150 | 6% |
| 6 | 🇨🇦 Canada | 87 | 3% |
| 7 | 🇺🇦 Ukraine | 81 | 3% |
| 8 | 🇩🇪 Germany | 65 | 2% |
| 9 | 🇯🇵 Japan | 61 | 2% |
| 10 | 🇪🇸 Spain | 54 | 2% |
| 11 | 🇸🇪 Sweden | 51 | 2% |
| 12 | 🇧🇪 Belgium | 48 | 2% |
| 13 | 🇬🇧 UK | 42 | 2% |
| 14 | 🇮🇳 India | 40 | 2% |
| 15 | 🇨🇿 Czech Republic | 29 | 1% |
| N/A | 🌐 Other | 219 | 8% |
| N/A | 🌍 Total | 2,653 | 100% |
Another highlight is how China has rapidly grown its nuclear energy capabilities in the last decade. Between 2016 and 2021, for example, it increased its share of global nuclear energy output from less than 10% to more than 14%, overtaking France for second place.
On the opposite end, the UK’s share has slipped to 2% over the same time period.
Meanwhile, Ukraine has heavily relied on nuclear energy to power its grid. In March 2022, it lost access to its key Zaporizhzhia Nuclear Power Station after Russian forces wrested control of the facility. With six 1,000 MW reactors, the plant is one of the largest in Europe. It is currently not producing any power, and has been the site of recent drone attacks.

-

 Real Estate2 weeks ago
Visualizing America’s Shortage of Affordable Homes
-

 Technology1 week ago
Ranked: Semiconductor Companies by Industry Revenue Share
-

 Money2 weeks ago
Which States Have the Highest Minimum Wage in America?
-

 Real Estate2 weeks ago
Ranked: The Most Valuable Housing Markets in America
-

 Business2 weeks ago
Charted: Big Four Market Share by S&P 500 Audits
-

 AI2 weeks ago
The Stock Performance of U.S. Chipmakers So Far in 2024
-

 Misc2 weeks ago
Almost Every EV Stock is Down After Q1 2024
-

 Money2 weeks ago
Where Does One U.S. Tax Dollar Go?