Markets
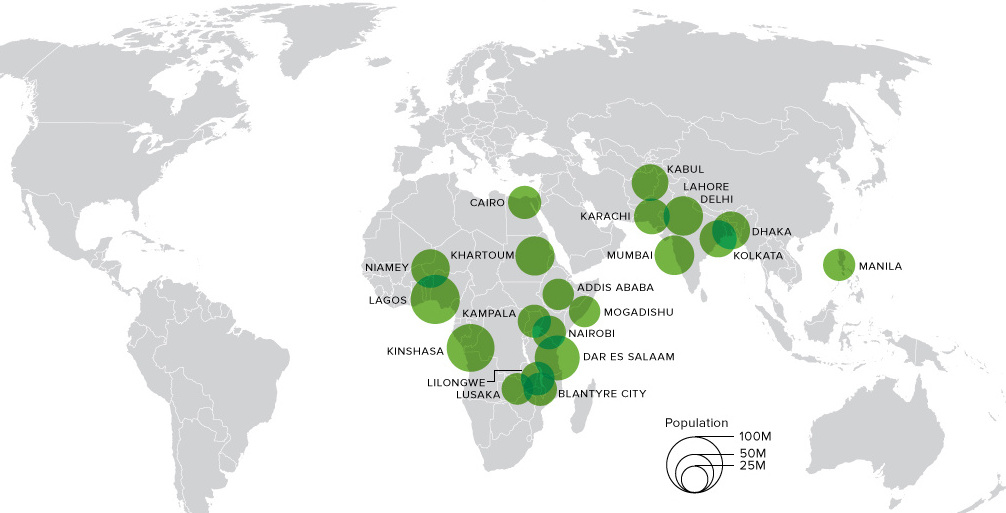
Animated Map: The 20 Most Populous Cities in the World by 2100
Animated Map: The Most Populous Cities in the World
In Africa Alone, 13 Cities Will Pass NYC in Size
The Chart of the Week is a weekly Visual Capitalist feature on Fridays.
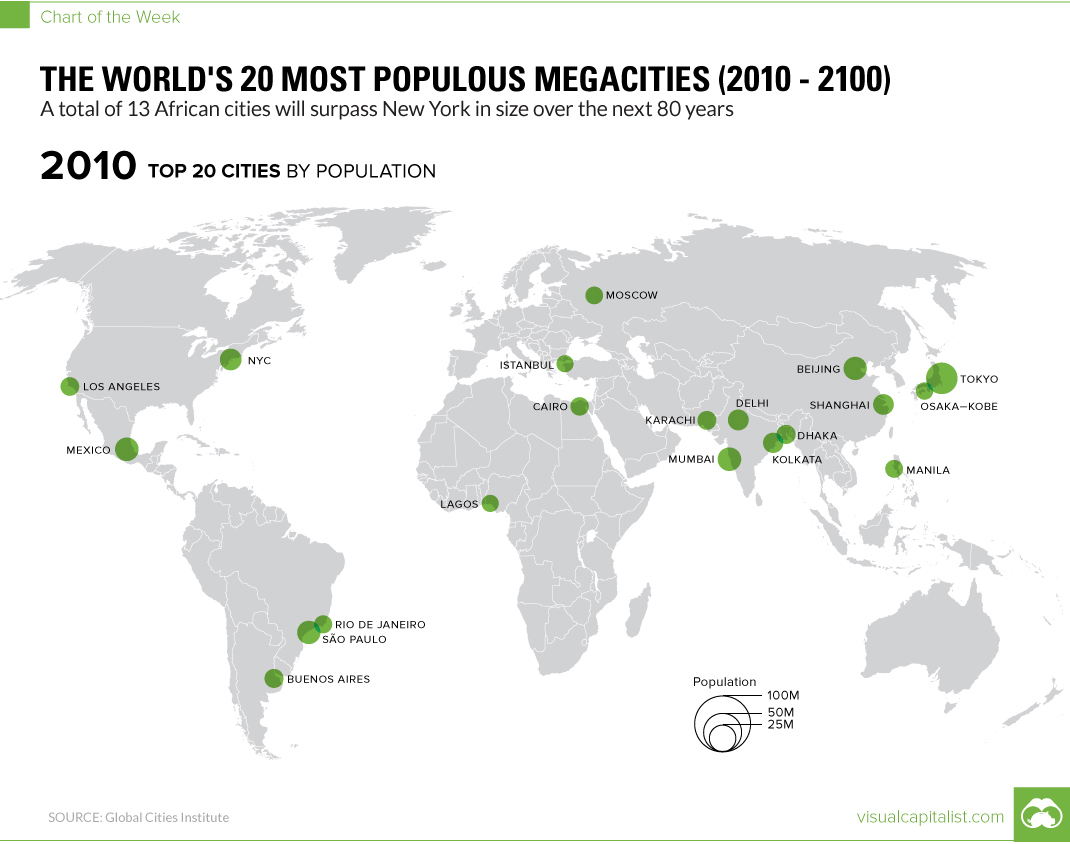
If you look at a modern map of the world’s most populous cities, you’ll notice that they are quite evenly distributed around the globe.
Metropolises like Moscow, New York, Tokyo, Cairo, or Rio de Janeiro are spread apart with very different geographic and cultural settings, and practically every continent today can claim at least one of the world’s 20 most populous cities.
In the future, things will be very different, according to projections from the Global Cities Institute. In fact, over the next 80 years or so, some cities will literally 10x or 20x in size – turning into giant megacities that have comparable populations to entire countries like modern-day Germany, France, or the United Kingdom.
The most interesting part? None of these cities will be in the Americas, Europe, China, or Australia.
The Top Four Megacities of the Future
According to predictions from the Global Cities Institute, these will be the biggest cities in the world in 2100:
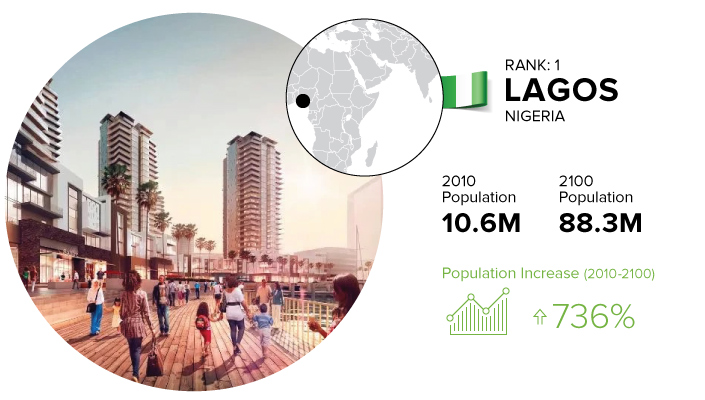
Lagos is already one of the biggest metropolises in Africa, and we previously noted that it was one of the fastest growing cities in the world.
In fact, it’s growing so fast, that no one knows how big it actually is. The U.N estimated it had 11.2 million people in 2011, and the year after The New York Times said it had at least 21 million inhabitants. In any case, this Nigerian metropolis is growing like a weed, and the Global Cities Institute estimates that the city’s population will hit the 88.3 million mark by 2100 to make it the biggest city in the world.
The city is already a center of West African trade and finance – but Lagos has ambitious plans to up the ante even further. Right now, the city is building Eko Atlantic, a massive new residential and commercial development that is being pitched as the “Manhattan of Nigeria”. It’s just off of Victoria Island, and it is being built on reclaimed land with special measures in place to prevent flooding from global warming.
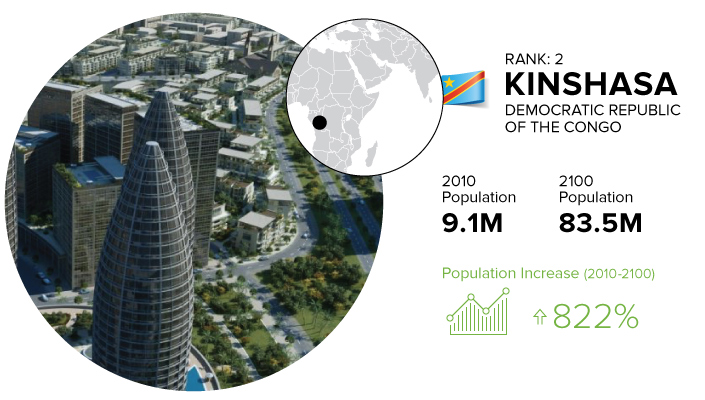
When people think of the DRC, sprawling metropolises generally aren’t the first things that come to mind.
But Kinshasa, once the site of humble fishing villages, has already likely passed Paris as the largest French-speaking city in the world. And it’s getting bigger – by 2100, it’s projected to be the world’s second largest city overall.
How Kinshasa develops will certainly be interesting. As it stands, approximately 60% of the 17 million people living there by 2025 will be younger than 18 years old. How the city deals with education will be paramount to the city’s future progression.
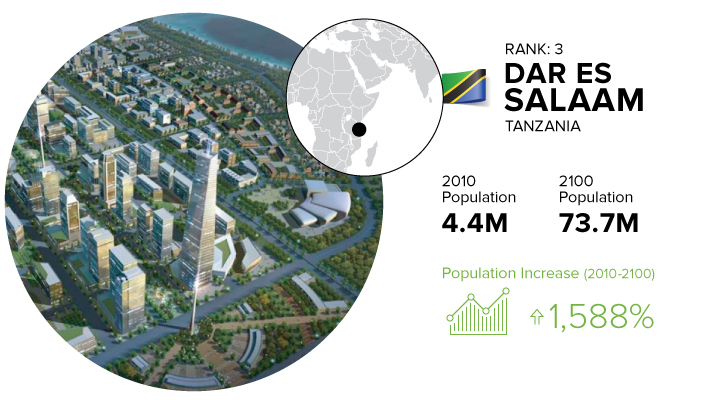
Have you heard of Dar Es Salaam, the Tanzanian megacity that will hold 73.7 million inhabitants in 2100?
It’s not on a lot of people’s radars, but its population will explode 1,588% to become the third largest city in Africa, and in the world.
Interestingly, East Africa will be home to many of the world’s biggest cities in the future – and many will be seemingly popping up out of nowhere. Consider Blantyre City, Lilongwe, and Lusaka, for example. Most Westerners will not likely have heard of these places, but these centers in Malawi and Zambia will each hold over 35 million people.

Finally, the last city to round out the top four is Mumbai, which is already one of the world’s biggest megacities with over 20 million people.
As the entertainment capital of India, it will be interesting to see how Mumbai evolves – and how it ends up comparing to other Indian megacities like Delhi and Kolkata, which each will hold over 50 million residents themselves.


Markets
U.S. Debt Interest Payments Reach $1 Trillion
U.S. debt interest payments have surged past the $1 trillion dollar mark, amid high interest rates and an ever-expanding debt burden.


U.S. Debt Interest Payments Reach $1 Trillion
This was originally posted on our Voronoi app. Download the app for free on iOS or Android and discover incredible data-driven charts from a variety of trusted sources.
The cost of paying for America’s national debt crossed the $1 trillion dollar mark in 2023, driven by high interest rates and a record $34 trillion mountain of debt.
Over the last decade, U.S. debt interest payments have more than doubled amid vast government spending during the pandemic crisis. As debt payments continue to soar, the Congressional Budget Office (CBO) reported that debt servicing costs surpassed defense spending for the first time ever this year.
This graphic shows the sharp rise in U.S. debt payments, based on data from the Federal Reserve.
A $1 Trillion Interest Bill, and Growing
Below, we show how U.S. debt interest payments have risen at a faster pace than at another time in modern history:
| Date | Interest Payments | U.S. National Debt |
|---|---|---|
| 2023 | $1.0T | $34.0T |
| 2022 | $830B | $31.4T |
| 2021 | $612B | $29.6T |
| 2020 | $518B | $27.7T |
| 2019 | $564B | $23.2T |
| 2018 | $571B | $22.0T |
| 2017 | $493B | $20.5T |
| 2016 | $460B | $20.0T |
| 2015 | $435B | $18.9T |
| 2014 | $442B | $18.1T |
| 2013 | $425B | $17.2T |
| 2012 | $417B | $16.4T |
| 2011 | $433B | $15.2T |
| 2010 | $400B | $14.0T |
| 2009 | $354B | $12.3T |
| 2008 | $380B | $10.7T |
| 2007 | $414B | $9.2T |
| 2006 | $387B | $8.7T |
| 2005 | $355B | $8.2T |
| 2004 | $318B | $7.6T |
| 2003 | $294B | $7.0T |
| 2002 | $298B | $6.4T |
| 2001 | $318B | $5.9T |
| 2000 | $353B | $5.7T |
| 1999 | $353B | $5.8T |
| 1998 | $360B | $5.6T |
| 1997 | $368B | $5.5T |
| 1996 | $362B | $5.3T |
| 1995 | $357B | $5.0T |
| 1994 | $334B | $4.8T |
| 1993 | $311B | $4.5T |
| 1992 | $306B | $4.2T |
| 1991 | $308B | $3.8T |
| 1990 | $298B | $3.4T |
| 1989 | $275B | $3.0T |
| 1988 | $254B | $2.7T |
| 1987 | $240B | $2.4T |
| 1986 | $225B | $2.2T |
| 1985 | $219B | $1.9T |
| 1984 | $205B | $1.7T |
| 1983 | $176B | $1.4T |
| 1982 | $157B | $1.2T |
| 1981 | $142B | $1.0T |
| 1980 | $113B | $930.2B |
| 1979 | $96B | $845.1B |
| 1978 | $84B | $789.2B |
| 1977 | $69B | $718.9B |
| 1976 | $61B | $653.5B |
| 1975 | $55B | $576.6B |
| 1974 | $50B | $492.7B |
| 1973 | $45B | $469.1B |
| 1972 | $39B | $448.5B |
| 1971 | $36B | $424.1B |
| 1970 | $35B | $389.2B |
| 1969 | $30B | $368.2B |
| 1968 | $25B | $358.0B |
| 1967 | $23B | $344.7B |
| 1966 | $21B | $329.3B |
Interest payments represent seasonally adjusted annual rate at the end of Q4.
At current rates, the U.S. national debt is growing by a remarkable $1 trillion about every 100 days, equal to roughly $3.6 trillion per year.
As the national debt has ballooned, debt payments even exceeded Medicaid outlays in 2023—one of the government’s largest expenditures. On average, the U.S. spent more than $2 billion per day on interest costs last year. Going further, the U.S. government is projected to spend a historic $12.4 trillion on interest payments over the next decade, averaging about $37,100 per American.
Exacerbating matters is that the U.S. is running a steep deficit, which stood at $1.1 trillion for the first six months of fiscal 2024. This has accelerated due to the 43% increase in debt servicing costs along with a $31 billion dollar increase in defense spending from a year earlier. Additionally, a $30 billion increase in funding for the Federal Deposit Insurance Corporation in light of the regional banking crisis last year was a major contributor to the deficit increase.
Overall, the CBO forecasts that roughly 75% of the federal deficit’s increase will be due to interest costs by 2034.

-

 Technology2 weeks ago
Ranked: The Most Popular Smartphone Brands in the U.S.
-

 Misc1 week ago
Almost Every EV Stock is Down After Q1 2024
-

 Money1 week ago
Where Does One U.S. Tax Dollar Go?
-

 Green2 weeks ago
Ranked: Top Countries by Total Forest Loss Since 2001
-

 Markets2 weeks ago
Visualizing America’s Shortage of Affordable Homes
-

 Maps2 weeks ago
Mapped: Average Wages Across Europe
-

 Mining2 weeks ago
Charted: The Value Gap Between the Gold Price and Gold Miners
-

 Demographics2 weeks ago
Visualizing the Size of the Global Senior Population