Debt
Charting America’s Debt: $27 Trillion and Counting
Why America’s Debt Doesn’t Stop Growing
Public sector debt has been a contentious topic for many years. While some believe that excessive government borrowing can be harmful over the long term, others have argued that it acts as a powerful tool for stimulating growth.
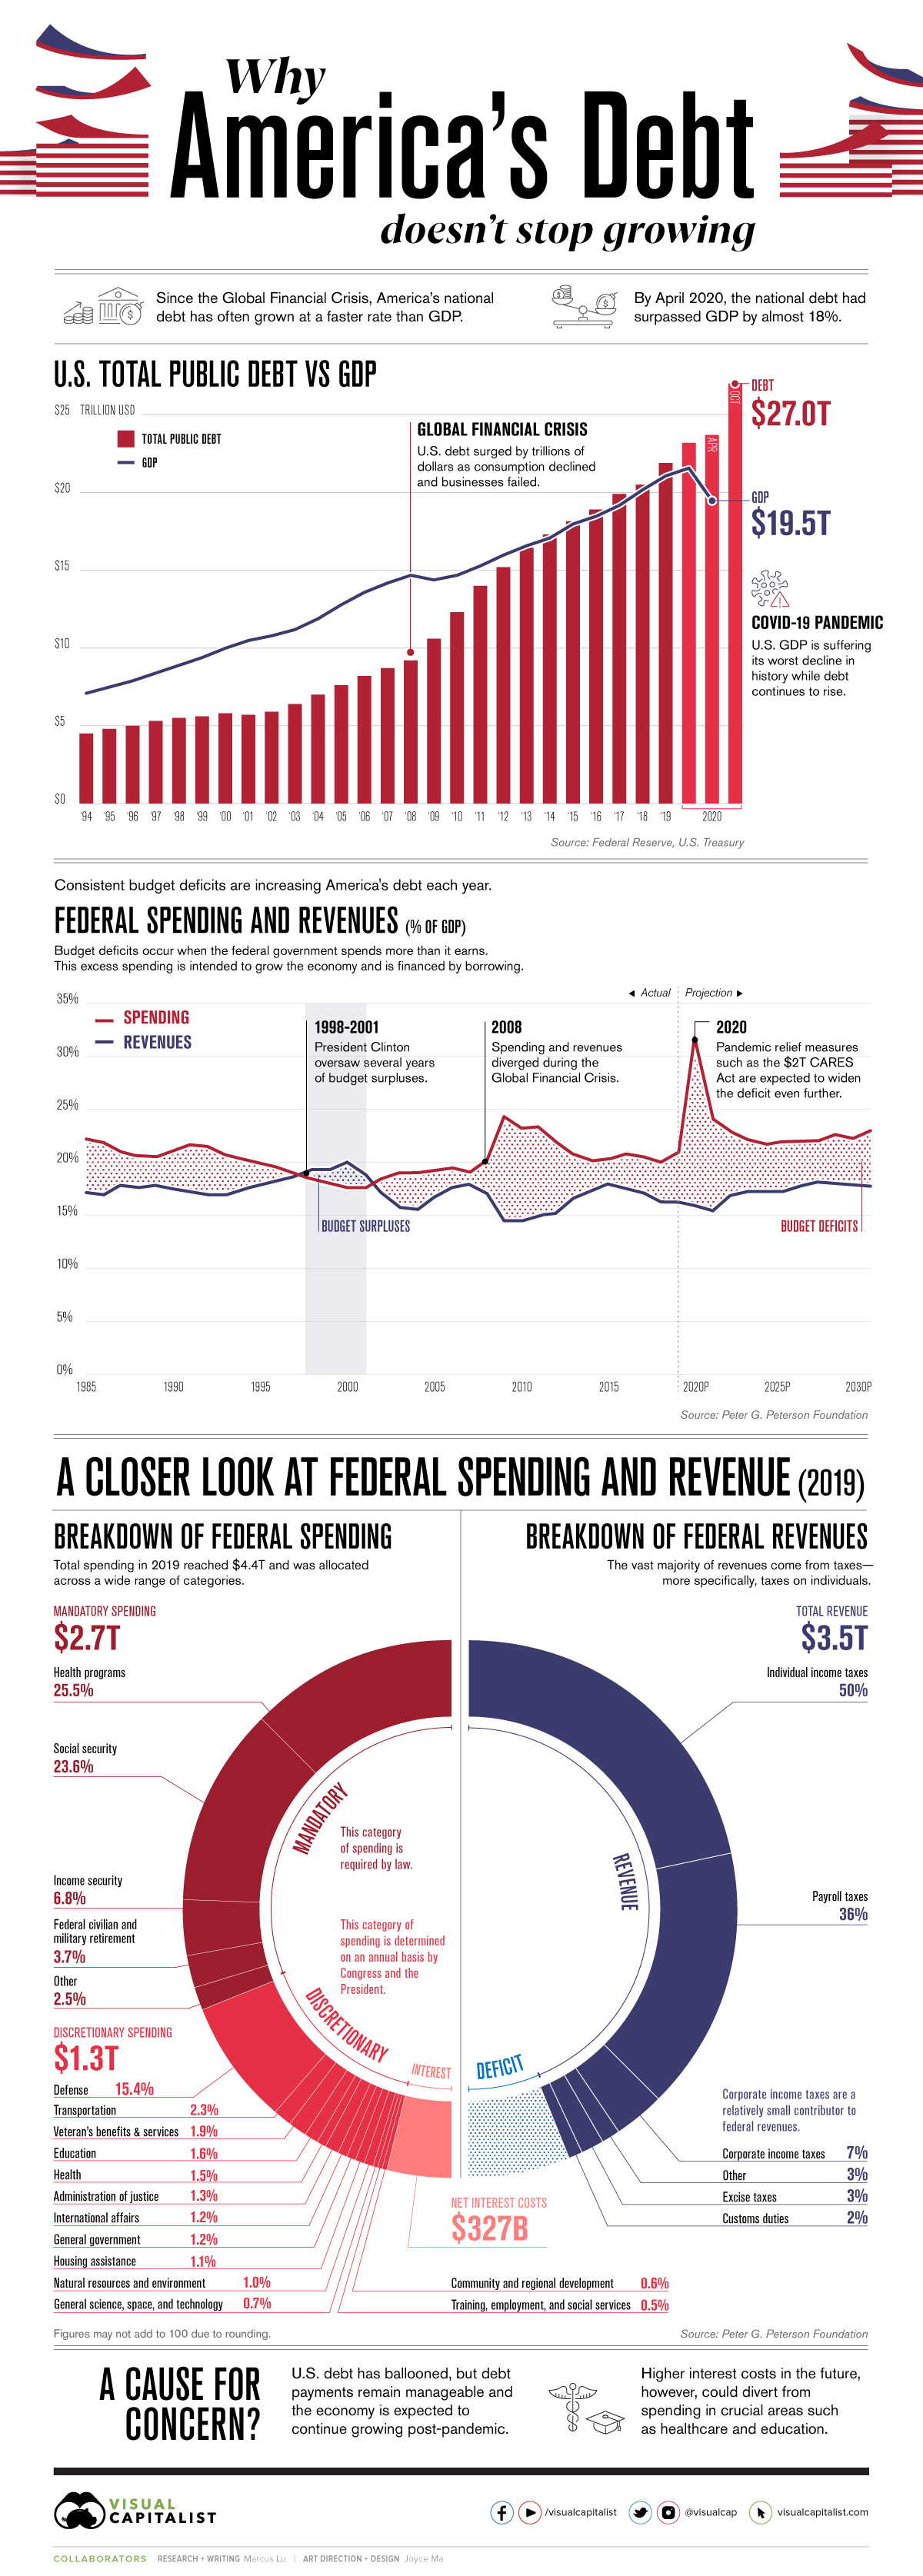
In the U.S., the latter view appears to have taken hold. Since 2008, America’s national debt has surged nearly 200%, reaching $27 trillion as of October 2020. To gain a better understanding of this ever-growing debt, this infographic takes a closer look at various U.S. budgetary datasets including the 2019 fiscal balance.
America’s Debt vs. GDP
Government debts are often represented by incredibly large numbers, making them hard to comprehend. By comparing America’s debt to its annual GDP, we can get a better grasp on the relative size of the country’s financial obligations.
| Year | Total Public Debt (USD) | GDP (USD) | Debt as % of GDP |
|---|---|---|---|
| 1994 | $4.5T | $7.1T | 63% |
| 1995 | $4.8T | $7.5T | 64% |
| 1996 | $5.0T | $7.9T | 63% |
| 1997 | $5.3T | $8.4T | 63% |
| 1998 | $5.5T | $8.9T | 62% |
| 1999 | $5.6T | $9.4T | 60% |
| 2000 | $5.8T | $10.0T | 58% |
| 2001 | $5.7T | $10.5T | 54% |
| 2002 | $5.9T | $10.8T | 55% |
| 2003 | $6.4T | $11.2T | 57% |
| 2004 | $7.0T | $11.9T | 59% |
| 2005 | $7.6T | $12.8T | 59% |
| 2006 | $8.2T | $13.6T | 60% |
| 2007 | $8.7T | $14.2T | 61% |
| 2008 | $9.2T | $14.7T | 63% |
| 2009 | $10.6T | $14.4T | 74% |
| 2010 | $12.3T | $14.7T | 84% |
| 2011 | $14.0T | $15.3T | 92% |
| 2012 | $15.2T | $16.0T | 95% |
| 2013 | $16.4T | $16.6T | 99% |
| 2014 | $17.3T | $17.1T | 101% |
| 2015 | $18.1T | $18.0T | 101% |
| 2016 | $18.9T | $18.5T | 102% |
| 2017 | $19.9T | $19.2T | 104% |
| 2018 | $20.5T | $20.2T | 101% |
| 2019 | $21.9T | $21.1T | 104% |
| 2020 | $23.2T | $21.6T | 107% |
| April 2020 | $23.7T | $19.5T | 122% |
Source: Federal Reserve, U.S. Treasury
In this context, U.S. debt was relatively moderate between 1994 to 2007, averaging 60% of GDP over the timeframe. This took a drastic turn during the Global Financial Crisis, with debt climbing to 95% of GDP by 2012.
Since then, America’s debt has only increased in relative size. In April 2020, with the COVID-19 pandemic in full force, it reached a record 122% of GDP. This may sound troubling at first, but there are a few caveats.
For starters, there are many other advanced economies that have also surpassed the 100% debt-to-GDP milestone. The most noteworthy is Japan, where the debt-to-GDP ratio has climbed beyond 200%. Furthermore, this is not the first time America has found itself in this situation—by the end of World War II, debt-to-GDP peaked at 106% before declining to historic lows in the 1970s.
What’s Preventing the Debt From Shrinking?
Although the U.S. continuously pays off portions of its debt, the total amount it owes has increased each year since 2001. That’s because the federal government runs consistent budget deficits, meaning it spends more than it earns. During economic crises, these deficits can become incredibly large.
| Fiscal Year (Sept 30) | Budget Surplus or Deficit (USD billions) |
|---|---|
| 2000 | +$236B |
| 2001 | +$128B |
| 2002 | -$158B |
| 2003 | -$378B |
| 2004 | -$418B |
| 2005 | -$318B |
| 2006 | -$248B |
| 2007 | -$161B |
| 2008 | -$458B |
| 2009 | -$1,412B |
| 2010 | -$1,294B |
| 2011 | -$1,299B |
| 2012 | -$1,076B |
| 2013 | -$680B |
| 2014 | -$485B |
| 2015 | -$441B |
| 2016 | -$585B |
| 2017 | -$665B |
| 2018 | -$779B |
| 2019 | -$984B |
| 2020 | -$3,131B |
Source: Federal Reserve
In the aftermath of the Global Financial Crisis, the U.S. recorded an annual deficit of $1.4 trillion in FY2009. This was largely due to the $787 billion American Recovery and Reinvestment Act of 2009, which provided tax rebates and other economic relief.
In the economic battle against COVID-19’s impacts, the boundaries have been pushed even further. The annual deficit for FY2020 weighs in at a staggering $3.1 trillion, the largest ever. Contributing to this historic deficit was the $2 trillion CARES Act, which provided wide-ranging support to the entire U.S. economy.
Breaking Down the 2019 Fiscal Balance
Even in the years between these two economic crises, government spending still outpaced revenues. To find out more, we’ve broken down the 2019 fiscal balance into its various components.
Federal Spending
Total spending in FY2019 was roughly $4.4 trillion, and can be broken out into three components.
The first component is Mandatory Spending, which accounted for 62% of the total. Mandatory spending is required by law, and includes funding for important programs such as social security.
| Category | Amount (USD billions) | Percent of Total Federal Spending |
|---|---|---|
| Health programs | $1,121B | 25.5% |
| Social security | $1,039B | 23.6% |
| Income security | $301B | 6.8% |
| Federal civilian and military retirement | $164B | 3.7% |
| Other | $109B | 2.5% |
| Total mandatory spending | $2,735B | 62.2% |
Figures may not add to 100 due to rounding. Source: Peter G. Peterson Foundation
The largest category here was Health, with $1.1 trillion in funding for programs such as Medicare and Medicaid. Social security, which provides payments to retirees, was the second largest at $1.0 trillion.
The second component is Discretionary Spending, which accounted for 30% of the total. Discretionary spending is determined on an annual basis by Congress and the President.
| Discretionary Spending | Amount (USD) | Share of Total Federal Spending |
|---|---|---|
| Defense | $677B | 15.4% |
| Transportation | $100B | 2.3% |
| Veteran's benefits & services | $85B | 1.9% |
| Education | $72B | 1.6% |
| Health | $66B | 1.5% |
| Administration of justice | $59B | 1.3% |
| International affairs | $52B | 1.2% |
| General government | $51B | 1.2% |
| Housing assistance | $49B | 1.1% |
| Natural resources and environment | $44B | 1.0% |
| General science, space, and technology | $32B | 0.7% |
| Community and regional development | $27B | 0.6% |
| Training, employment, and social services | $23B | 0.5% |
Total discretionary spending | $1,338B | 30.4% |
Figures may not add to 100 due to rounding. Source: Peter G. Peterson Foundation
At $677 billion, the Defense category represents over half of total discretionary spending. These funds are spread across the five branches of the U.S. military: the Army, Marine Corps, Navy, Air Force, and Space Force.
The third component of spending is the net interest costs on existing government debt. For FY2019, this was approximately $327 billion.
Federal Revenues
Revenues in FY2019 fell short of total spending, coming in at approximately $3.5 trillion. These inflows can be traced back to six categories.
| Category | Amount (USD billions) | Percent of Total Revenues |
|---|---|---|
| Individual income taxes | $1,732B | 50.0% |
| Payroll taxes | $1,247B | 36.0% |
| Corporate income taxes | $242B | 7.0% |
| Other | $104B | 3.0% |
| Excise taxes | $104B | 3.0% |
| Customs duties | $69B | 2.0% |
| Total revenues | $3,464B | 100.0% |
Figures may not add to 100 due to rounding. Source: Peter G. Peterson Foundation
Revenues overwhelmingly relied on individual income and payroll taxes, which together, accounted for 86% of the total. Corporate income taxes, on the other hand, accounted for just 7%.
Is America’s Debt a Cause for Concern?
The general consensus following the events of 2008 is that large fiscal stimulus (supported by government borrowing) was effective in speeding up the consequent recovery.
Now facing a pandemic, it’s likely that many Americans would support the idea of running large deficits to boost the economy. Surveys released in July 2020, for example, found that 82% of Americans wanted federal relief measures to be extended.
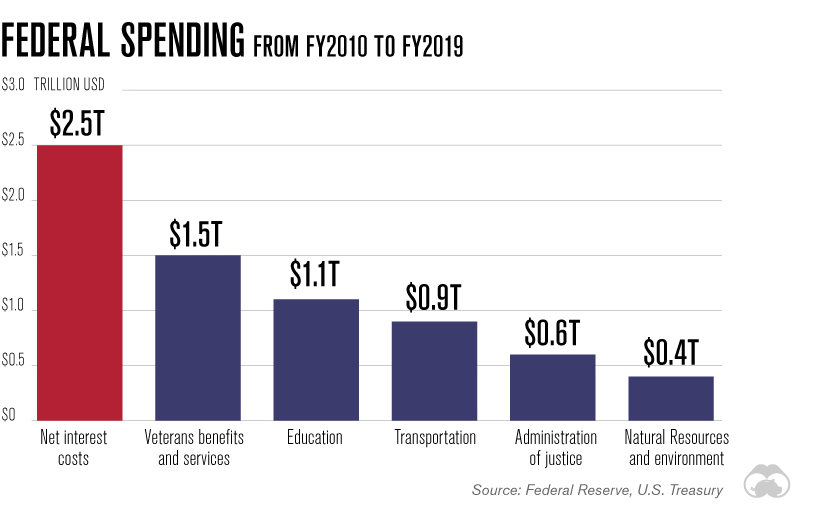
Looking beyond COVID-19, however, does reveal some warning signs. One frequent criticism of the ever-growing national debt is its associated interest costs, which could cannibalize investment in other areas. In fact, the effects of this dilemma are already becoming apparent. Over the past decade, the U.S. has spent more on interest than it has on programs such as veterans benefits and education.
With low interest rates expected for the foreseeable future, the federal government is likely to continue running its large annual deficits—at least until the effects of COVID-19 have fully subsided. Perhaps after this crisis is over, it will be time to assess the long-term sustainability of America’s rising national debt.


Money
How Debt-to-GDP Ratios Have Changed Since 2000
See how much the debt-to-GDP ratios of advanced economies have grown (or shrank) since the year 2000.


How Debt-to-GDP Ratios Have Changed Since 2000
This was originally posted on our Voronoi app. Download the app for free on Apple or Android and discover incredible data-driven charts from a variety of trusted sources.
Government debt levels have grown in most parts of the world since the 2008 financial crisis, and even more so after the COVID-19 pandemic.
To gain perspective on this long-term trend, we’ve visualized the debt-to-GDP ratios of advanced economies, as of 2000 and 2024 (estimated). All figures were sourced from the IMF’s World Economic Outlook.
Data and Highlights
The data we used to create this graphic is listed in the table below. “Government gross debt” consists of all liabilities that require payment(s) of interest and/or principal in the future.
| Country | 2000 (%) | 2024 (%) | Change (pp) |
|---|---|---|---|
| 🇯🇵 Japan | 135.6 | 251.9 | +116.3 |
| 🇸🇬 Singapore | 82.3 | 168.3 | +86.0 |
| 🇺🇸 United States | 55.6 | 126.9 | +71.3 |
| 🇬🇧 United Kingdom | 36.6 | 105.9 | +69.3 |
| 🇬🇷 Greece | 104.9 | 160.2 | +55.3 |
| 🇫🇷 France | 58.9 | 110.5 | +51.6 |
| 🇵🇹 Portugal | 54.2 | 104.0 | +49.8 |
| 🇪🇸 Spain | 57.8 | 104.7 | +46.9 |
| 🇸🇮 Slovenia | 25.9 | 66.5 | +40.6 |
| 🇫🇮 Finland | 42.4 | 76.5 | +34.1 |
| 🇭🇷 Croatia | 35.4 | 61.8 | +26.4 |
| 🇨🇦 Canada | 80.4 | 103.3 | +22.9 |
| 🇨🇾 Cyprus | 56.0 | 70.9 | +14.9 |
| 🇦🇹 Austria | 65.7 | 74.0 | +8.3 |
| 🇸🇰 Slovak Republic | 50.5 | 56.5 | +6.0 |
| 🇩🇪 Germany | 59.3 | 64.0 | +4.7 |
| 🇧🇪 Belgium | 109.6 | 106.8 | -2.8 |
| 🇮🇱 Israel | 77.4 | 56.8 | -20.6 |
| 🇮🇸 Iceland | 75.8 | 54.6 | -21.2 |
The debt-to-GDP ratio indicates how much a country owes compared to the size of its economy, reflecting its ability to manage and repay debts. Percentage point (pp) changes shown above indicate the increase or decrease of these ratios.
Countries with the Biggest Increases
Japan (+116 pp), Singapore (+86 pp), and the U.S. (+71 pp) have grown their debt as a percentage of GDP the most since the year 2000.
All three of these countries have stable, well-developed economies, so it’s unlikely that any of them will default on their growing debts. With that said, higher government debt leads to increased interest payments, which in turn can diminish available funds for future government budgets.
This is a rising issue in the U.S., where annual interest payments on the national debt have surpassed $1 trillion for the first time ever.
Only 3 Countries Saw Declines
Among this list of advanced economies, Belgium (-2.8 pp), Iceland (-21.2 pp), and Israel (-20.6 pp) were the only countries that decreased their debt-to-GDP ratio since the year 2000.
According to Fitch Ratings, Iceland’s debt ratio has decreased due to strong GDP growth and the use of its cash deposits to pay down upcoming maturities.
See More Debt Graphics from Visual Capitalist
Curious to see which countries have the most government debt in dollars? Check out this graphic that breaks down $97 trillion in debt as of 2023.

-

 Travel1 week ago
Airline Incidents: How Do Boeing and Airbus Compare?
-

 Markets3 weeks ago
Visualizing America’s Shortage of Affordable Homes
-

 Green2 weeks ago
Ranked: Top Countries by Total Forest Loss Since 2001
-

 Money2 weeks ago
Where Does One U.S. Tax Dollar Go?
-

 Misc2 weeks ago
Almost Every EV Stock is Down After Q1 2024
-

 AI2 weeks ago
The Stock Performance of U.S. Chipmakers So Far in 2024
-

 Markets2 weeks ago
Charted: Big Four Market Share by S&P 500 Audits
-

 Real Estate2 weeks ago
Ranked: The Most Valuable Housing Markets in America