Markets
Ranked: America’s Best Places to Work in 2023
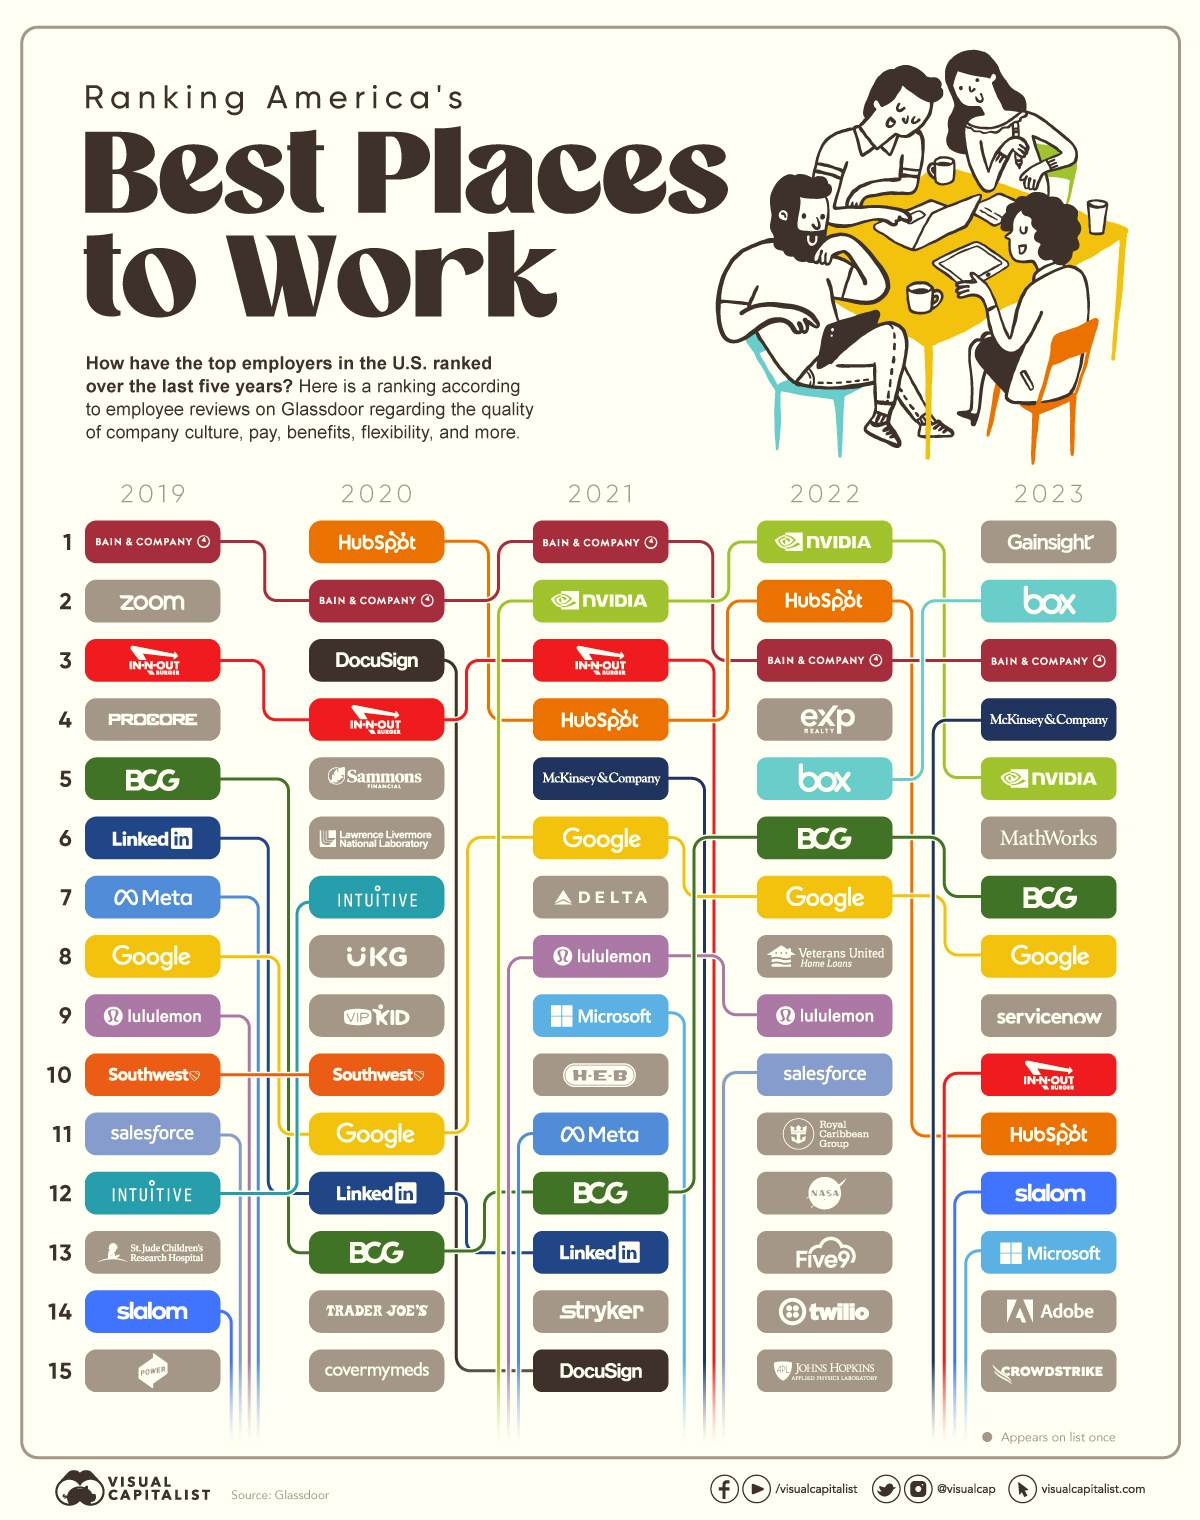


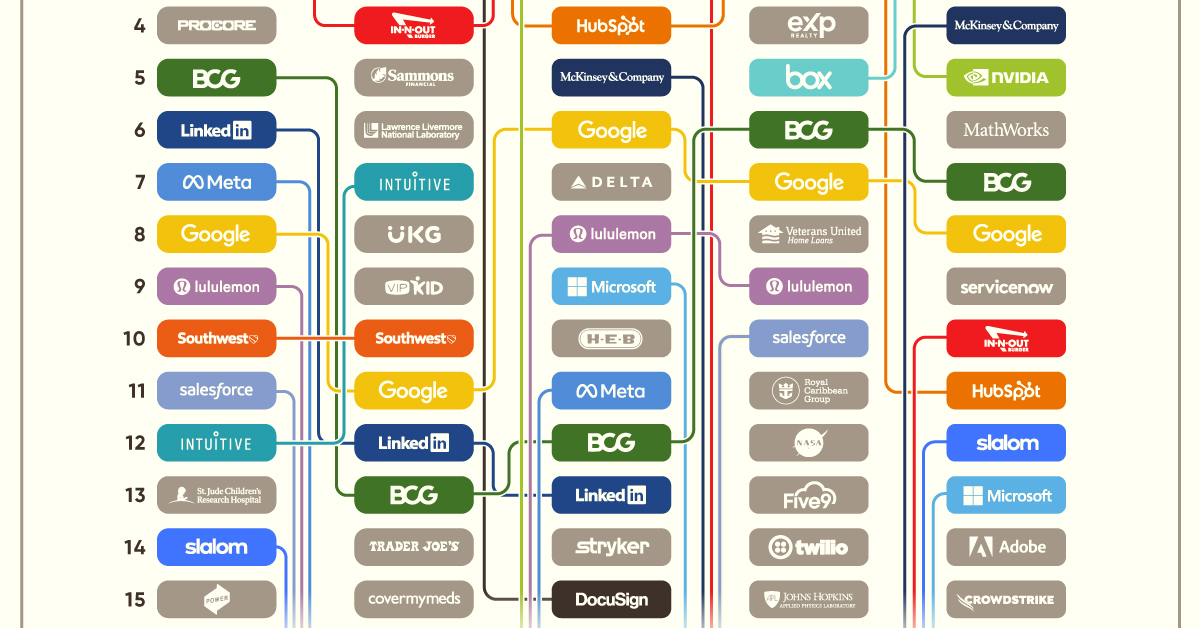
Ranking America’s Best Places to Work
What better way to know more about a company’s work culture than to hear from those who’ve already been on the inside?
In the above graphic, we dissect how America’s top employers have changed over the last five years based on employee reviews on Glassdoor, a website that allows current and former employees to anonymously review their employers on things like company culture, pay, benefits, diversity, and more.
Tech Fares Best
Despite widescale layoffs in 2022, technology companies made up more than 40% of Glassdoor’s Best Places to Work list in 2023. Gainsight, a customer success software company founded in 2009, entered the top 15 ranking for the first time in five years and took the number one spot as the year’s best employer.
The dominance of technology companies in Glassdoor’s Best Places to Work list is nothing new, though. Companies like HubSpot and NVIDIA are staples on the list, with consistent praise from their employees when it comes to pay, benefits, leadership, and career growth.
| Rank | 2019 | 2020 | 2021 | 2022 | 2023 |
|---|---|---|---|---|---|
| #1 | Bain & Company | HubSpot | Bain & Company | NVIDIA | Gainsight |
| #2 | Zoom Video Communications | Bain & Company | NVIDIA | HubSpot | Box |
| #3 | In-N-Out Burger | DocuSign | In-N-Out Burger | Bain & Company | Bain & Company |
| #4 | Procore Technologies | In-N-Out Burger | HubSpot | eXp Realty | McKinsey & Company |
| #5 | Boston Consulting Group | Sammons Financial Group Companies | McKinsey & Company | Box | NVIDIA |
While tech tends to be popular among employees, the industry isn’t the end-all-be-all when it comes to good employee reviews.
Take Bain & Company, a management consulting firm with over 10,000 employees, that’s been consistently ranking in the top three over the last five years. Or look at fast-food chain In-N-Out Burger, whose employees consistently rave about good pay and schedule flexibility in anonymous Glassdoor reviews, making the company one of America’s top 20 employers since 2015.
Analyzing Ranking by Company
Diving into the ranking by company can also give us a good understanding of how some of the giants compare to others in the field.
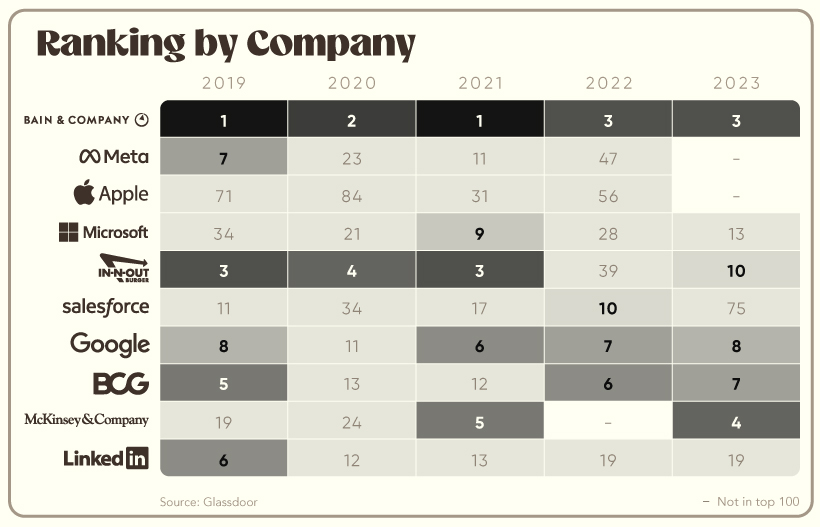
Looking at the above visual, you might notice that two regular winners, Apple and Meta, did not make the top 100 this year. Salesforce’s ranking also fell below the top 50 for the first time since 2015, coming in at #75. While tech fared relatively well in 2023, these companies tumbled down and off the list, making way for smaller tech companies like Gainsight, Box, and MathWorks.
As the global economy faces uncertainty in 2023, it’ll be interesting to observe how these companies fare in terms of employee satisfaction. Against the backdrop of layoffs and slower economic growth, how leadership navigates hard conversations and steps up for their employees may be very telling, potentially resulting in a completely different makeup of the list in 2024.


Markets
U.S. Debt Interest Payments Reach $1 Trillion
U.S. debt interest payments have surged past the $1 trillion dollar mark, amid high interest rates and an ever-expanding debt burden.


U.S. Debt Interest Payments Reach $1 Trillion
This was originally posted on our Voronoi app. Download the app for free on iOS or Android and discover incredible data-driven charts from a variety of trusted sources.
The cost of paying for America’s national debt crossed the $1 trillion dollar mark in 2023, driven by high interest rates and a record $34 trillion mountain of debt.
Over the last decade, U.S. debt interest payments have more than doubled amid vast government spending during the pandemic crisis. As debt payments continue to soar, the Congressional Budget Office (CBO) reported that debt servicing costs surpassed defense spending for the first time ever this year.
This graphic shows the sharp rise in U.S. debt payments, based on data from the Federal Reserve.
A $1 Trillion Interest Bill, and Growing
Below, we show how U.S. debt interest payments have risen at a faster pace than at another time in modern history:
| Date | Interest Payments | U.S. National Debt |
|---|---|---|
| 2023 | $1.0T | $34.0T |
| 2022 | $830B | $31.4T |
| 2021 | $612B | $29.6T |
| 2020 | $518B | $27.7T |
| 2019 | $564B | $23.2T |
| 2018 | $571B | $22.0T |
| 2017 | $493B | $20.5T |
| 2016 | $460B | $20.0T |
| 2015 | $435B | $18.9T |
| 2014 | $442B | $18.1T |
| 2013 | $425B | $17.2T |
| 2012 | $417B | $16.4T |
| 2011 | $433B | $15.2T |
| 2010 | $400B | $14.0T |
| 2009 | $354B | $12.3T |
| 2008 | $380B | $10.7T |
| 2007 | $414B | $9.2T |
| 2006 | $387B | $8.7T |
| 2005 | $355B | $8.2T |
| 2004 | $318B | $7.6T |
| 2003 | $294B | $7.0T |
| 2002 | $298B | $6.4T |
| 2001 | $318B | $5.9T |
| 2000 | $353B | $5.7T |
| 1999 | $353B | $5.8T |
| 1998 | $360B | $5.6T |
| 1997 | $368B | $5.5T |
| 1996 | $362B | $5.3T |
| 1995 | $357B | $5.0T |
| 1994 | $334B | $4.8T |
| 1993 | $311B | $4.5T |
| 1992 | $306B | $4.2T |
| 1991 | $308B | $3.8T |
| 1990 | $298B | $3.4T |
| 1989 | $275B | $3.0T |
| 1988 | $254B | $2.7T |
| 1987 | $240B | $2.4T |
| 1986 | $225B | $2.2T |
| 1985 | $219B | $1.9T |
| 1984 | $205B | $1.7T |
| 1983 | $176B | $1.4T |
| 1982 | $157B | $1.2T |
| 1981 | $142B | $1.0T |
| 1980 | $113B | $930.2B |
| 1979 | $96B | $845.1B |
| 1978 | $84B | $789.2B |
| 1977 | $69B | $718.9B |
| 1976 | $61B | $653.5B |
| 1975 | $55B | $576.6B |
| 1974 | $50B | $492.7B |
| 1973 | $45B | $469.1B |
| 1972 | $39B | $448.5B |
| 1971 | $36B | $424.1B |
| 1970 | $35B | $389.2B |
| 1969 | $30B | $368.2B |
| 1968 | $25B | $358.0B |
| 1967 | $23B | $344.7B |
| 1966 | $21B | $329.3B |
Interest payments represent seasonally adjusted annual rate at the end of Q4.
At current rates, the U.S. national debt is growing by a remarkable $1 trillion about every 100 days, equal to roughly $3.6 trillion per year.
As the national debt has ballooned, debt payments even exceeded Medicaid outlays in 2023—one of the government’s largest expenditures. On average, the U.S. spent more than $2 billion per day on interest costs last year. Going further, the U.S. government is projected to spend a historic $12.4 trillion on interest payments over the next decade, averaging about $37,100 per American.
Exacerbating matters is that the U.S. is running a steep deficit, which stood at $1.1 trillion for the first six months of fiscal 2024. This has accelerated due to the 43% increase in debt servicing costs along with a $31 billion dollar increase in defense spending from a year earlier. Additionally, a $30 billion increase in funding for the Federal Deposit Insurance Corporation in light of the regional banking crisis last year was a major contributor to the deficit increase.
Overall, the CBO forecasts that roughly 75% of the federal deficit’s increase will be due to interest costs by 2034.

-

 Real Estate2 weeks ago
Visualizing America’s Shortage of Affordable Homes
-

 Technology1 week ago
Ranked: Semiconductor Companies by Industry Revenue Share
-

 Money1 week ago
Which States Have the Highest Minimum Wage in America?
-

 Real Estate1 week ago
Ranked: The Most Valuable Housing Markets in America
-

 Business2 weeks ago
Charted: Big Four Market Share by S&P 500 Audits
-

 AI2 weeks ago
The Stock Performance of U.S. Chipmakers So Far in 2024
-

 Misc2 weeks ago
Almost Every EV Stock is Down After Q1 2024
-

 Money2 weeks ago
Where Does One U.S. Tax Dollar Go?