Energy
What Americans Actually Think About Energy and the Climate
What Americans Actually Think About Energy and the Climate
There is a wealth of information to be explored in the modern era, and there’s no shortage of new ideas or contrary viewpoints to be discovered. With all of this information right at our fingertips, it is assumed that many people are becoming more open-minded to new perspectives.
However, in actuality, the converse is true: modern media creates an echo chamber.
Facebook and Google both create information vaccuums: by taking your past activities in account, they will display “news” that is geared to provide confirmation bias. In other words, you will see posts in your newsfeed and search results that tend to confirm your pre-existing beliefs, rather than challenge them.
One way to challenge this?
Instead of just assuming what other people believe, it’s worth it to actively search for data that provides a broad and unbiased perspective. Then, interpret and internalize the data, and you’ll have a much more representative idea of what people think.
What Americans Actually Think About Energy
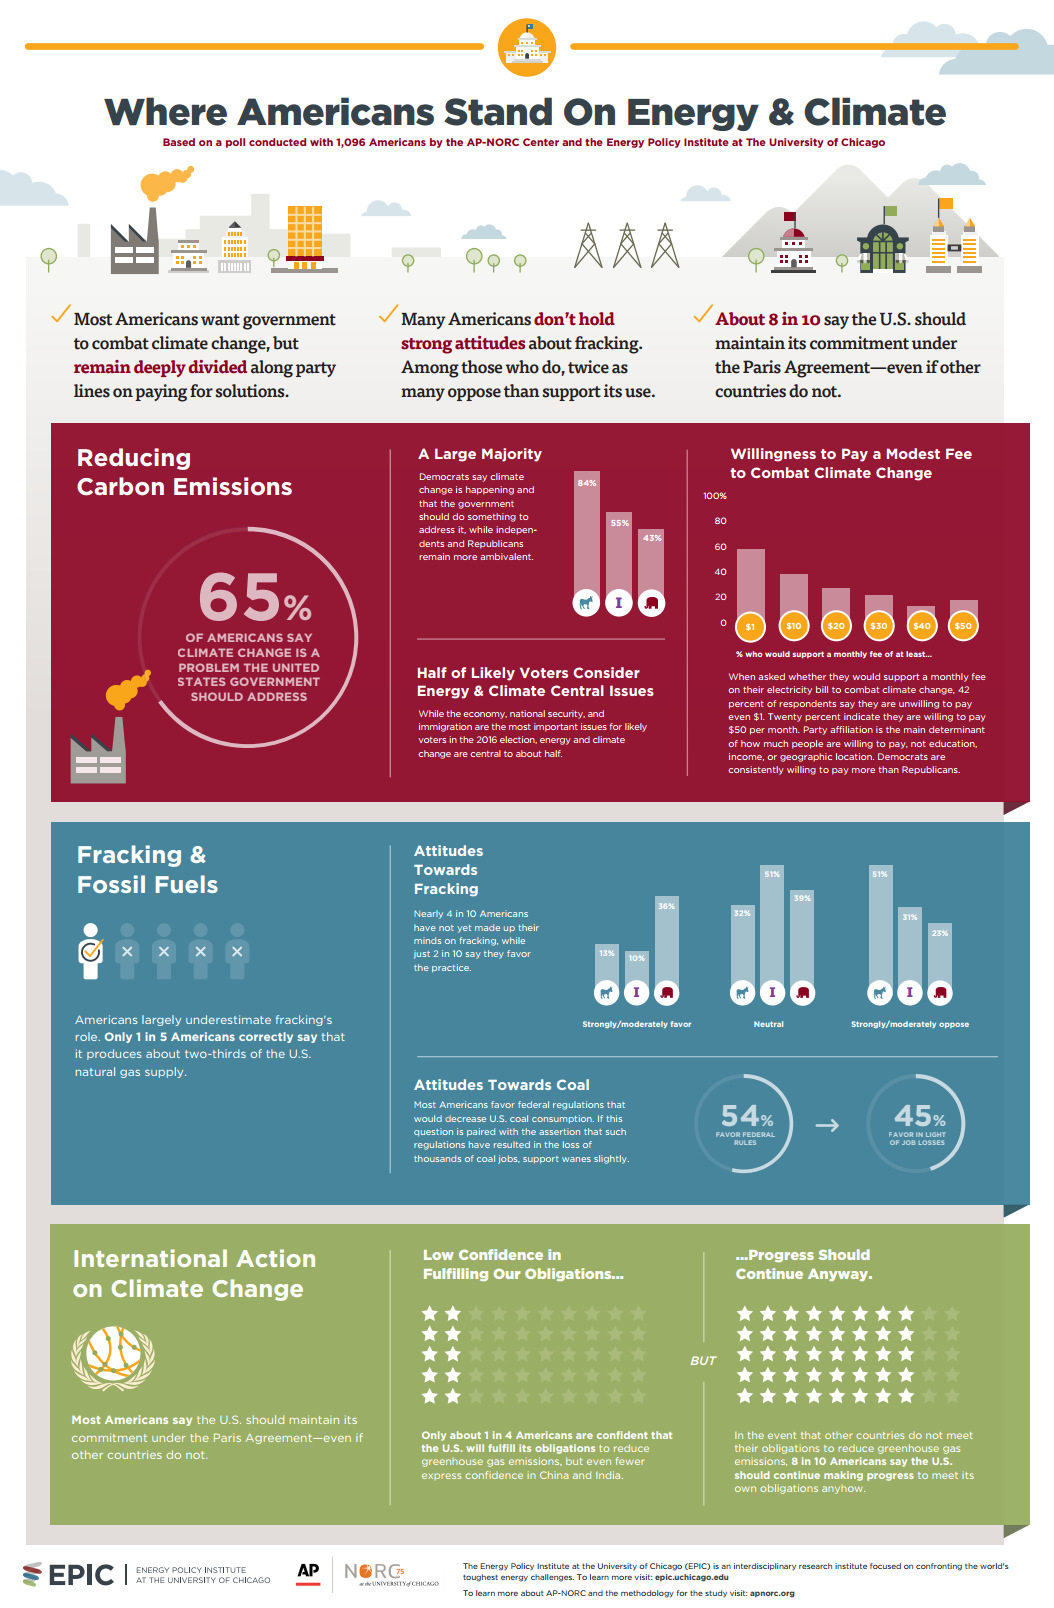
In today’s infographic, which uses data from a survey by the AP-NORC and the Energy Policy Institute, we get a summary of opinions on energy and climate change from a nationally representative sample of 1,096 Americans.
An analysis of the survey data helps us understand what Americans actually think, rather than what we assume they may think.
Here are some of the most interesting tidbits:
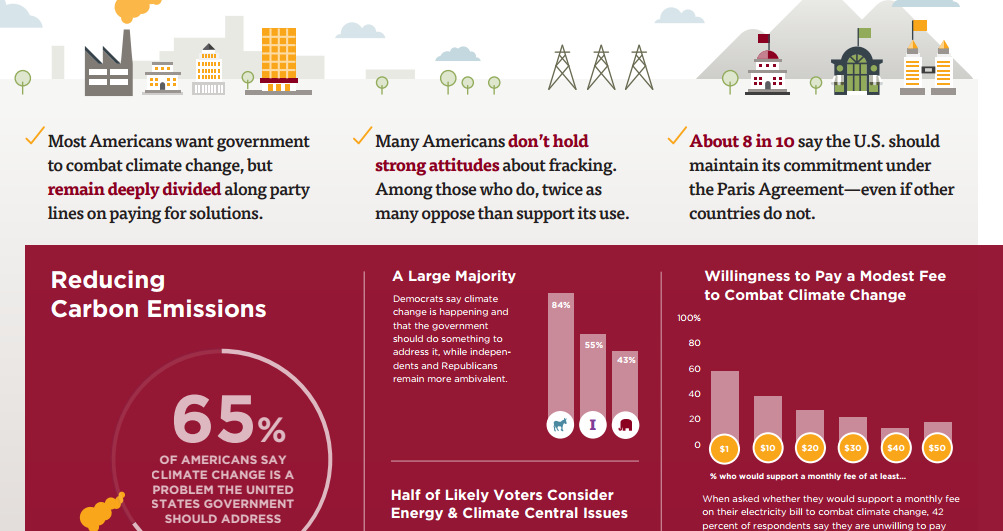
- 65% of Americans think that climate change is a problem that the U.S. government should address, and 10% of Americans believe climate change is not happening.
- 42% of Americans aren’t willing to pay even just $1 per month to combat climate change.
- Americans largely underestimate fracking’s role in providing for the energy mix. Only 1 in 5 Americans correctly say that it produces two-thirds of U.S. natural gas.
- Most Americans don’t hold strong opinions on fracking – but for those that do, people that oppose fracking outnumber those in favor of fracking by a 2:1 ratio.
- Only a quarter of Americans think the U.S. government will fulfill its obligations to reduce greenhouse gas emissions.
- 54% of Americans favor federal regulation to decrease coal consumption, but that number drops to 45% if jobs will be lost.
It’s always interesting to get an in-depth and representative perspective of what people believe, rather than making false assumptions based on what can be seen on social feeds, news sites, or search results.
Did any of the numbers from the survey surprise you?


Energy
The World’s Biggest Nuclear Energy Producers
China has grown its nuclear capacity over the last decade, now ranking second on the list of top nuclear energy producers.


The World’s Biggest Nuclear Energy Producers
This was originally posted on our Voronoi app. Download the app for free on Apple or Android and discover incredible data-driven charts from a variety of trusted sources.
Scientists in South Korea recently broke a record in a nuclear fusion experiment. For 48 seconds, they sustained a temperature seven times that of the sun’s core.
But generating commercially viable energy from nuclear fusion still remains more science fiction than reality. Meanwhile, its more reliable sibling, nuclear fission, has been powering our world for many decades.
In this graphic, we visualized the top producers of nuclear energy by their share of the global total, measured in terawatt hours (TWh). Data for this was sourced from the Nuclear Energy Institute, last updated in August 2022.
Which Country Generates the Most Nuclear Energy?
Nuclear energy production in the U.S. is more than twice the amount produced by China (ranked second) and France (ranked third) put together. In total, the U.S. accounts for nearly 30% of global nuclear energy output.
However, nuclear power only accounts for one-fifth of America’s electricity supply. This is in contrast to France, which generates 60% of its electricity from nuclear plants.
| Rank | Country | Nuclear Energy Produced (TWh) | % of Total |
|---|---|---|---|
| 1 | 🇺🇸 U.S. | 772 | 29% |
| 2 | 🇨🇳 China | 383 | 14% |
| 3 | 🇫🇷 France | 363 | 14% |
| 4 | 🇷🇺 Russia | 208 | 8% |
| 5 | 🇰🇷 South Korea | 150 | 6% |
| 6 | 🇨🇦 Canada | 87 | 3% |
| 7 | 🇺🇦 Ukraine | 81 | 3% |
| 8 | 🇩🇪 Germany | 65 | 2% |
| 9 | 🇯🇵 Japan | 61 | 2% |
| 10 | 🇪🇸 Spain | 54 | 2% |
| 11 | 🇸🇪 Sweden | 51 | 2% |
| 12 | 🇧🇪 Belgium | 48 | 2% |
| 13 | 🇬🇧 UK | 42 | 2% |
| 14 | 🇮🇳 India | 40 | 2% |
| 15 | 🇨🇿 Czech Republic | 29 | 1% |
| N/A | 🌐 Other | 219 | 8% |
| N/A | 🌍 Total | 2,653 | 100% |
Another highlight is how China has rapidly grown its nuclear energy capabilities in the last decade. Between 2016 and 2021, for example, it increased its share of global nuclear energy output from less than 10% to more than 14%, overtaking France for second place.
On the opposite end, the UK’s share has slipped to 2% over the same time period.
Meanwhile, Ukraine has heavily relied on nuclear energy to power its grid. In March 2022, it lost access to its key Zaporizhzhia Nuclear Power Station after Russian forces wrested control of the facility. With six 1,000 MW reactors, the plant is one of the largest in Europe. It is currently not producing any power, and has been the site of recent drone attacks.

-

 Maps2 weeks ago
Mapped: Average Wages Across Europe
-

 Money1 week ago
Which States Have the Highest Minimum Wage in America?
-

 Real Estate1 week ago
Ranked: The Most Valuable Housing Markets in America
-

 Markets1 week ago
Charted: Big Four Market Share by S&P 500 Audits
-

 AI1 week ago
The Stock Performance of U.S. Chipmakers So Far in 2024
-

 Automotive1 week ago
Almost Every EV Stock is Down After Q1 2024
-

 Money2 weeks ago
Where Does One U.S. Tax Dollar Go?
-

 Green2 weeks ago
Ranked: Top Countries by Total Forest Loss Since 2001