Technology
Visualized: A Breakdown of Amazon’s Revenue Model
Visualized: A Breakdown of Amazon’s Revenue Model
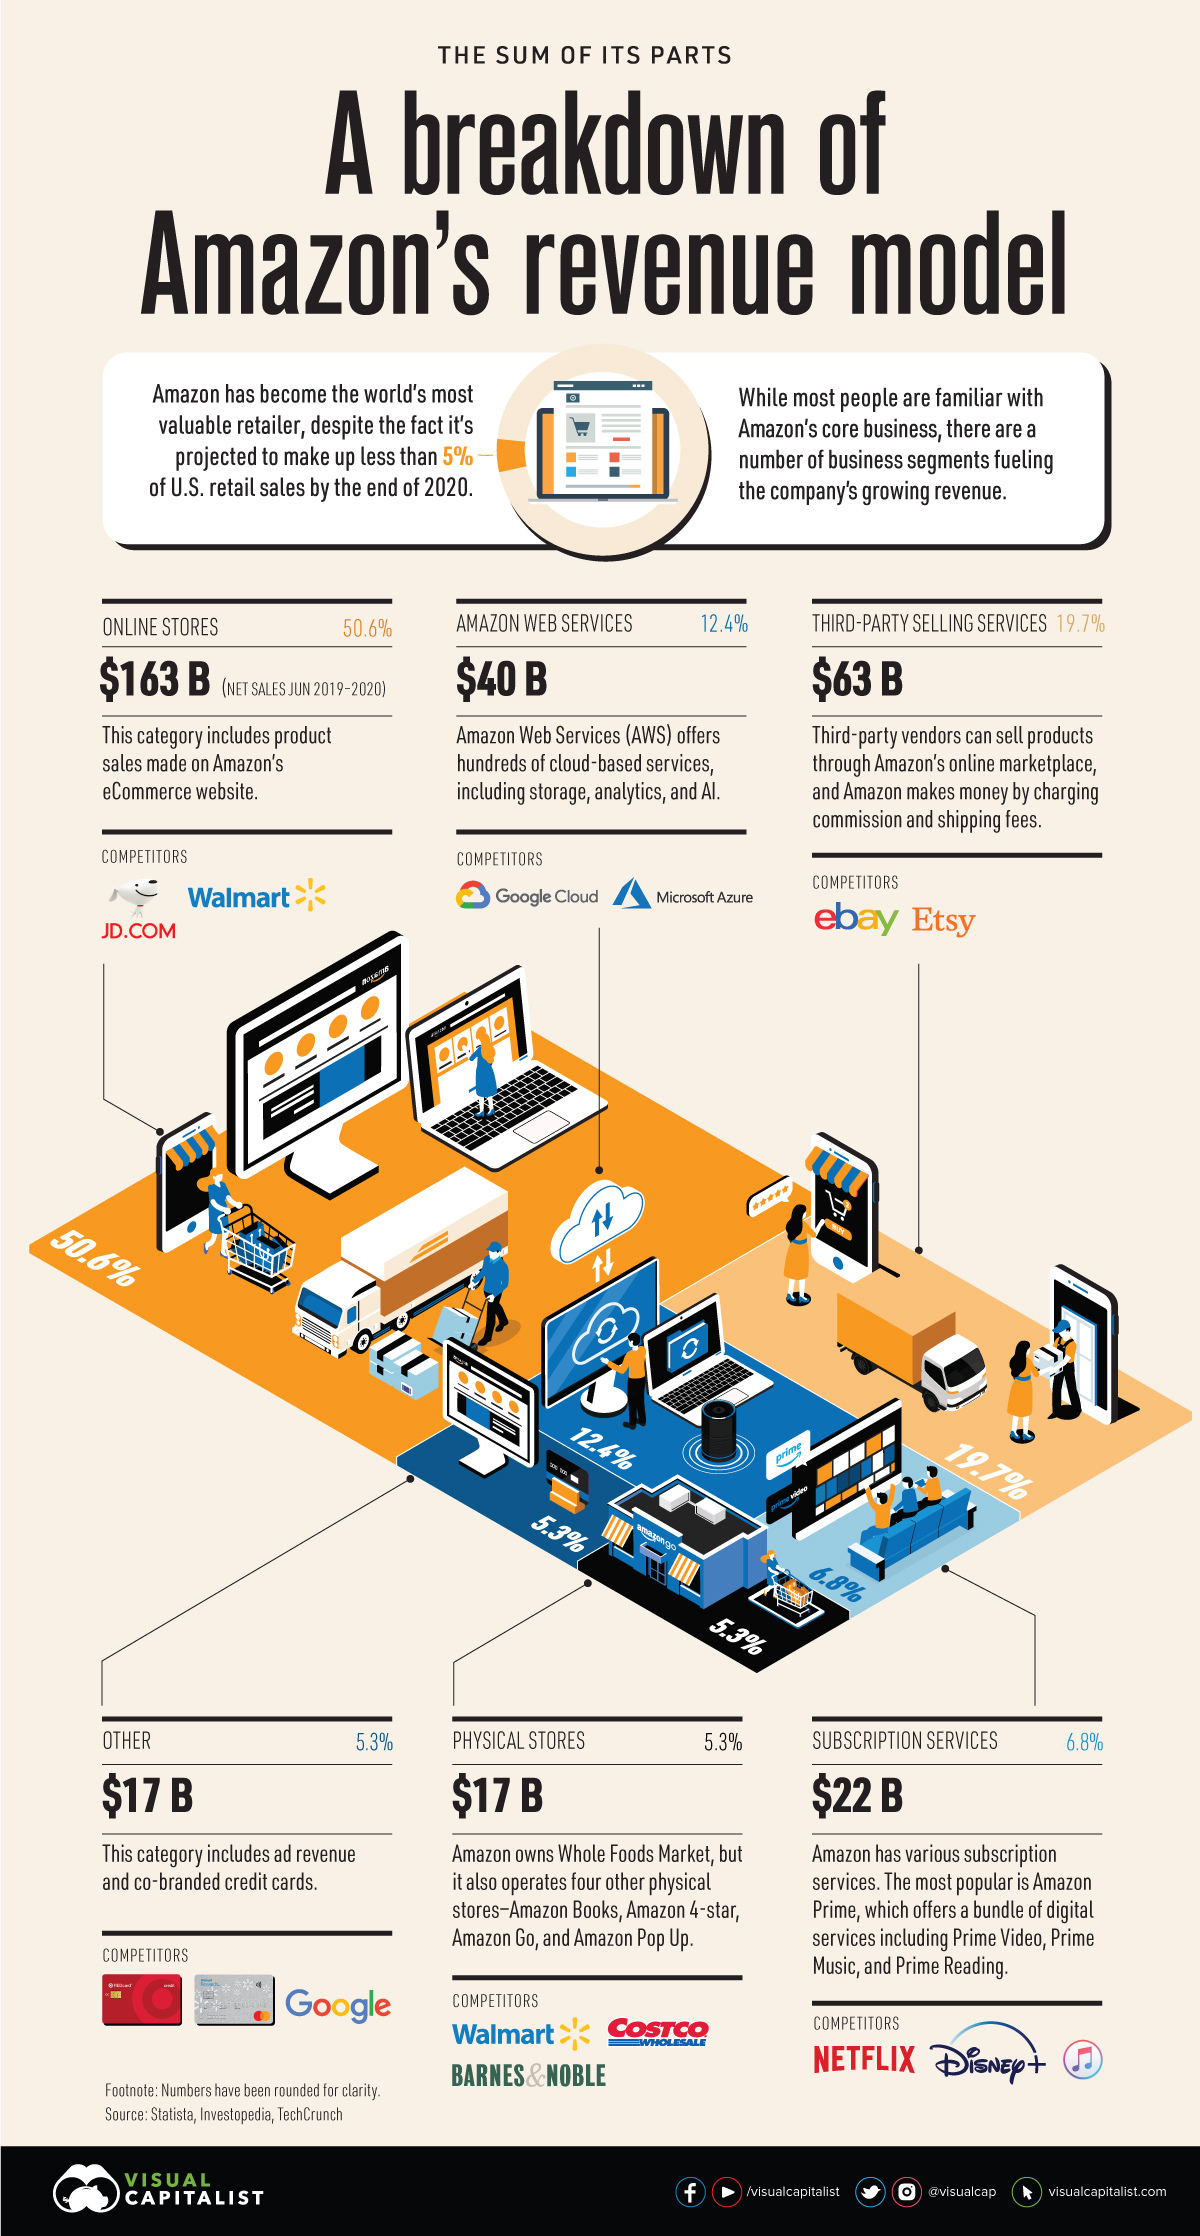
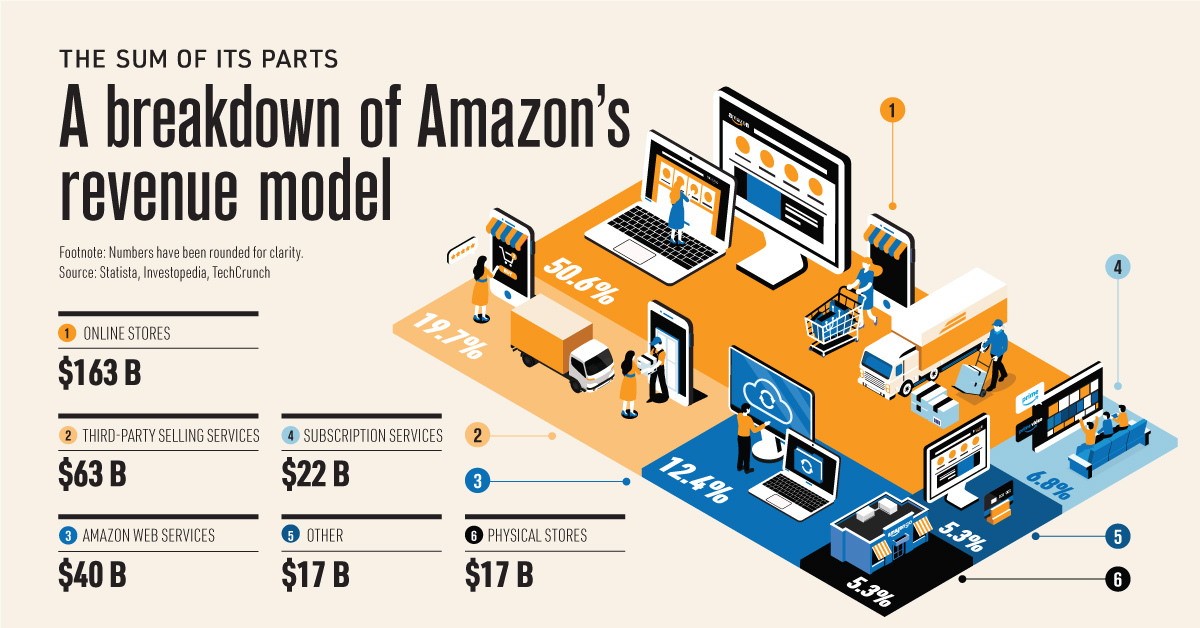
Amazon has evolved into more than just an online store. While ecommerce makes up a significant portion of the company’s overall sales, its diverse revenue model generates billions through various business segments.
This visualization provides an overview of the different parts that make up Amazon, showing each business unit’s net sales from June 2019 to 2020.
A Diverse Revenue Model
With a market cap of $1.7 trillion, Amazon is currently the most valuable retailer in the world. The company is expected to account for 4.6% of total U.S. retail sales by the end of 2020—but the tech giant is more than just a one-trick pony.
A key factor in the company’s success is its diversification into other areas. Here’s a breakdown of Amazon’s revenue mix:
| Business Segment | Net Sales (June 2019 - 2020) |
|---|---|
| Online stores | $163 B |
| Third-party selling services | $63 B |
| Amazon Web Services | $40 B |
| Subscription services | $22 B |
| Physical stores | $17 B |
| Other | $17 B |
| Total Revenue | $322 billion |
While Amazon is truly more than an online store, it’s worth noting that online sales account for a significant amount of the company’s overall revenue mix. Over the period of June 2019 to 2020, product sales from Amazon’s website generated $163 billion, which is more than the company’s other business units combined.
A significant day for online sales is Prime Day, which has grown into a major shopping event comparable to Black Friday and Cyber Monday. In 2020, Prime Day is projected to generate almost $10 billion in global revenue.
While ecommerce makes up a large portion of Amazon’s overall sales, there are many other segments that each generate billions in revenue to create immense value for the tech giant. For instance, enabling third-party sellers on the platform is the company’s second-largest unit in terms of net sales, racking up $63 billion over the course of a year.
This segment has shown tremendous growth over the last two decades. In 2018, it accounted for 58% of gross merchandise sales on Amazon, compared to just 3% in 2000. While third-party sellers technically outsold Amazon itself, the company still makes money through commission and shipping fees.
Amazon is Not Alone: Diversification is Common
Amazon isn’t the only major tech company to benefit from diverse revenue streams.
Other tech giants generate revenue through a range of products, services, and applications—for instance, while a healthy portion of Apple’s revenue comes from iPhone sales, the company captures 17% of revenue from a mix of services, ranging from Apple Pay to Apple Music. Microsoft is another example of this, considering it owns a wide range of hardware, cloud services, and platforms.
While there are several reasons to build a diverse business portfolio, a key benefit that comes from diversification is having a buffer against market crashes. This has proven to be particularly important in 2020, given the economic devastation caused by the global pandemic.
The Sum of its Parts
Despite varying levels of sales, each business unit brings unique value to Amazon.
For instance, while Amazon Web Services (AWS) falls behind online sales and third-party sellers in net sales, it’s one of the most profitable segments of the company. In the fourth quarter of 2019, more than half of Amazon’s operating income came from AWS.
In short, when looking at the many segments of Amazon, one thing is clear—the company is truly the sum of its parts.


Brands
How Tech Logos Have Evolved Over Time
From complete overhauls to more subtle tweaks, these tech logos have had quite a journey. Featuring: Google, Apple, and more.


How Tech Logos Have Evolved Over Time
This was originally posted on our Voronoi app. Download the app for free on iOS or Android and discover incredible data-driven charts from a variety of trusted sources.
One would be hard-pressed to find a company that has never changed its logo. Granted, some brands—like Rolex, IBM, and Coca-Cola—tend to just have more minimalistic updates. But other companies undergo an entire identity change, thus necessitating a full overhaul.
In this graphic, we visualized the evolution of prominent tech companies’ logos over time. All of these brands ranked highly in a Q1 2024 YouGov study of America’s most famous tech brands. The logo changes are sourced from 1000logos.net.
How Many Times Has Google Changed Its Logo?
Google and Facebook share a 98% fame rating according to YouGov. But while Facebook’s rise was captured in The Social Network (2010), Google’s history tends to be a little less lionized in popular culture.
For example, Google was initially called “Backrub” because it analyzed “back links” to understand how important a website was. Since its founding, Google has undergone eight logo changes, finally settling on its current one in 2015.
| Company | Number of Logo Changes |
|---|---|
| 8 | |
| HP | 8 |
| Amazon | 6 |
| Microsoft | 6 |
| Samsung | 6 |
| Apple | 5* |
Note: *Includes color changes. Source: 1000Logos.net
Another fun origin story is Microsoft, which started off as Traf-O-Data, a traffic counter reading company that generated reports for traffic engineers. By 1975, the company was renamed. But it wasn’t until 2012 that Microsoft put the iconic Windows logo—still the most popular desktop operating system—alongside its name.
And then there’s Samsung, which started as a grocery trading store in 1938. Its pivot to electronics started in the 1970s with black and white television sets. For 55 years, the company kept some form of stars from its first logo, until 1993, when the iconic encircled blue Samsung logo debuted.
Finally, Apple’s first logo in 1976 featured Isaac Newton reading under a tree—moments before an apple fell on his head. Two years later, the iconic bitten apple logo would be designed at Steve Jobs’ behest, and it would take another two decades for it to go monochrome.

-

 Travel1 week ago
Airline Incidents: How Do Boeing and Airbus Compare?
-

 Markets3 weeks ago
Visualizing America’s Shortage of Affordable Homes
-

 Green3 weeks ago
Ranked: Top Countries by Total Forest Loss Since 2001
-

 Money2 weeks ago
Where Does One U.S. Tax Dollar Go?
-

 Misc2 weeks ago
Almost Every EV Stock is Down After Q1 2024
-

 AI2 weeks ago
The Stock Performance of U.S. Chipmakers So Far in 2024
-

 Markets2 weeks ago
Charted: Big Four Market Share by S&P 500 Audits
-

 Real Estate2 weeks ago
Ranked: The Most Valuable Housing Markets in America