Technology
Visualized: A Breakdown of Amazon’s Revenue Model
Visualized: A Breakdown of Amazon’s Revenue Model
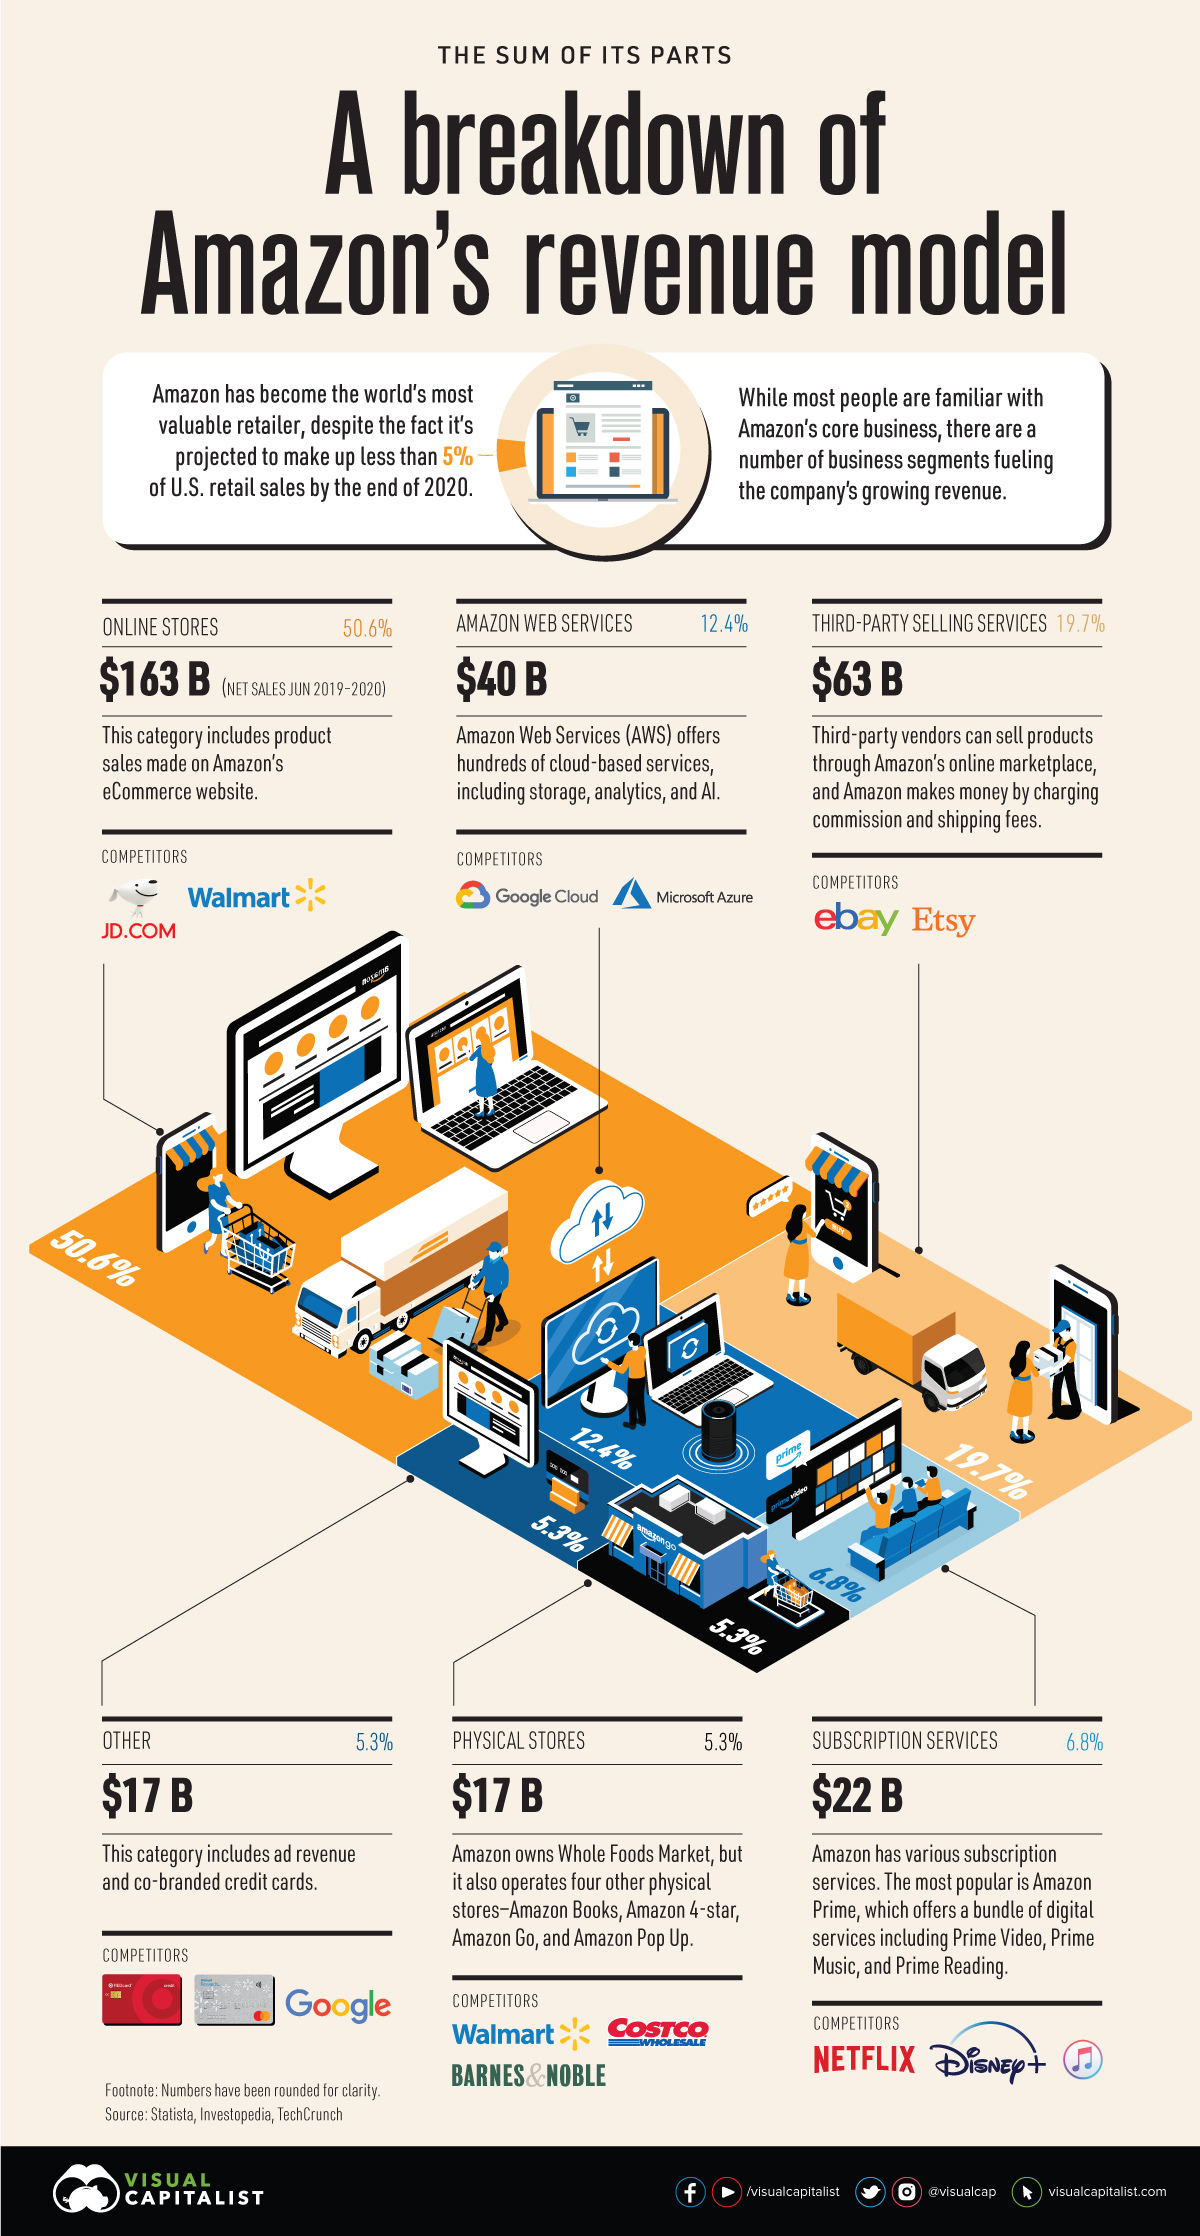
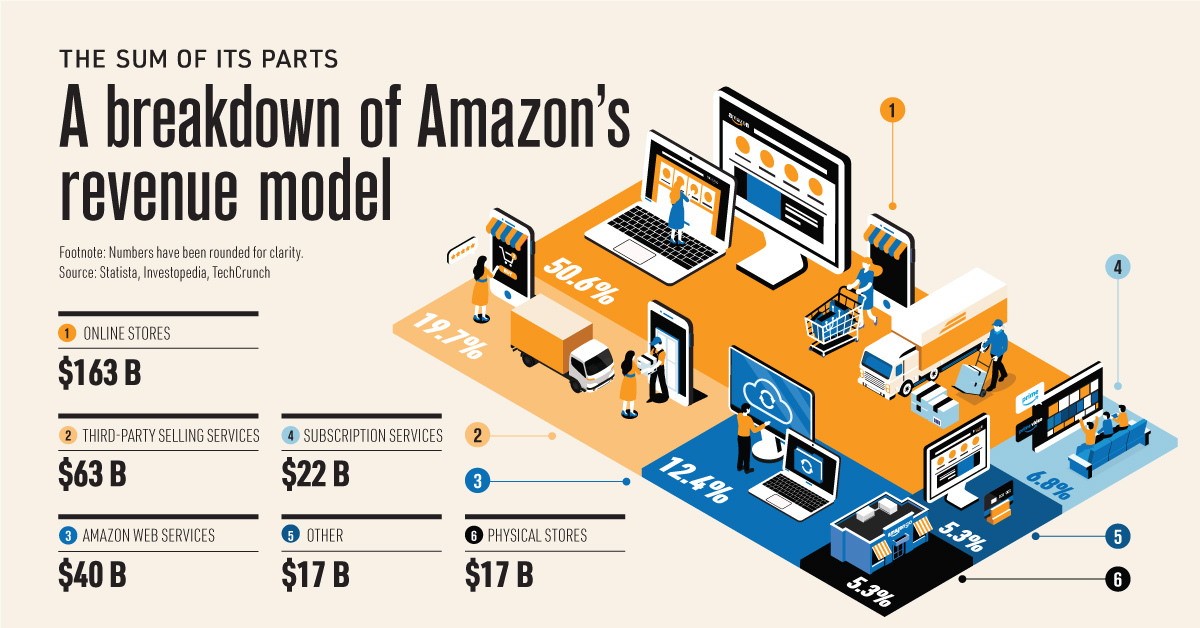
Amazon has evolved into more than just an online store. While ecommerce makes up a significant portion of the company’s overall sales, its diverse revenue model generates billions through various business segments.
This visualization provides an overview of the different parts that make up Amazon, showing each business unit’s net sales from June 2019 to 2020.
A Diverse Revenue Model
With a market cap of $1.7 trillion, Amazon is currently the most valuable retailer in the world. The company is expected to account for 4.6% of total U.S. retail sales by the end of 2020—but the tech giant is more than just a one-trick pony.
A key factor in the company’s success is its diversification into other areas. Here’s a breakdown of Amazon’s revenue mix:
| Business Segment | Net Sales (June 2019 - 2020) |
|---|---|
| Online stores | $163 B |
| Third-party selling services | $63 B |
| Amazon Web Services | $40 B |
| Subscription services | $22 B |
| Physical stores | $17 B |
| Other | $17 B |
| Total Revenue | $322 billion |
While Amazon is truly more than an online store, it’s worth noting that online sales account for a significant amount of the company’s overall revenue mix. Over the period of June 2019 to 2020, product sales from Amazon’s website generated $163 billion, which is more than the company’s other business units combined.
A significant day for online sales is Prime Day, which has grown into a major shopping event comparable to Black Friday and Cyber Monday. In 2020, Prime Day is projected to generate almost $10 billion in global revenue.
While ecommerce makes up a large portion of Amazon’s overall sales, there are many other segments that each generate billions in revenue to create immense value for the tech giant. For instance, enabling third-party sellers on the platform is the company’s second-largest unit in terms of net sales, racking up $63 billion over the course of a year.
This segment has shown tremendous growth over the last two decades. In 2018, it accounted for 58% of gross merchandise sales on Amazon, compared to just 3% in 2000. While third-party sellers technically outsold Amazon itself, the company still makes money through commission and shipping fees.
Amazon is Not Alone: Diversification is Common
Amazon isn’t the only major tech company to benefit from diverse revenue streams.
Other tech giants generate revenue through a range of products, services, and applications—for instance, while a healthy portion of Apple’s revenue comes from iPhone sales, the company captures 17% of revenue from a mix of services, ranging from Apple Pay to Apple Music. Microsoft is another example of this, considering it owns a wide range of hardware, cloud services, and platforms.
While there are several reasons to build a diverse business portfolio, a key benefit that comes from diversification is having a buffer against market crashes. This has proven to be particularly important in 2020, given the economic devastation caused by the global pandemic.
The Sum of its Parts
Despite varying levels of sales, each business unit brings unique value to Amazon.
For instance, while Amazon Web Services (AWS) falls behind online sales and third-party sellers in net sales, it’s one of the most profitable segments of the company. In the fourth quarter of 2019, more than half of Amazon’s operating income came from AWS.
In short, when looking at the many segments of Amazon, one thing is clear—the company is truly the sum of its parts.


Technology
Ranked: Semiconductor Companies by Industry Revenue Share
Nvidia is coming for Intel’s crown. Samsung is losing ground. AI is transforming the space. We break down revenue for semiconductor companies.


Semiconductor Companies by Industry Revenue Share
This was originally posted on our Voronoi app. Download the app for free on Apple or Android and discover incredible data-driven charts from a variety of trusted sources.
Did you know that some computer chips are now retailing for the price of a new BMW?
As computers invade nearly every sphere of life, so too have the chips that power them, raising the revenues of the businesses dedicated to designing them.
But how did various chipmakers measure against each other last year?
We rank the biggest semiconductor companies by their percentage share of the industry’s revenues in 2023, using data from Omdia research.
Which Chip Company Made the Most Money in 2023?
Market leader and industry-defining veteran Intel still holds the crown for the most revenue in the sector, crossing $50 billion in 2023, or 10% of the broader industry’s topline.
All is not well at Intel, however, with the company’s stock price down over 20% year-to-date after it revealed billion-dollar losses in its foundry business.
| Rank | Company | 2023 Revenue | % of Industry Revenue |
|---|---|---|---|
| 1 | Intel | $51B | 9.4% |
| 2 | NVIDIA | $49B | 9.0% |
| 3 | Samsung Electronics | $44B | 8.1% |
| 4 | Qualcomm | $31B | 5.7% |
| 5 | Broadcom | $28B | 5.2% |
| 6 | SK Hynix | $24B | 4.4% |
| 7 | AMD | $22B | 4.1% |
| 8 | Apple | $19B | 3.4% |
| 9 | Infineon Tech | $17B | 3.2% |
| 10 | STMicroelectronics | $17B | 3.2% |
| 11 | Texas Instruments | $17B | 3.1% |
| 12 | Micron Technology | $16B | 2.9% |
| 13 | MediaTek | $14B | 2.6% |
| 14 | NXP | $13B | 2.4% |
| 15 | Analog Devices | $12B | 2.2% |
| 16 | Renesas Electronics Corporation | $11B | 1.9% |
| 17 | Sony Semiconductor Solutions Corporation | $10B | 1.9% |
| 18 | Microchip Technology | $8B | 1.5% |
| 19 | Onsemi | $8B | 1.4% |
| 20 | KIOXIA Corporation | $7B | 1.3% |
| N/A | Others | $126B | 23.2% |
| N/A | Total | $545B | 100% |
Note: Figures are rounded. Totals and percentages may not sum to 100.
Meanwhile, Nvidia is very close to overtaking Intel, after declaring $49 billion of topline revenue for 2023. This is more than double its 2022 revenue ($21 billion), increasing its share of industry revenues to 9%.
Nvidia’s meteoric rise has gotten a huge thumbs-up from investors. It became a trillion dollar stock last year, and broke the single-day gain record for market capitalization this year.
Other chipmakers haven’t been as successful. Out of the top 20 semiconductor companies by revenue, 12 did not match their 2022 revenues, including big names like Intel, Samsung, and AMD.
The Many Different Types of Chipmakers
All of these companies may belong to the same industry, but they don’t focus on the same niche.
According to Investopedia, there are four major types of chips, depending on their functionality: microprocessors, memory chips, standard chips, and complex systems on a chip.
Nvidia’s core business was once GPUs for computers (graphics processing units), but in recent years this has drastically shifted towards microprocessors for analytics and AI.
These specialized chips seem to be where the majority of growth is occurring within the sector. For example, companies that are largely in the memory segment—Samsung, SK Hynix, and Micron Technology—saw peak revenues in the mid-2010s.

-

 Green2 weeks ago
Ranked: Top Countries by Total Forest Loss Since 2001
-

 Travel1 week ago
Ranked: The World’s Top Flight Routes, by Revenue
-

 Technology1 week ago
Ranked: Semiconductor Companies by Industry Revenue Share
-

 Money2 weeks ago
Which States Have the Highest Minimum Wage in America?
-

 Real Estate2 weeks ago
Ranked: The Most Valuable Housing Markets in America
-

 Markets2 weeks ago
Charted: Big Four Market Share by S&P 500 Audits
-

 AI2 weeks ago
The Stock Performance of U.S. Chipmakers So Far in 2024
-

 Automotive2 weeks ago
Almost Every EV Stock is Down After Q1 2024