Green
All the World’s Carbon Emissions in One Chart
Get this infographic as a poster (and save 15% by being a VC+ member)


All the World’s Carbon Emissions in One Chart
Two degrees Celsius may not seem like much, but on our planet, it could be the difference between thriving life and a disastrous climate.
Over two centuries of burning fossil fuels have added up, and global decision-makers and business leaders are focusing in on carbon emissions as a key issue.
Emissions by Country
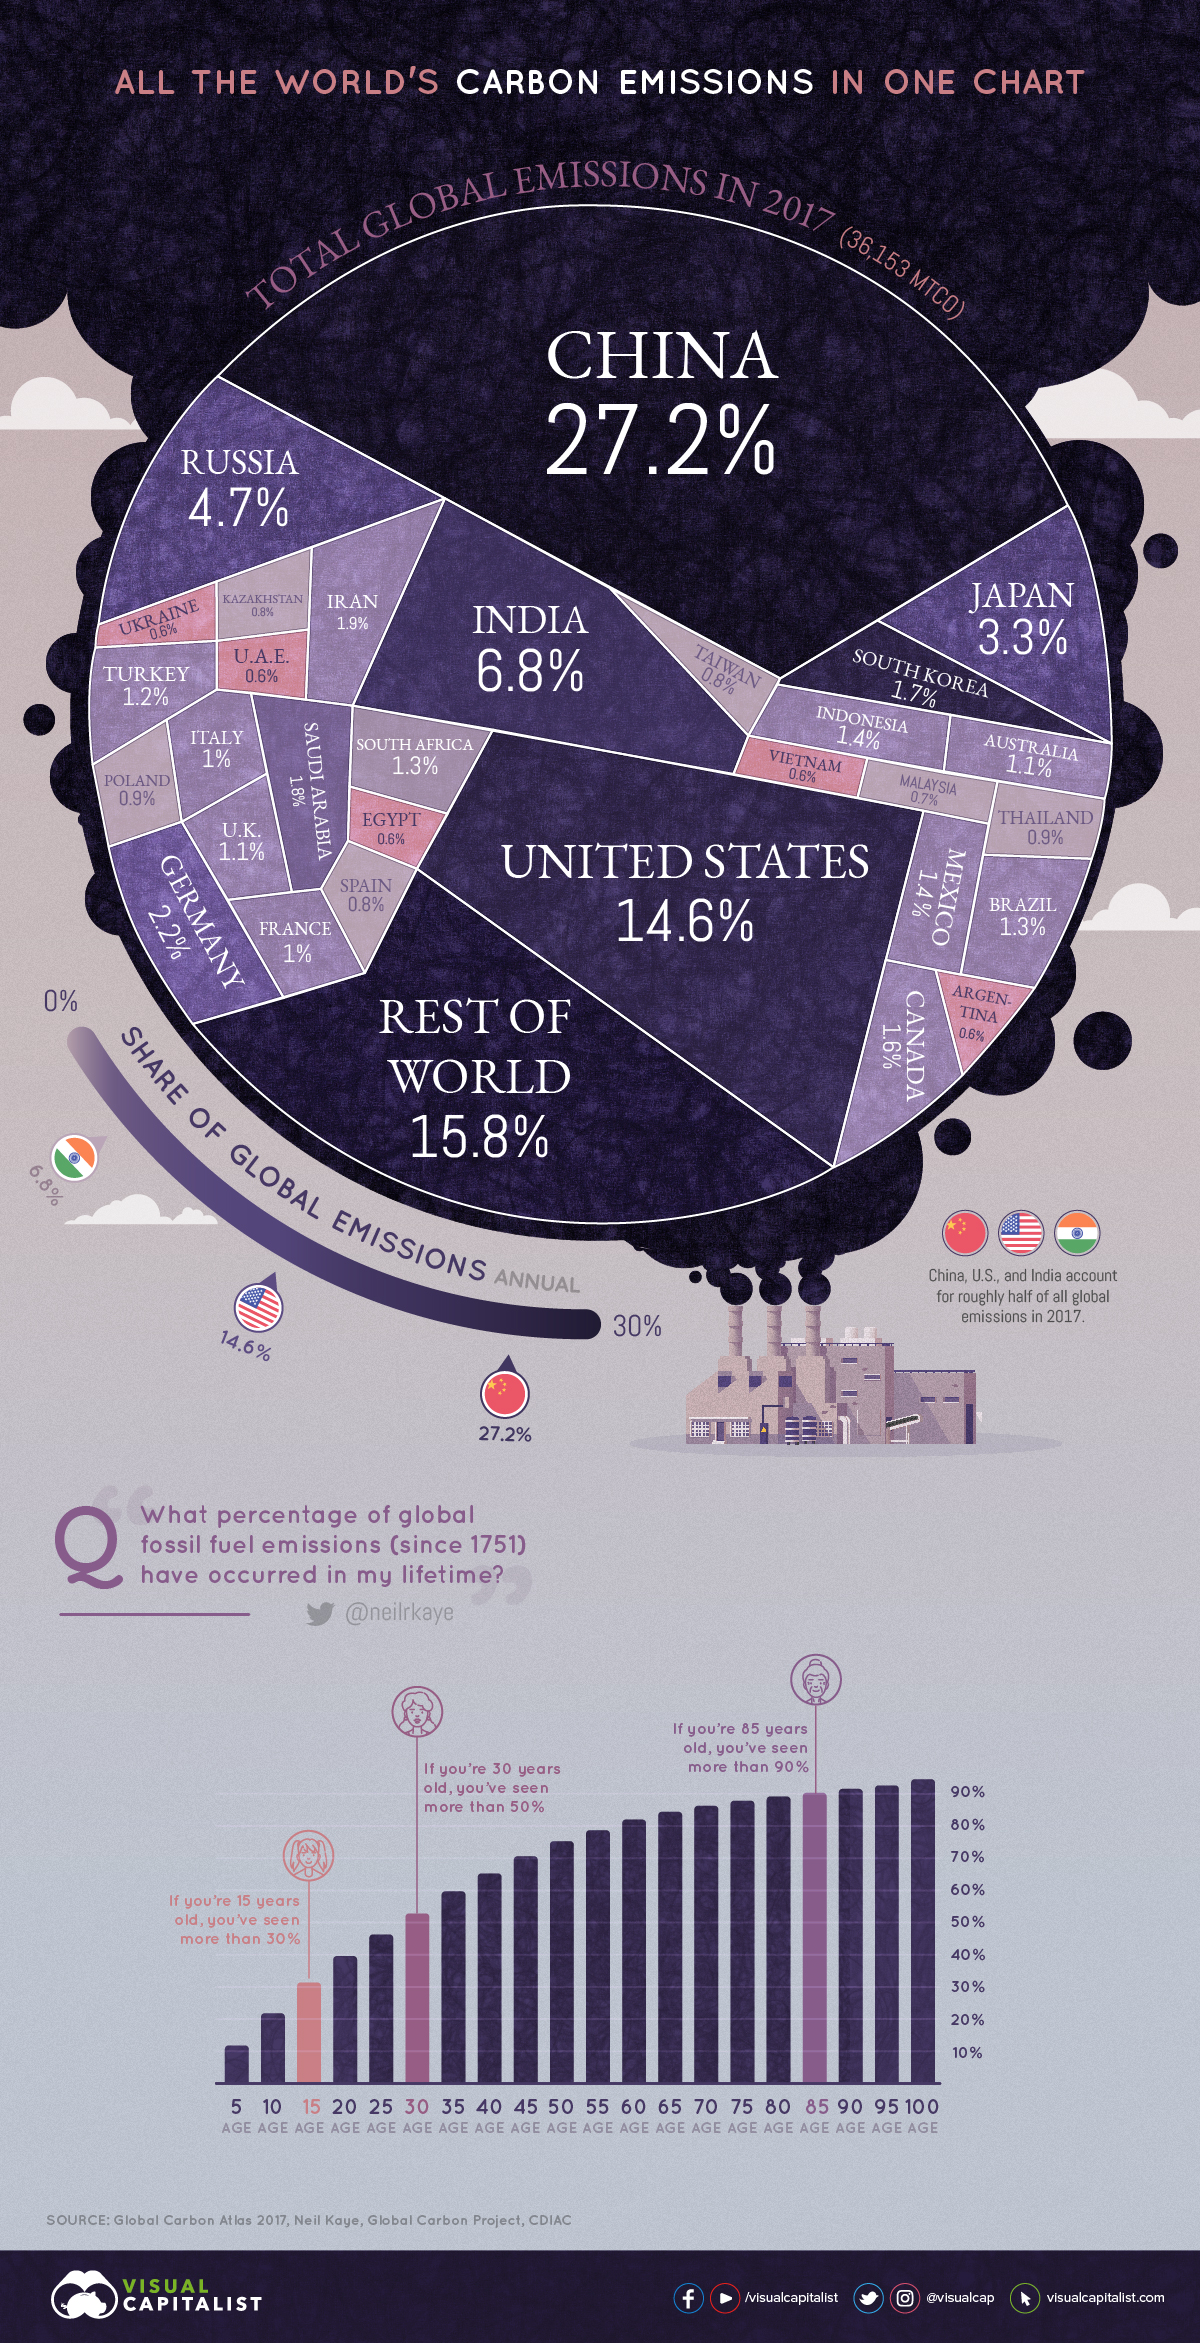
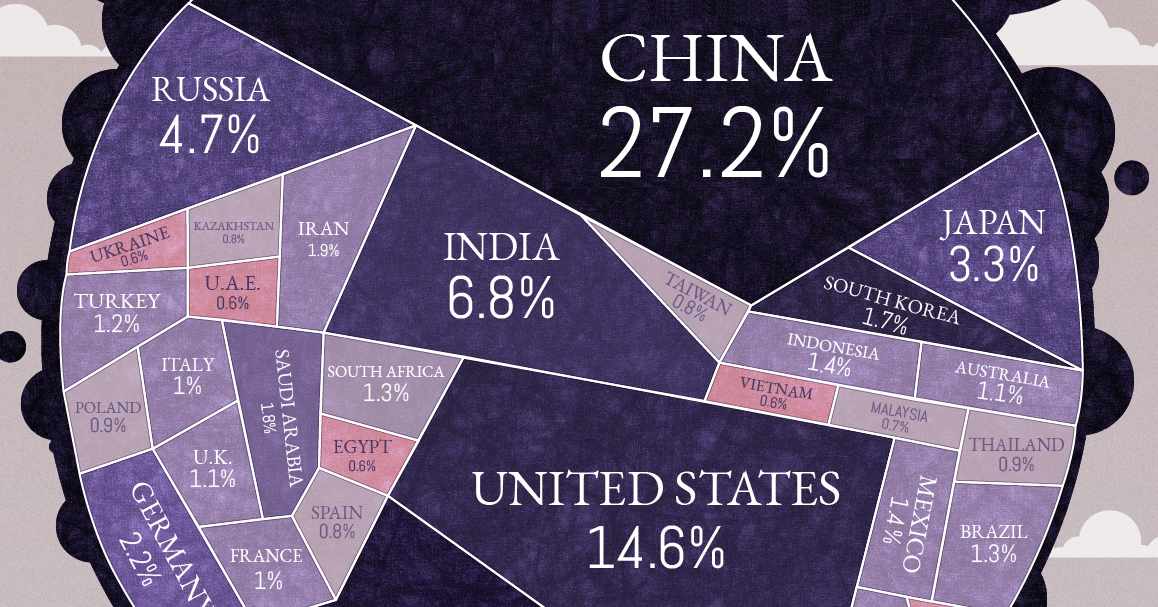
This week’s chart uses the most recent data from Global Carbon Atlas to demonstrate where most of the world’s CO₂ emissions come from, sorted by country.
| Rank | Country | Emissions in 2017 (MtCO₂) | % of Global Emissions |
|---|---|---|---|
| #1 | 🇨🇳 China | 9,839 | 27.2% |
| #2 | 🇺🇸 United States | 5,269 | 14.6% |
| #3 | 🇮🇳 India | 2,467 | 6.8% |
| #4 | 🇷🇺 Russia | 1,693 | 4.7% |
| #5 | 🇯🇵 Japan | 1,205 | 3.3% |
| #6 | 🇩🇪 Germany | 799 | 2.2% |
| #7 | 🇮🇷 Iran | 672 | 1.9% |
| #8 | 🇸🇦 Saudi Arabia | 635 | 1.8% |
| #9 | 🇰🇷 South Korea | 616 | 1.7% |
| #10 | 🇨🇦 Canada | 573 | 1.6% |
| #11 | 🇲🇽 Mexico | 490 | 1.4% |
| #12 | 🇮🇩 Indonesia | 487 | 1.3% |
| #13 | 🇧🇷 Brazil | 476 | 1.3% |
| #14 | 🇿🇦 South Africa | 456 | 1.3% |
| #15 | 🇹🇷 Turkey | 448 | 1.2% |
| 🌐 Top 15 | 26,125 | 72.2% | |
| 🌐 Rest of World | 10,028 | 27.7% |
In terms of absolute emissions, the heavy hitters are immediately obvious. Large economies such as China, the United States, and India alone account for almost half the world’s emissions. Zoom out a little further, and it’s even clearer that just a handful of countries are responsible for the majority of emissions.
Of course, absolute emissions don’t tell the full story. The world is home to over 7.5 billion people, but they aren’t distributed evenly across the globe. How do these carbon emissions shake out on a per capita basis?
Here are the 20 countries with the highest emissions per capita:
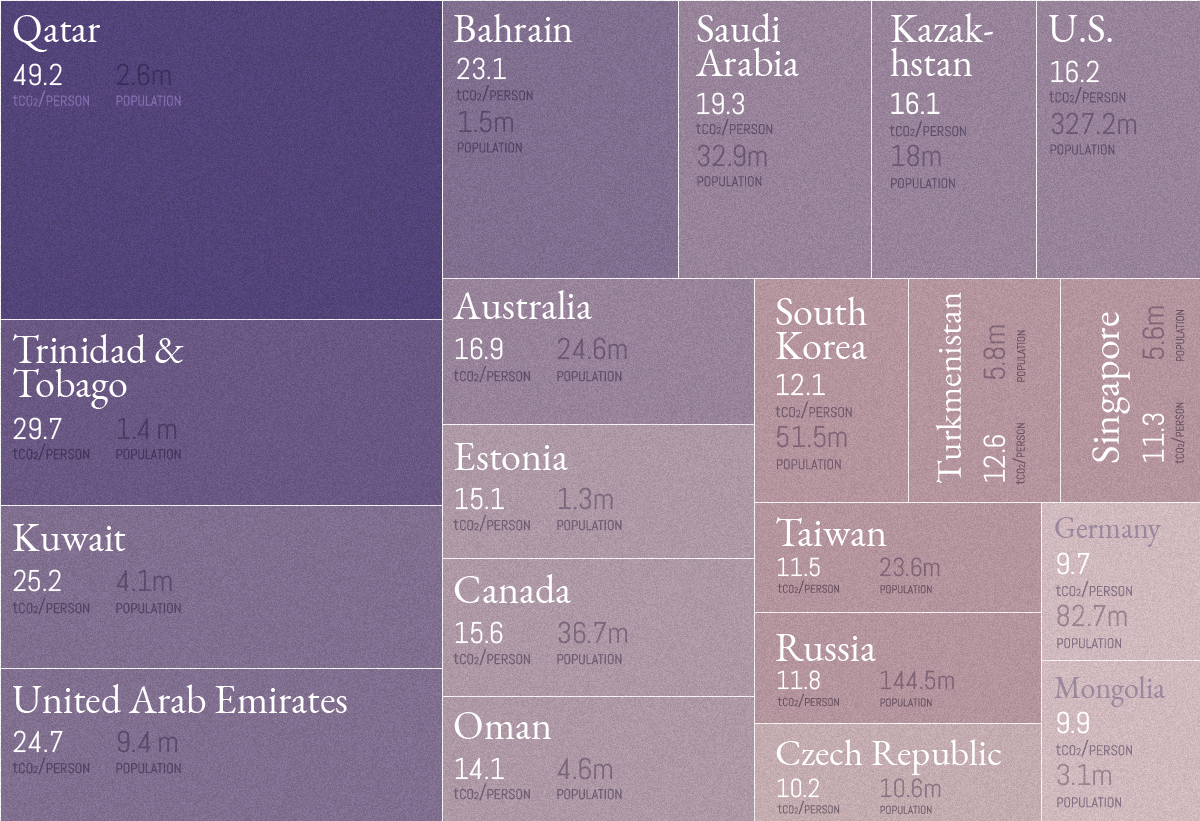
Source: Global Carbon Atlas. Note: We’ve only included places with a population above one million, which excludes islands and areas such as Curaçao, Brunei, Luxembourg, Iceland, Greenland, and Bermuda.
Out of the original 30 countries in the main visualization, six countries show up again as top CO₂ emitters when adjusted for population count: Saudi Arabia, the United States, Canada, South Korea, Russia, and Germany.
The CO₂ Conundrum
We know that rapid urbanization and industrialization have had an impact on carbon emissions entering the atmosphere, but at what rate?
Climate data scientist Neil Kaye answers the question from a different perspective, by mapping what percentage of emissions have been created during your lifetime since the Industrial Revolution:
| Your Age | % of Total Global Emissions |
|---|---|
| 15 years old | You've been alive for more than 30% of emissions |
| 30 years old | You've been alive for more than 50% of emissions |
| 85 years old | You've been alive for more than 90% of emissions |
Put another way, the running total of emissions is growing at an accelerating rate. This is best seen in the dramatic shortening between the time periods taken for 400 billion tonnes of CO₂ to enter the atmosphere:
- First period: 217 years (1751 to 1967)
- Second period: 23 years (1968 to 1990)
- Third period: 16 years (1991 to 2006)
- Fourth period: 11 years (2007 to 2018)
In order to be a decarbonised economy by 2050, we have to bend the (emissions) curve by 2020… Not only is it urgent and necessary, but actually we are very nicely on our way to achieving it.
— Christiana Figueres, Convenor of Mission 2020


Green
Ranking the Top 15 Countries by Carbon Tax Revenue
This graphic highlights France and Canada as the global leaders when it comes to generating carbon tax revenue.


Top 15 Countries by Carbon Tax Revenue
This was originally posted on our Voronoi app. Download the app for free on iOS or Android and discover incredible data-driven charts from a variety of trusted sources.
Carbon taxes are designed to discourage CO2 emissions by increasing the cost of carbon-intensive activities and incentivizing the adoption of cleaner energy alternatives.
In this graphic we list the top 15 countries by carbon tax revenue as of 2022. The data is from the World Bank’s State and Trends of Carbon Pricing Report, published in April 2023.
France and Canada Lead in Global Carbon Tax Revenue
In 2022, the top 15 countries generated approximately $30 billion in revenue from carbon taxes.
France and Canada lead in this regard, accounting for over half of the total amount. Both countries have implemented comprehensive carbon pricing systems that cover a wide range of sectors, including transportation and industry, and they have set relatively high carbon tax rates.
| Country | Government revenue in 2022 ($ billions) |
|---|---|
| 🇫🇷 France | $8.9 |
| 🇨🇦 Canada | $7.8 |
| 🇸🇪 Sweden | $2.3 |
| 🇳🇴 Norway | $2.1 |
| 🇯🇵 Japan | $1.8 |
| 🇫🇮 Finland | $1.7 |
| 🇨🇭 Switzerland | $1.6 |
| 🇬🇧 United Kingdom | $0.9 |
| 🇮🇪 Ireland | $0.7 |
| 🇩🇰 Denmark | $0.5 |
| 🇵🇹 Portugal | $0.5 |
| 🇦🇷 Argentina | $0.3 |
| 🇲🇽 Mexico | $0.2 |
| 🇸🇬 Singapore | $0.1 |
| 🇿🇦 South Africa | $0.1 |
In Canada, the total carbon tax revenue includes both national and provincial taxes.
While carbon pricing has been recognized internationally as one of the more efficient mechanisms for reducing CO2 emissions, research is divided over what the global average carbon price should be to achieve the goals of the Paris Climate Agreement, which aims to limit global warming to 1.5–2°C by 2100 relative to pre-industrial levels.
A recent study has shown that carbon pricing must be supported by other policy measures and innovations. According to a report from Queen’s University, there is no feasible carbon pricing scenario that is high enough to limit emissions sufficiently to achieve anything below 2.4°C warming on its own.

-

 Real Estate2 weeks ago
Visualizing America’s Shortage of Affordable Homes
-

 Technology1 week ago
Ranked: Semiconductor Companies by Industry Revenue Share
-

 Money1 week ago
Which States Have the Highest Minimum Wage in America?
-

 Real Estate1 week ago
Ranked: The Most Valuable Housing Markets in America
-

 Business2 weeks ago
Charted: Big Four Market Share by S&P 500 Audits
-

 AI2 weeks ago
The Stock Performance of U.S. Chipmakers So Far in 2024
-

 Misc2 weeks ago
Almost Every EV Stock is Down After Q1 2024
-

 Money2 weeks ago
Where Does One U.S. Tax Dollar Go?