Mining
All the Metals We Mined in One Visualization
![]() Subscribe to the Elements free mailing list for more like this
Subscribe to the Elements free mailing list for more like this
View the full-size infographic
All the Metals We Mined in One Visualization
This was originally posted on Elements. Sign up to the free mailing list to get beautiful visualizations on natural resource megatrends in your email every week.
Metals are all around us, from our phones and cars to our homes and office buildings.
While we often overlook the presence of these raw materials, they are an essential part of the modern economy. But obtaining these materials can be a complex process that involves mining, refining, and then converting them into usable forms.
So, how much metal gets mined in a year?
Metals vs Ores
Before digging into the numbers, it’s important that we distinguish between ores and metals.
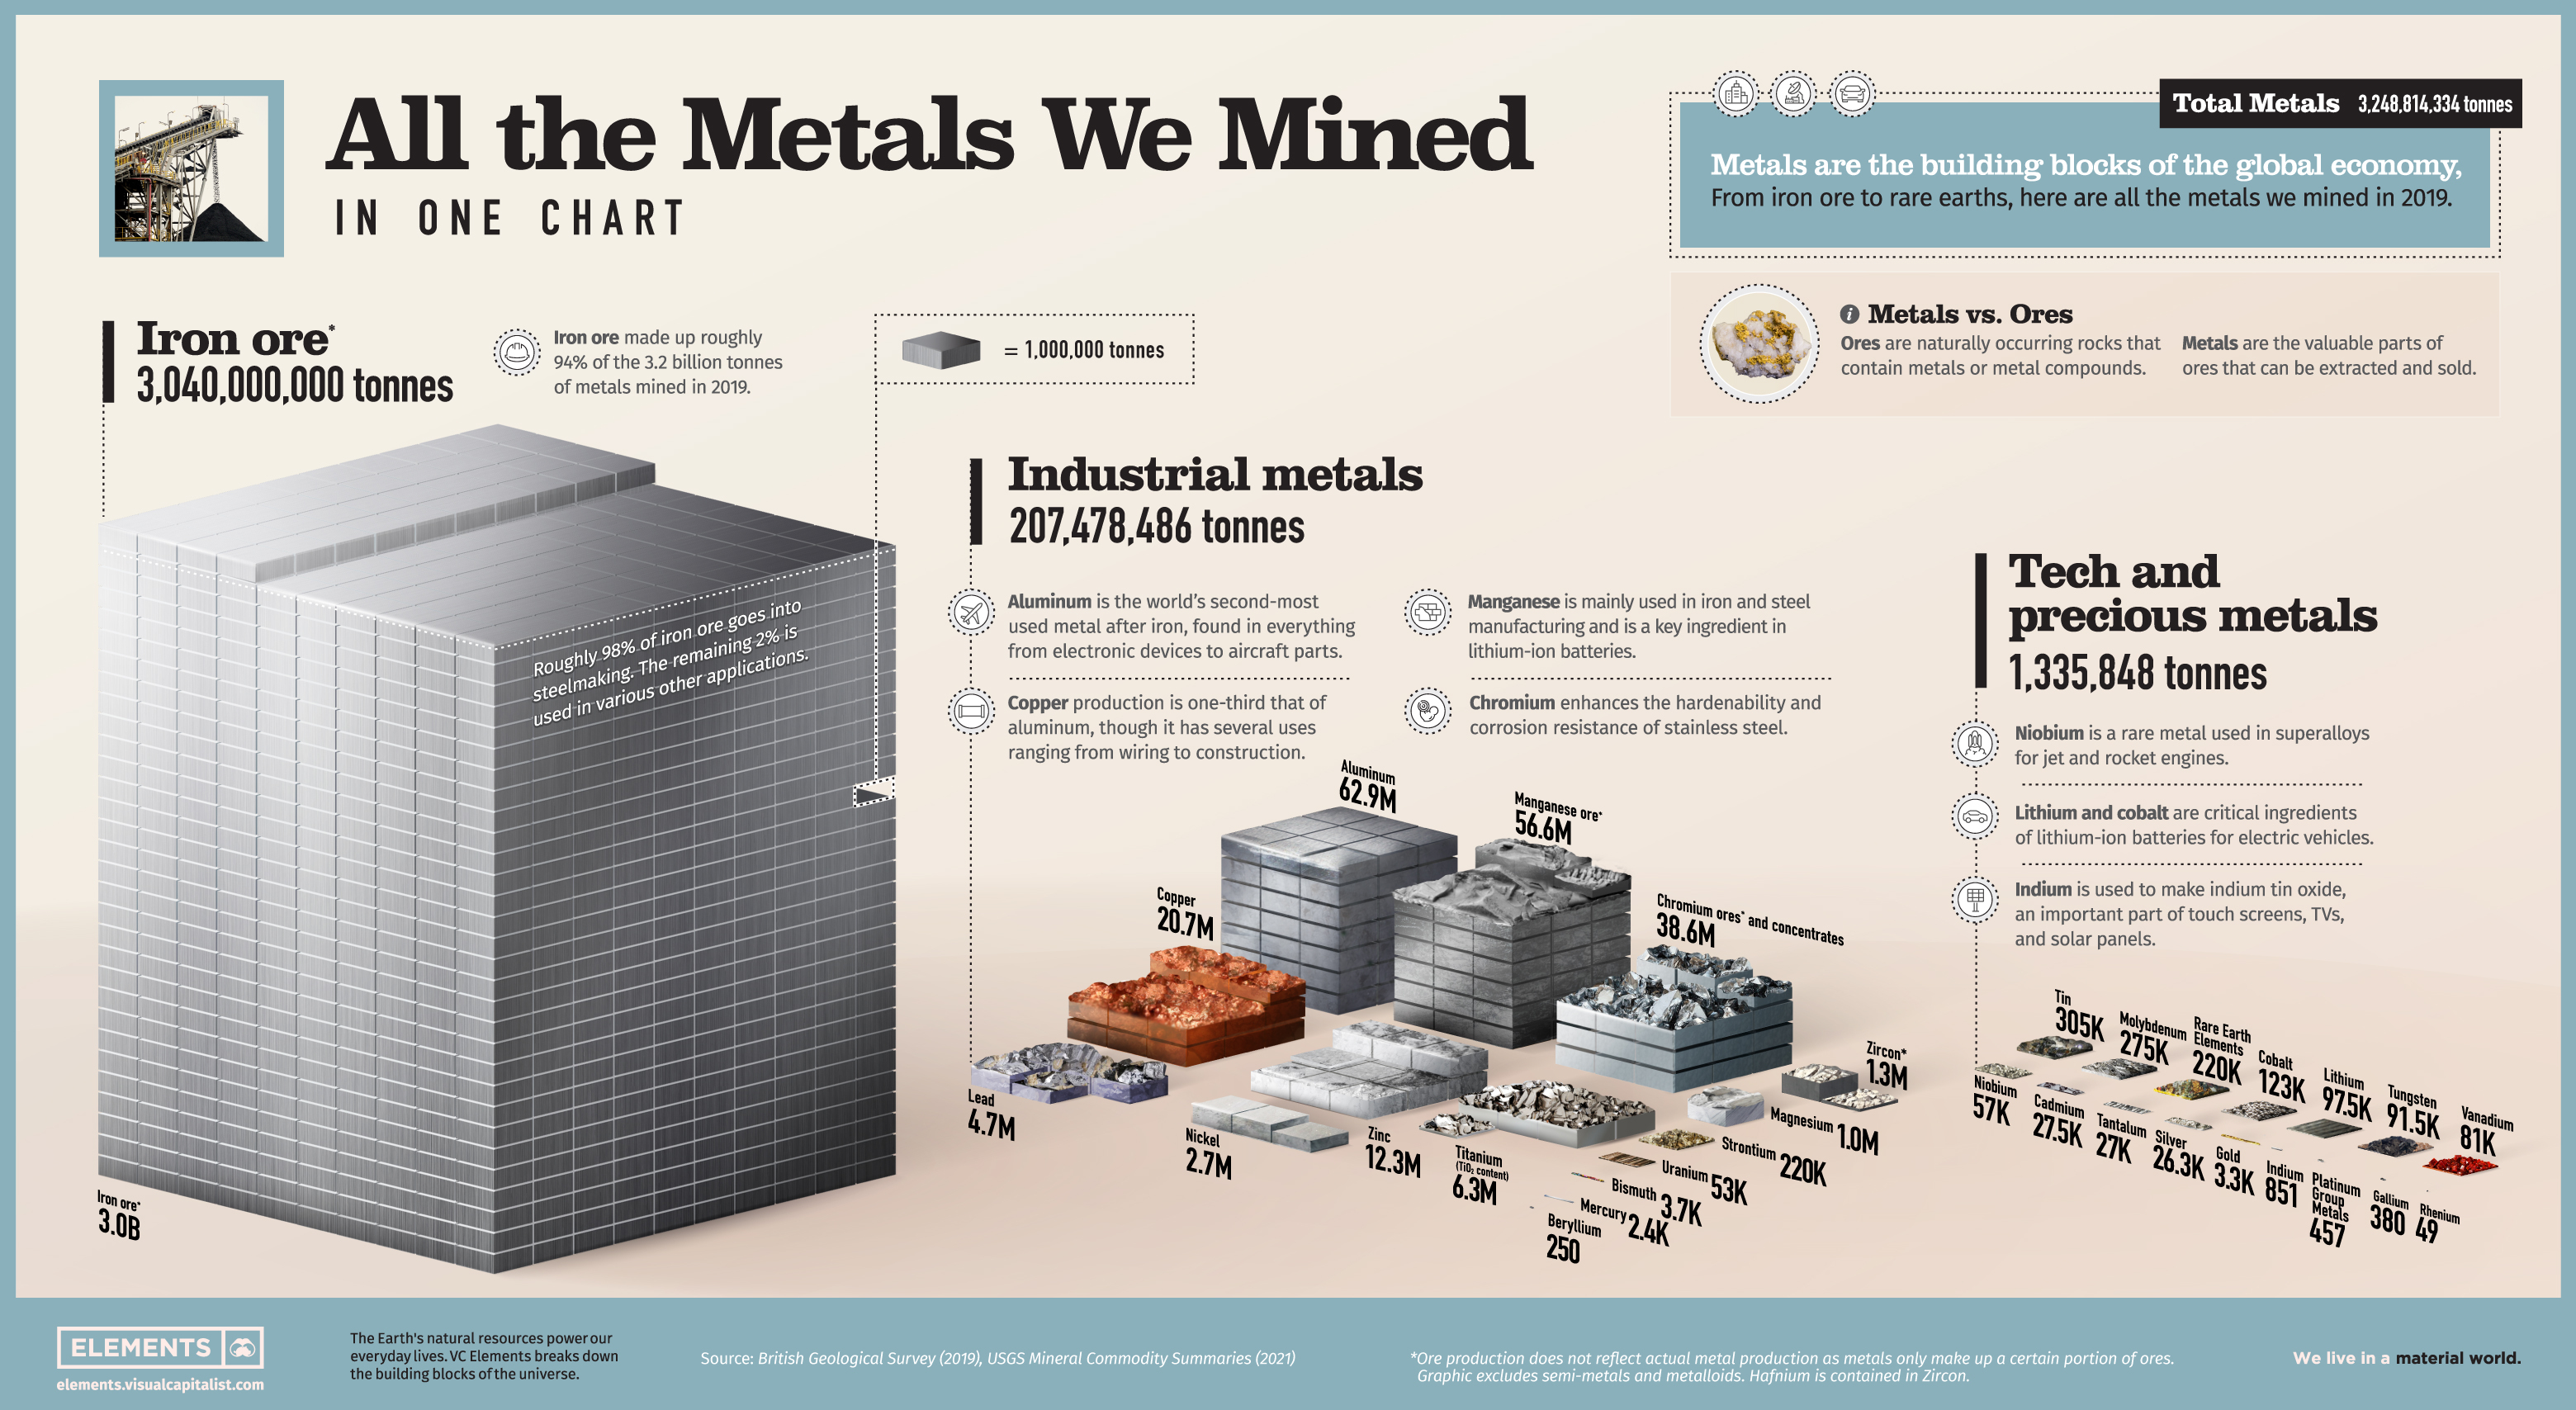
Ores are naturally occurring rocks that contain metals and metal compounds. Metals are the valuable parts of ores that can be extracted by separating and removing the waste rock. As a result, ore production is typically much higher than the actual metal content of the ore. For example, miners produced 347 million tonnes of bauxite ore in 2019, but the actual aluminum metal content extracted from that was only 62.9 million tonnes.
Here are all the metals and metal ores mined in 2019, according to the British Geological Survey:
| Metal/Ore | Quantity Mined (tonnes) | % of Total |
|---|---|---|
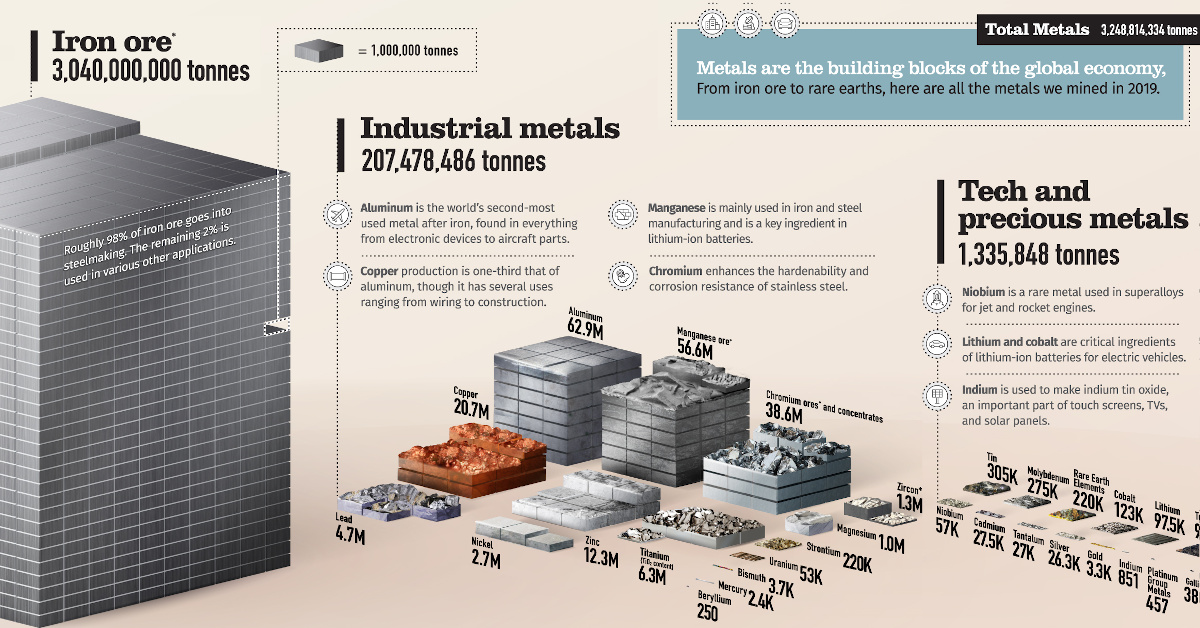
| Iron Ore | 3,040,000,000 | 93.57% |
| Industrial Metals | 207,478,486 | 6.39% |
| Technology and Precious Metals | 1,335,848 | 0.04% |
| Total | 3,248,814,334 | 100% |
Miners produced roughly three billion tonnes of iron ore in 2019, representing close to 94% of all mined metals. The primary use of all this iron is to make steel. In fact, 98% of iron ore goes into steelmaking, with the rest fulfilling various other applications.
Industrial and technology metals made up the other 6% of all mined metals in 2019. How do they break down?
Industrial Metals
From construction and agriculture to manufacturing and transportation, virtually every industry harnesses the properties of metals in different ways.
Here are the industrial metals we mined in 2019.
| Metal | Quantity Mined (tonnes) | % of Total |
|---|---|---|
| Aluminum | 62,900,000 | 30% |
| Manganese Ore | 56,600,000 | 27% |
| Chromium Ores and Concentrates | 38,600,000 | 19% |
| Copper | 20,700,000 | 10% |
| Zinc | 12,300,000 | 6% |
| Titanium (Titanium Dioxide Content) | 6,300,000 | 3% |
| Lead | 4,700,000 | 2% |
| Nickel | 2,702,000 | 1% |
| Zirconium Minerals (Zircon) | 1,337,000 | 1% |
| Magnesium | 1,059,736 | 1% |
| Strontium | 220,000 | 0.11% |
| Uranium | 53,400 | 0.03% |
| Bismuth | 3,700 | 0.002% |
| Mercury | 2,400 | 0.001% |
| Beryllium | 250 | 0.0001% |
| Total | 207,478,486 | 100% |
Percentages may not add up to 100 due to rounding.
It’s no surprise that aluminum is the most-produced industrial metal. The lightweight metal is one of the most commonly used materials in the world, with uses ranging from making foils and beer kegs to buildings and aircraft parts.
Manganese and chromium rank second and third respectively in terms of metal mined, and are important ingredients in steelmaking. Manganese helps convert iron ore into steel, and chromium hardens and toughens steel. Furthermore, manganese is a critical ingredient of lithium-manganese-cobalt-oxide (NMC) batteries for electric vehicles.
Although copper production is around one-third that of aluminum, copper has a key role in making modern life possible. The red metal is found in virtually every wire, motor, and electrical appliance in our homes and offices. It’s also critical for various renewable energy technologies and electric vehicles.
Technology and Precious Metals
Technology is only as good as the materials that make it.
Technology metals can be classified as relatively rare metals commonly used in technology and devices. While miners produce some tech and precious metals in large quantities, others are relatively scarce.
| Metal | Quantity Mined in 2019 (tonnes) | % of Total |
|---|---|---|
| Tin | 305,000 | 23% |
| Molybdenum | 275,000 | 21% |
| Rare Earth Elements | 220,000 | 16% |
| Cobalt | 123,000 | 9% |
| Lithium | 97,500 | 7% |
| Tungsten | 91,500 | 7% |
| Vanadium | 81,000 | 6% |
| Niobium | 57,000 | 4% |
| Cadmium | 27,500 | 2% |
| Tantalum | 27,000 | 2% |
| Silver | 26,261 | 2% |
| Gold | 3,350 | 0.3% |
| Indium | 851 | 0.06% |
| Platinum Group Metals | 457 | 0.03% |
| Gallium | 380 | 0.03% |
| Rhenium | 49 | 0.004% |
| Total | 1,335,848 | 100.00% |
Percentages may not add up to 100 due to rounding.
Tin was the most-mined tech metal in 2019, and according to the International Tin Association, nearly half of it went into soldering.
It’s also interesting to see the prevalence of battery and energy metals. Lithium, cobalt, vanadium, and molybdenum are all critical for various energy technologies, including lithium-ion batteries, wind farms, and energy storage technologies. Additionally, miners also extracted 220,000 tonnes of rare earth elements, of which 60% came from China.
Given their rarity, it’s not surprising that gold, silver, and platinum group metals (PGMs) were the least-mined materials in this category. Collectively, these metals represent just 2.3% of the tech and precious metals mined in 2019.
A Material World
Although humans mine and use massive quantities of metals every year, it’s important to put these figures into perspective.
According to Circle Economy, the world consumes 100.6 billion tonnes of materials annually. Of this total, 3.2 billion tonnes of metals produced in 2019 would account for just 3% of our overall material consumption. In fact, the world’s annual production of cement alone is around 4.1 billion tonnes, dwarfing total metal production.
The world’s appetite for materials is growing with its population. As resource-intensive megatrends such as urbanization and electrification pick up the pace, our material pie will only get larger.


Copper
Brass Rods: The Secure Choice
This graphic shows why brass rods are the secure choice for precision-machined and forged parts.


Brass Rods: The Secure Choice
The unique combination of machinability and recyclability makes brass rods the secure choice for manufacturers seeking future-proof raw material solutions.
This infographic, from the Copper Development Association, shows three ways brass rods give manufacturers greater control and a license to grow in the competitive market for precision-machined and forged products.
Future-Proof Investments in New Machine Tools
A material’s machinability directly impacts machine throughput, which typically has the largest impact on machine shop profitability.
The high-speed machining capabilities of brass rods maximize machine tool performance, allowing manufacturers to run the material faster and longer without sacrificing tool life, chip formation, or surface quality.
The high machining efficiency of brass leads to reduced per-part costs, quicker return on investment (ROI) for new machine tools, and expanded production capacity for new projects.
Supply Security Through Closed Loop Recycling
Brass, like its parent element copper, can be infinitely recycled.
In 2022, brass- and wire-rod mills accounted for the majority of the 830,000 tonnes of copper recycled from scrap in the United States.
Given that scrap ratios for machined parts typically range from 60-70% by weight, producing mills benefit from a secure and steady supply of clean scrap returned directly from customers, which is recycled to create new brass rods.
The high residual value of brass scrap creates a strong recycling incentive. Scrap buy back programs give manufacturers greater control over raw material net costs as scrap value is often factored into supplier purchase agreements.
Next Generation Alloys for a Lead-Free Future
Increasingly stringent global regulations continue to pressure manufacturers to minimize the use of materials containing trace amounts of lead and other harmful impurities.
The latest generation of brass-rod alloys is engineered to meet the most demanding criteria for lead leaching in drinking water and other sensitive applications.
Seven brass-rod alloys passed rigorous testing to become the only ‘Acceptable Materials’ against lower lead leaching criteria recently adopted in the national U.S. drinking water quality standard, NSF 61.
Learn more about the advantages of brass rods solutions.

-

 Base Metals1 year ago
Ranked: The World’s Largest Copper Producers
Many new technologies critical to the energy transition rely on copper. Here are the world’s largest copper producers.
-

 Silver2 years ago
Mapped: Solar Power by Country in 2021
In 2020, solar power saw its largest-ever annual capacity expansion at 127 gigawatts. Here’s a snapshot of solar power capacity by country.
-

 Batteries5 years ago
Visualizing Copper’s Role in the Transition to Clean Energy
A clean energy transition is underway as wind, solar, and batteries take center stage. Here’s how copper plays the critical role in these technologies.
-

 Science5 years ago
Everything You Need to Know on VMS Deposits
Deep below the ocean’s waves, VMS deposits spew out massive amounts of minerals like copper, zinc, and gold, making them a key source of the metals…
-
 Copper5 years ago
How Much Copper is in an Electric Vehicle?
Have you ever wondered how much copper is in an electric vehicle? This infographic shows the metal’s properties as well as the quantity of copper used.
-
 Copper6 years ago
Copper: Driving the Green Energy Revolution
Renewable energy is set to fuel a new era of copper demand – here’s how much copper is used in green applications from EVs to photovoltaics.


-

 Real Estate2 weeks ago
Visualizing America’s Shortage of Affordable Homes
-

 Technology1 week ago
Ranked: Semiconductor Companies by Industry Revenue Share
-

 Money1 week ago
Which States Have the Highest Minimum Wage in America?
-

 Real Estate1 week ago
Ranked: The Most Valuable Housing Markets in America
-

 Business2 weeks ago
Charted: Big Four Market Share by S&P 500 Audits
-

 AI2 weeks ago
The Stock Performance of U.S. Chipmakers So Far in 2024
-

 Misc2 weeks ago
Almost Every EV Stock is Down After Q1 2024
-

 Money2 weeks ago
Where Does One U.S. Tax Dollar Go?