Mining
All the Metals We Mined in 2021: Visualized
![]() Subscribe to the Elements free mailing list for more like this
Subscribe to the Elements free mailing list for more like this
View the full-size infographic
All the Metals We Mined in 2021
This was originally posted on Elements. Sign up to the free mailing list to get beautiful visualizations on natural resource megatrends in your email every week.
“If you can’t grow it, you have to mine it” is a famous saying that encapsulates the importance of minerals and metals in the modern world.
From every building we enter to every device we use, virtually everything around us contains some amount of metal.
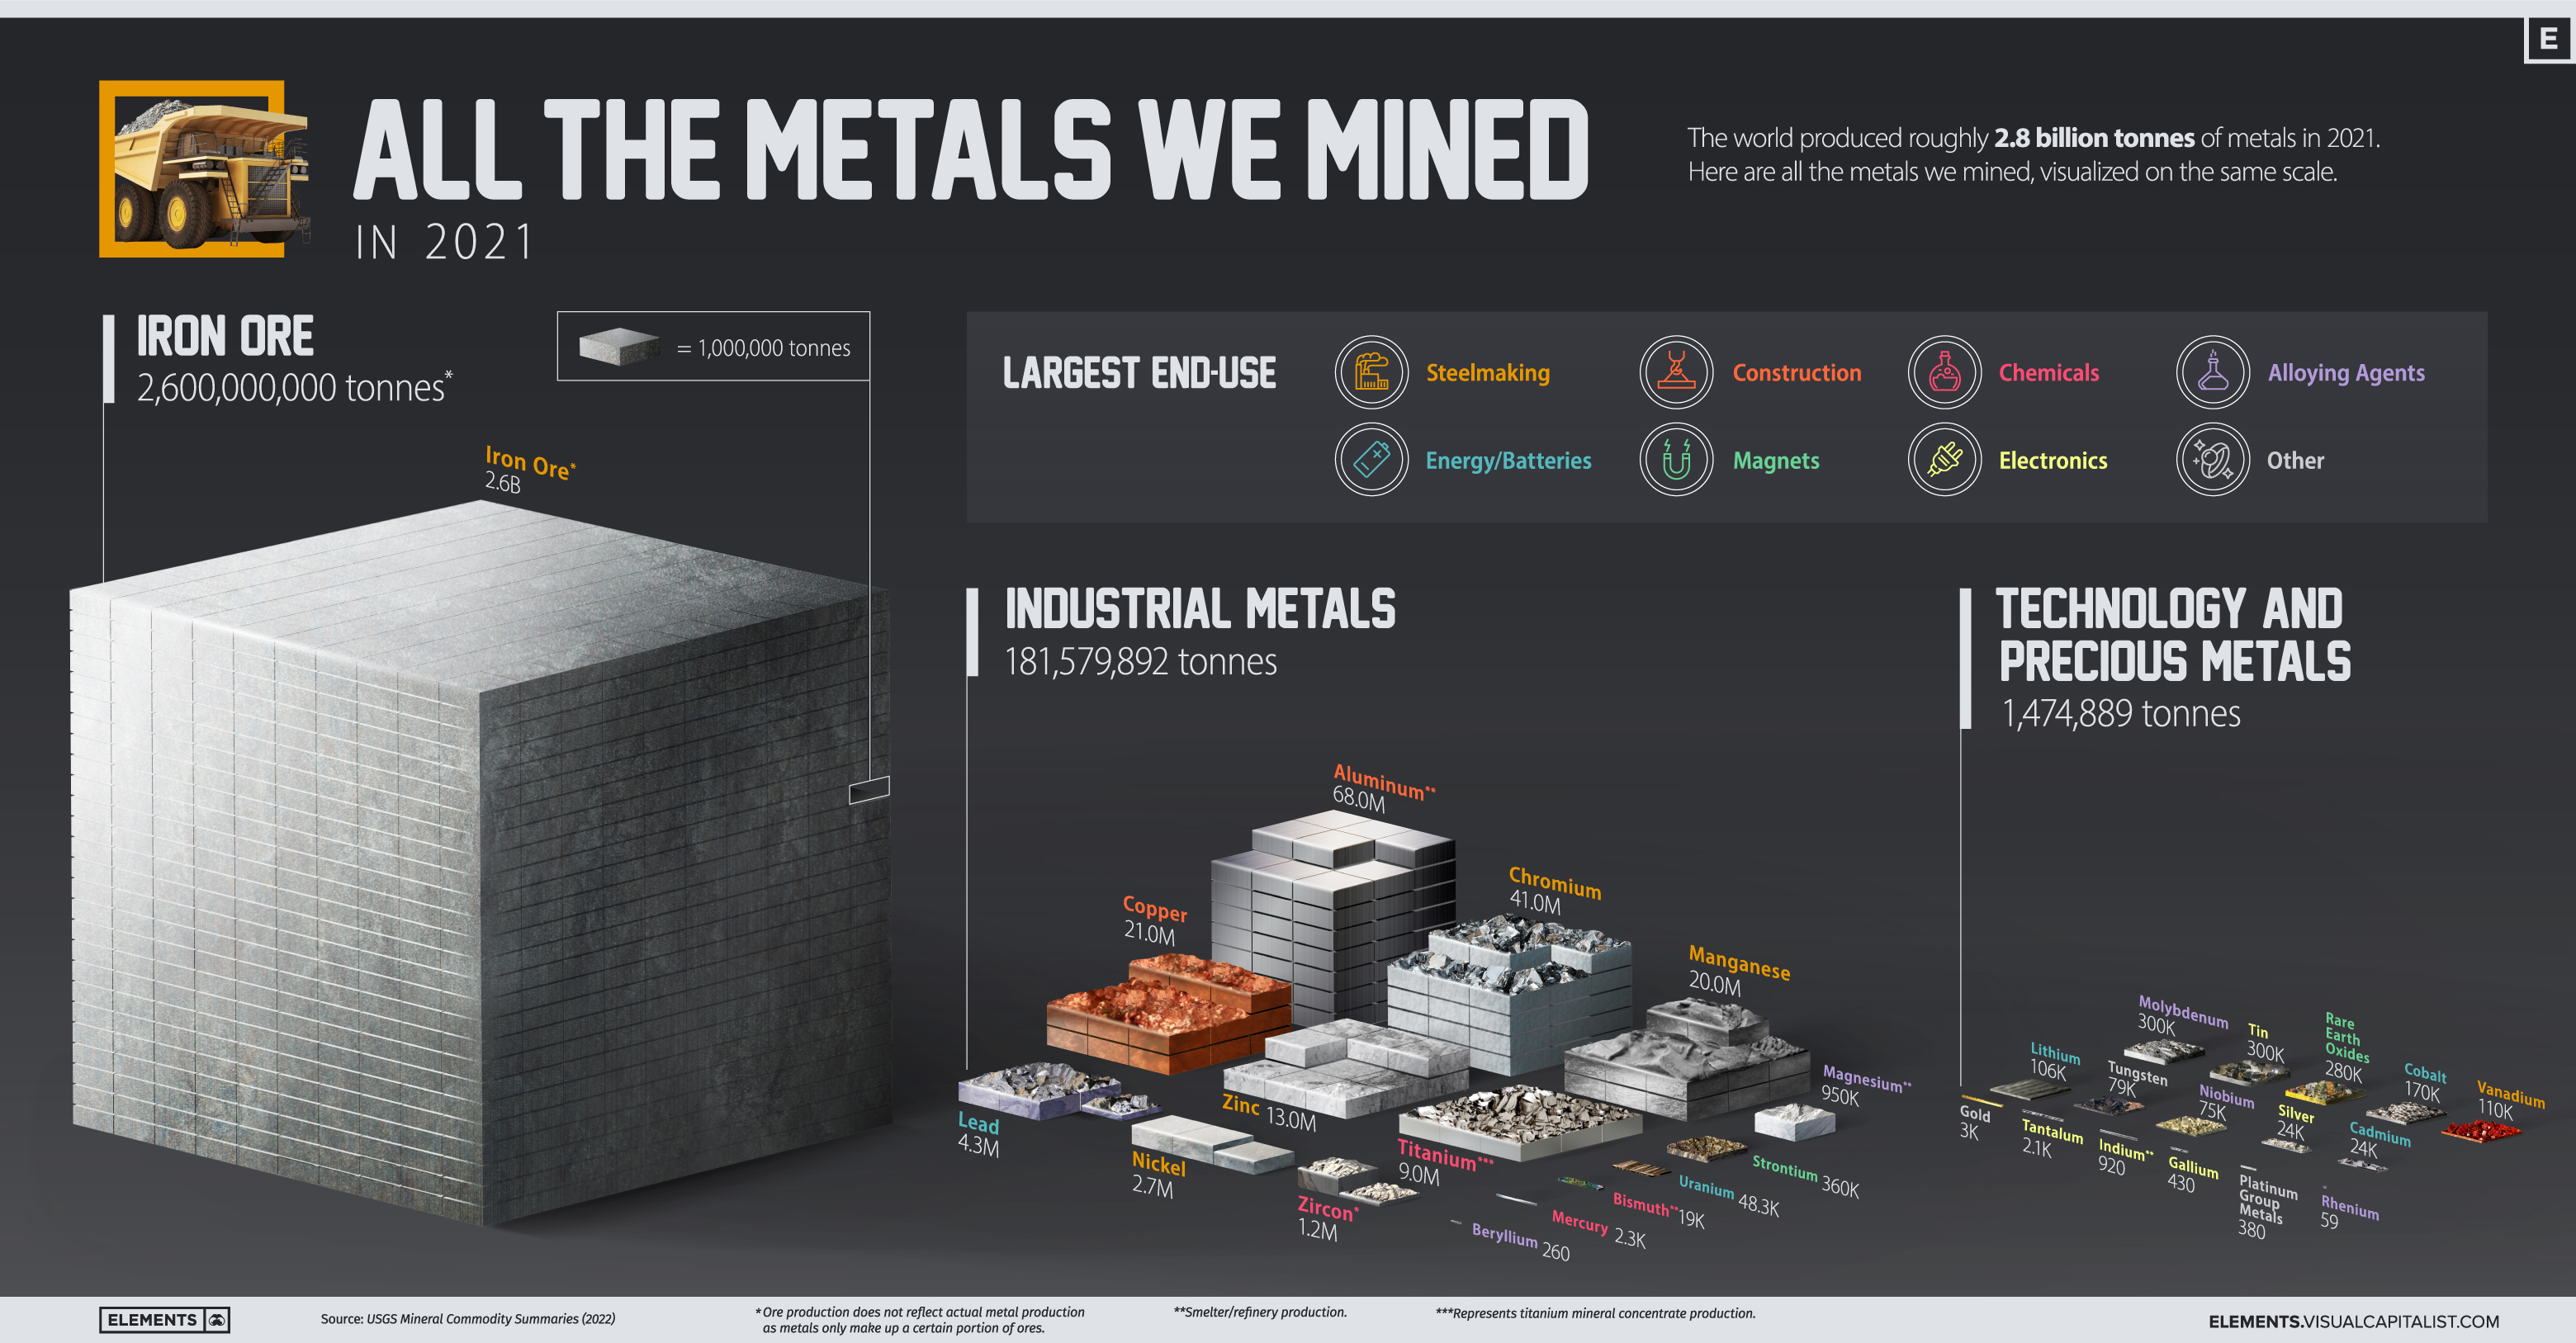
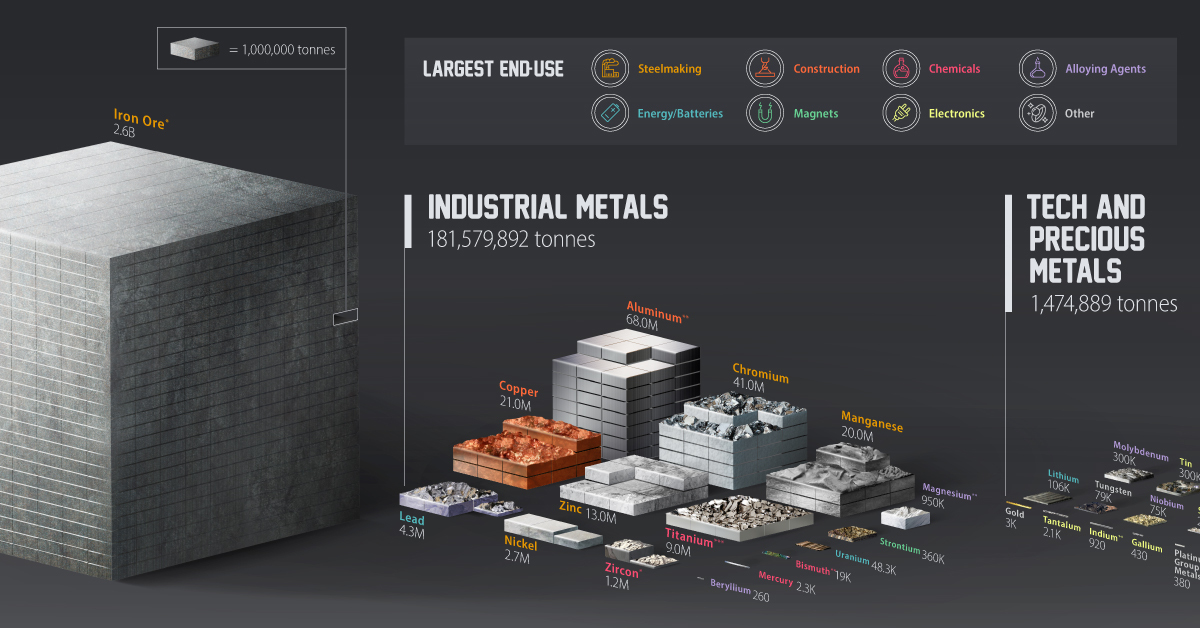
The above infographic visualizes all 2.8 billion tonnes of metals mined in 2021 and highlights each metal’s largest end-use using data from the United States Geological Survey (USGS).
Why Do We Mine So Much Iron Ore?
Iron ore accounted for 93% of the metals mined in 2021, with 2.6 billion tonnes extracted from the ground. It’s important to note that this is ore production, which is typically higher than metal production since metals are extracted and refined from ores. For example, the iron metal content of this ore is estimated at 1.6 billion tonnes.
| Metal/Ore | 2021 Mine Production (tonnes) | % of Total |
|---|---|---|
| Iron ore | 2,600,000,000 | 93.4% |
| Industrial metals | 181,579,892 | 6.5% |
| Technology and precious metals | 1,474,889 | 0.05% |
| Total | 2,783,054,781 | 100.0% |
With 98% of it converted into pig iron to make steel, iron ore is ubiquitous in our lives. Steel made from iron ore is used in construction, transportation, and household appliances, and it’s likely that you encounter something made out of it every day, especially if you live in a city.
Due to its key role in building infrastructure, iron ore is one of the most important materials supporting urbanization and economic growth.
Industrial Metals
Industrial metals are largely used in steelmaking, construction, chemical manufacturing, and as alloying agents. In 2021, the world mined over 181 million tonnes of these metals.
| Industrial Metals | 2021 Mine Production (tonnes) | % of Total |
|---|---|---|
| Aluminum* | 68,000,000 | 37.4% |
| Chromium | 41,000,000 | 22.6% |
| Copper | 21,000,000 | 11.6% |
| Manganese | 20,000,000 | 11.0% |
| Zinc | 13,000,000 | 7.2% |
| Titanium (mineral concentrates) | 9,000,000 | 5.0% |
| Lead | 4,300,000 | 2.4% |
| Nickel | 2,700,000 | 1.5% |
| Zirconium Minerals (Zircon) | 1,200,000 | 0.7% |
| Magnesium* | 950,000 | 0.5% |
| Strontium | 360,000 | 0.2% |
| Uranium | 48,332 | 0.03% |
| Bismuth* | 19,000 | 0.01% |
| Mercury | 2,300 | 0.001% |
| Beryllium | 260 | 0.0001% |
| Total | 181,579,892 | 100.0% |
*Represents refinery/smelter production.
Aluminum accounted for nearly 40% of industrial metal production in 2021. China was by far the largest aluminum producer, making up more than half of global production. The construction industry uses roughly 25% of annually produced aluminum, with 23% going into transportation.
Chromium is a lesser-known metal with a key role in making stainless steel stainless. In fact, stainless steel is usually composed of 10% to 30% of chromium, enhancing its strength and corrosion resistance.
Copper, manganese, and zinc round out the top five industrial metals mined in 2021, each with its own unique properties and roles in the economy.
Technology and Precious Metals
Technology metals include those that are commonly used in technology and devices. Compared to industrial metals, these are usually mined on a smaller scale and could see faster consumption growth as the world adopts new technologies.
| Technology and Precious Metals | 2021 Mine Production (tonnes) | % of Total |
|---|---|---|
| Tin | 300,000 | 20.3% |
| Molybdenum | 300,000 | 20.3% |
| Rare Earth Oxides | 280,000 | 19.0% |
| Cobalt | 170,000 | 11.5% |
| Vanadium | 110,000 | 7.5% |
| Lithium | 106,000 | 7.2% |
| Tungsten | 79,000 | 5.4% |
| Niobium | 75,000 | 5.1% |
| Silver | 24,000 | 1.6% |
| Cadmium | 24,000 | 1.6% |
| Gold | 3,000 | 0.2% |
| Tantalum | 2,100 | 0.1% |
| Indium* | 920 | 0.1% |
| Gallium | 430 | 0.03% |
| Platinum Group Metals | 380 | 0.03% |
| Rhenium | 59 | 0.004% |
| Total | 1,474,889 | 100.0% |
*Represents refinery/smelter production.
The major use of rhenium, one of the rarest metals in terms of production, is in superalloys that are critical for engine turbine blades in aircraft and gas turbine engines. The petroleum industry uses it in rhenium-platinum catalysts to produce high-octane gasoline for vehicles.
In terms of growth, clean energy technology metals stand out. For example, lithium production has more than doubled since 2016 and is set to ride the boom in EV battery manufacturing. Over the same period, global rare earth production more than doubled, driven by the rising demand for magnets.
Indium is another interesting metal on this list. Most of it is used to make indium tin oxide, an important component of touchscreens, TV screens, and solar panels.
The Metal Mining Megatrend
The world’s material consumption has grown significantly over the last few decades, with growing economies and cities demanding more resources.
Global production of both iron ore and aluminum has more than tripled relative to the mid-1990s. Other metals, including copper and steel, have also seen significant consumption growth.
Today, economies are not only growing and urbanizing but also adopting mineral-intensive clean energy technologies, pointing towards further increases in metal production and consumption.


Copper
Brass Rods: The Secure Choice
This graphic shows why brass rods are the secure choice for precision-machined and forged parts.


Brass Rods: The Secure Choice
The unique combination of machinability and recyclability makes brass rods the secure choice for manufacturers seeking future-proof raw material solutions.
This infographic, from the Copper Development Association, shows three ways brass rods give manufacturers greater control and a license to grow in the competitive market for precision-machined and forged products.
Future-Proof Investments in New Machine Tools
A material’s machinability directly impacts machine throughput, which typically has the largest impact on machine shop profitability.
The high-speed machining capabilities of brass rods maximize machine tool performance, allowing manufacturers to run the material faster and longer without sacrificing tool life, chip formation, or surface quality.
The high machining efficiency of brass leads to reduced per-part costs, quicker return on investment (ROI) for new machine tools, and expanded production capacity for new projects.
Supply Security Through Closed Loop Recycling
Brass, like its parent element copper, can be infinitely recycled.
In 2022, brass- and wire-rod mills accounted for the majority of the 830,000 tonnes of copper recycled from scrap in the United States.
Given that scrap ratios for machined parts typically range from 60-70% by weight, producing mills benefit from a secure and steady supply of clean scrap returned directly from customers, which is recycled to create new brass rods.
The high residual value of brass scrap creates a strong recycling incentive. Scrap buy back programs give manufacturers greater control over raw material net costs as scrap value is often factored into supplier purchase agreements.
Next Generation Alloys for a Lead-Free Future
Increasingly stringent global regulations continue to pressure manufacturers to minimize the use of materials containing trace amounts of lead and other harmful impurities.
The latest generation of brass-rod alloys is engineered to meet the most demanding criteria for lead leaching in drinking water and other sensitive applications.
Seven brass-rod alloys passed rigorous testing to become the only ‘Acceptable Materials’ against lower lead leaching criteria recently adopted in the national U.S. drinking water quality standard, NSF 61.
Learn more about the advantages of brass rods solutions.

-

 Mining1 year ago
Ranked: The World’s Largest Copper Producers
Many new technologies critical to the energy transition rely on copper. Here are the world’s largest copper producers.
-

 Mining2 years ago
Mapped: Solar Power by Country in 2021
In 2020, solar power saw its largest-ever annual capacity expansion at 127 gigawatts. Here’s a snapshot of solar power capacity by country.
-

 Energy5 years ago
Visualizing Copper’s Role in the Transition to Clean Energy
A clean energy transition is underway as wind, solar, and batteries take center stage. Here’s how copper plays the critical role in these technologies.
-

 Mining5 years ago
Everything You Need to Know on VMS Deposits
Deep below the ocean’s waves, VMS deposits spew out massive amounts of minerals like copper, zinc, and gold, making them a key source of the metals…
-
 Copper5 years ago
How Much Copper is in an Electric Vehicle?
Have you ever wondered how much copper is in an electric vehicle? This infographic shows the metal’s properties as well as the quantity of copper used.
-
 Mining6 years ago
Copper: Driving the Green Energy Revolution
Renewable energy is set to fuel a new era of copper demand – here’s how much copper is used in green applications from EVs to photovoltaics.

-

 Real Estate2 weeks ago
Visualizing America’s Shortage of Affordable Homes
-

 Technology1 week ago
Ranked: Semiconductor Companies by Industry Revenue Share
-

 Money1 week ago
Which States Have the Highest Minimum Wage in America?
-

 Real Estate1 week ago
Ranked: The Most Valuable Housing Markets in America
-

 Business2 weeks ago
Charted: Big Four Market Share by S&P 500 Audits
-

 AI2 weeks ago
The Stock Performance of U.S. Chipmakers So Far in 2024
-

 Misc2 weeks ago
Almost Every EV Stock is Down After Q1 2024
-

 Money2 weeks ago
Where Does One U.S. Tax Dollar Go?