Markets
All of the World’s Wealth in One Visualization
All of the World’s Wealth in One Visualization
The financial concept of wealth is broad, and it can take many forms.
While your wealth is most likely driven by the dollars in your bank account and the value of your stock portfolio and house, wealth also includes a number of smaller things as well, such as the old furniture in your garage or a painting on the wall.
From the macro perspective of a country, wealth is even more all-encompassing — it’s not just about the assets held by private households or businesses, but also those owned by the public. What is the value of a new toll bridge, or an aging nuclear power plant?
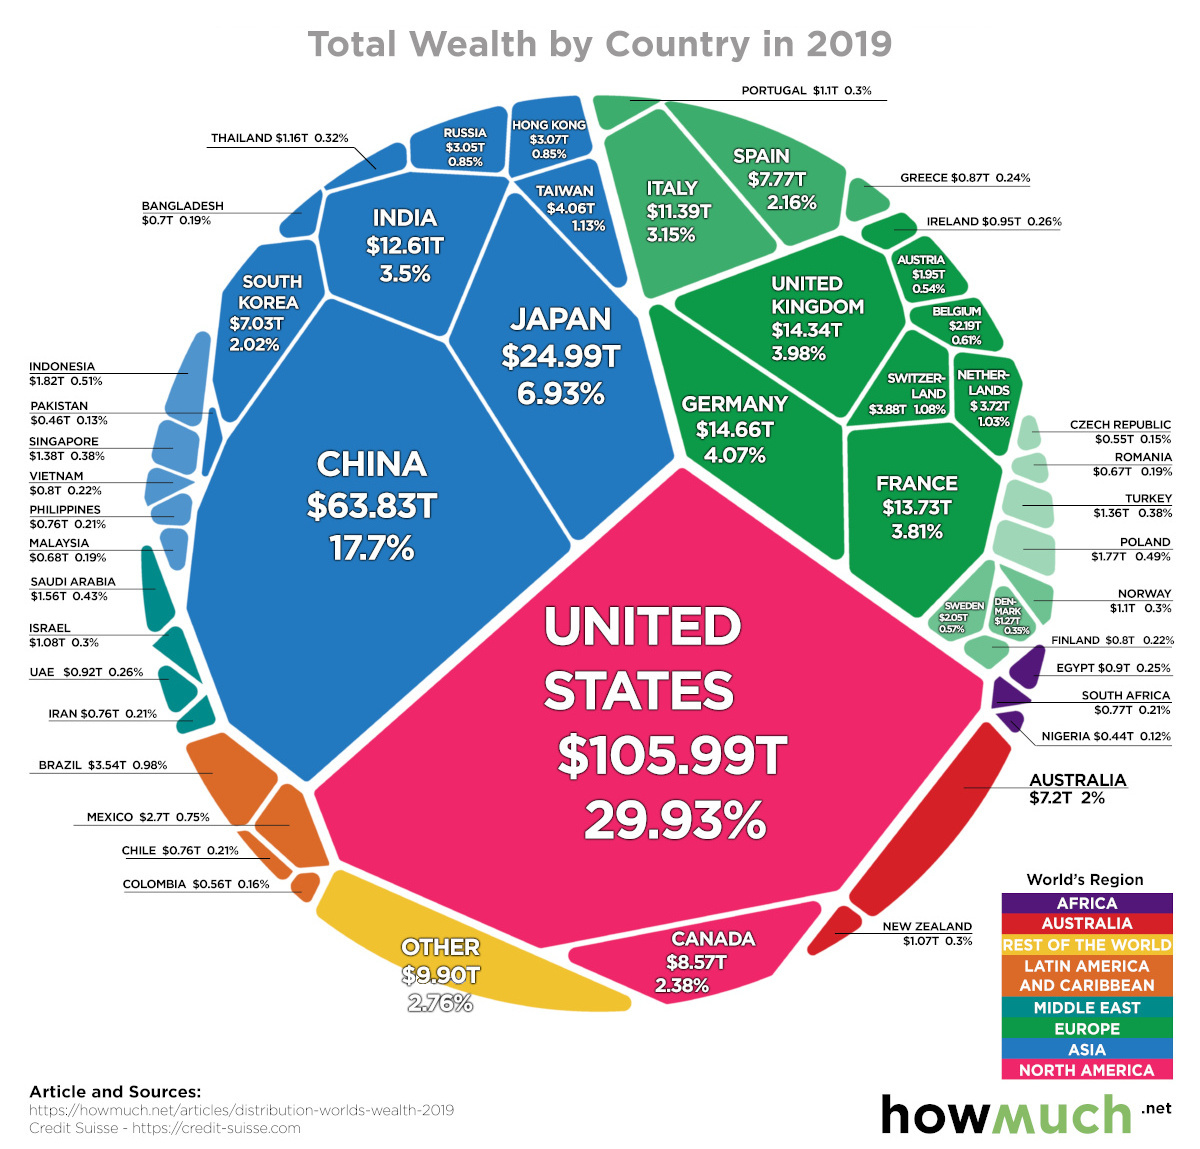
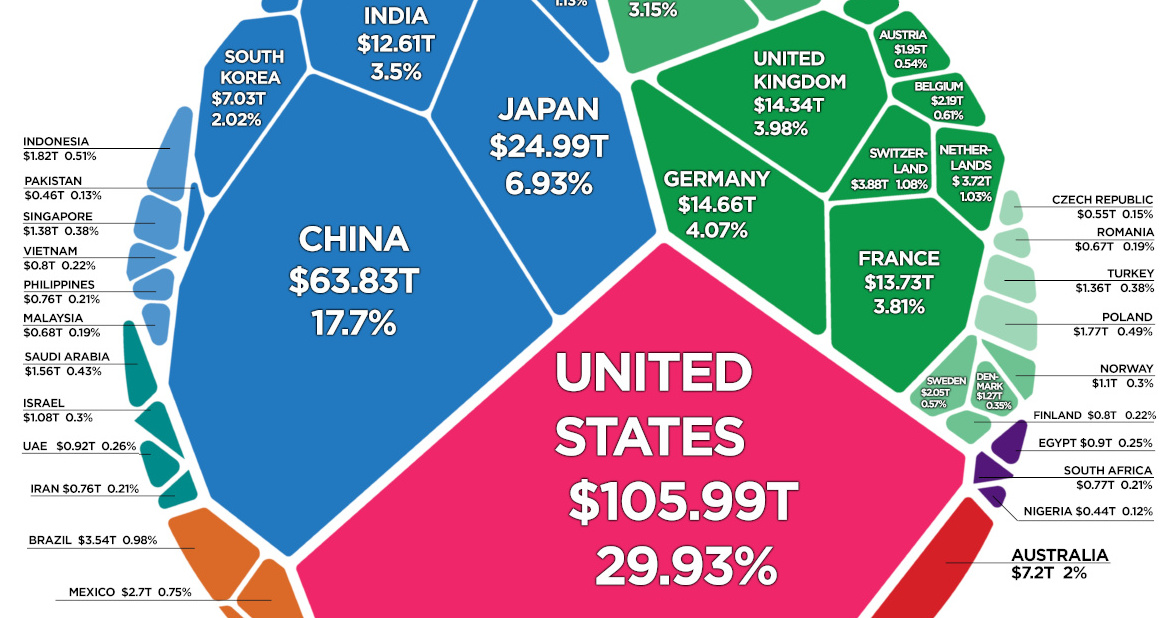
Today’s visualization comes to us from HowMuch.net, and it shows all of the world’s wealth in one place, sorted by country.
Total Wealth by Region
In 2019, total world wealth grew by $9.1 trillion to $360.6 trillion, which amounts to a 2.6% increase over the previous year.
Here’s how that divvies up between major global regions:
| Region | Total Wealth ($B, 2019) | % Global Share |
|---|---|---|
| North America | $114,607 | 31.8% |
| Europe | $90,752 | 25.2% |
| Asia-Pacific | $64,778 | 18.0% |
| China | $63,827 | 17.7% |
| India | $12,614 | 3.5% |
| Latin America | $9,906 | 2.7% |
| Africa | $4,119 | 1.1% |
| World | $360,603 | 100.0% |
Last year, growth in global wealth exceeded that of the population, incrementally increasing wealth per adult to $70,850, a 1.2% bump and an all-time high.
That said, it’s worth mentioning that Credit Suisse, the authors of the Global Wealth Report 2019 and the source of all this data, notes that the 1.2% increase has not been adjusted for inflation.
Ranking Countries by Total Wealth
Which countries are the richest?
Let’s take a look at the 15 countries that hold the most wealth, according to Credit Suisse:
| Rank | Country | Region | Total Wealth ($B, 2019) | % Global Share |
|---|---|---|---|---|
| #1 | 🇺🇸 United States | North America | $105,990 | 29.4% |
| #2 | 🇨🇳 China | China | $63,827 | 17.7% |
| #3 | 🇯🇵 Japan | Asia-Pacific | $24,992 | 6.9% |
| #4 | 🇩🇪 Germany | Europe | $14,660 | 4.1% |
| #5 | 🇬🇧 United Kingdom | Europe | $14,341 | 4.0% |
| #6 | 🇫🇷 France | Europe | $13,729 | 3.8% |
| #7 | 🇮🇳 India | India | $12,614 | 3.5% |
| #8 | 🇮🇹 Italy | Europe | $11,358 | 3.1% |
| #9 | 🇨🇦 Canada | North America | $8,573 | 2.4% |
| #10 | 🇪🇸 Spain | Europe | $7,772 | 2.2% |
| #11 | 🇰🇷 South Korea | Asia-Pacific | $7,302 | 2.0% |
| #12 | 🇦🇺 Australia | Asia-Pacific | $7,202 | 2.0% |
| #13 | 🇹🇼 Taiwan | Asia-Pacific | $4,062 | 1.1% |
| #14 | 🇨🇭 Switzerland | Europe | $3,877 | 1.1% |
| #15 | 🇳🇱 Netherlands | Europe | $3,719 | 1.0% |
| All Other Countries | $56,585 | 15.7% | ||
| Global Total | $360,603 | 100.0% |
The 15 wealthiest nations combine for 84.3% of global wealth.
Leading the pack is the United States, which holds $106.0 trillion of the world’s wealth — equal to a 29.4% share of the global total. Interestingly, the United States economy makes up 23.9% of the size of the world economy in comparison.
Behind the U.S. is China, the only other country with a double-digit share of global wealth, equal to 17.7% of wealth or $63.8 trillion. As the country continues to build out its middle class, one estimate sees Chinese private wealth increasing by 119.5% over the next decade.
Impressively, the combined wealth of the U.S. and China is more than the next 13 countries in aggregate — and almost equal to half of the global wealth total.


Markets
U.S. Debt Interest Payments Reach $1 Trillion
U.S. debt interest payments have surged past the $1 trillion dollar mark, amid high interest rates and an ever-expanding debt burden.


U.S. Debt Interest Payments Reach $1 Trillion
This was originally posted on our Voronoi app. Download the app for free on iOS or Android and discover incredible data-driven charts from a variety of trusted sources.
The cost of paying for America’s national debt crossed the $1 trillion dollar mark in 2023, driven by high interest rates and a record $34 trillion mountain of debt.
Over the last decade, U.S. debt interest payments have more than doubled amid vast government spending during the pandemic crisis. As debt payments continue to soar, the Congressional Budget Office (CBO) reported that debt servicing costs surpassed defense spending for the first time ever this year.
This graphic shows the sharp rise in U.S. debt payments, based on data from the Federal Reserve.
A $1 Trillion Interest Bill, and Growing
Below, we show how U.S. debt interest payments have risen at a faster pace than at another time in modern history:
| Date | Interest Payments | U.S. National Debt |
|---|---|---|
| 2023 | $1.0T | $34.0T |
| 2022 | $830B | $31.4T |
| 2021 | $612B | $29.6T |
| 2020 | $518B | $27.7T |
| 2019 | $564B | $23.2T |
| 2018 | $571B | $22.0T |
| 2017 | $493B | $20.5T |
| 2016 | $460B | $20.0T |
| 2015 | $435B | $18.9T |
| 2014 | $442B | $18.1T |
| 2013 | $425B | $17.2T |
| 2012 | $417B | $16.4T |
| 2011 | $433B | $15.2T |
| 2010 | $400B | $14.0T |
| 2009 | $354B | $12.3T |
| 2008 | $380B | $10.7T |
| 2007 | $414B | $9.2T |
| 2006 | $387B | $8.7T |
| 2005 | $355B | $8.2T |
| 2004 | $318B | $7.6T |
| 2003 | $294B | $7.0T |
| 2002 | $298B | $6.4T |
| 2001 | $318B | $5.9T |
| 2000 | $353B | $5.7T |
| 1999 | $353B | $5.8T |
| 1998 | $360B | $5.6T |
| 1997 | $368B | $5.5T |
| 1996 | $362B | $5.3T |
| 1995 | $357B | $5.0T |
| 1994 | $334B | $4.8T |
| 1993 | $311B | $4.5T |
| 1992 | $306B | $4.2T |
| 1991 | $308B | $3.8T |
| 1990 | $298B | $3.4T |
| 1989 | $275B | $3.0T |
| 1988 | $254B | $2.7T |
| 1987 | $240B | $2.4T |
| 1986 | $225B | $2.2T |
| 1985 | $219B | $1.9T |
| 1984 | $205B | $1.7T |
| 1983 | $176B | $1.4T |
| 1982 | $157B | $1.2T |
| 1981 | $142B | $1.0T |
| 1980 | $113B | $930.2B |
| 1979 | $96B | $845.1B |
| 1978 | $84B | $789.2B |
| 1977 | $69B | $718.9B |
| 1976 | $61B | $653.5B |
| 1975 | $55B | $576.6B |
| 1974 | $50B | $492.7B |
| 1973 | $45B | $469.1B |
| 1972 | $39B | $448.5B |
| 1971 | $36B | $424.1B |
| 1970 | $35B | $389.2B |
| 1969 | $30B | $368.2B |
| 1968 | $25B | $358.0B |
| 1967 | $23B | $344.7B |
| 1966 | $21B | $329.3B |
Interest payments represent seasonally adjusted annual rate at the end of Q4.
At current rates, the U.S. national debt is growing by a remarkable $1 trillion about every 100 days, equal to roughly $3.6 trillion per year.
As the national debt has ballooned, debt payments even exceeded Medicaid outlays in 2023—one of the government’s largest expenditures. On average, the U.S. spent more than $2 billion per day on interest costs last year. Going further, the U.S. government is projected to spend a historic $12.4 trillion on interest payments over the next decade, averaging about $37,100 per American.
Exacerbating matters is that the U.S. is running a steep deficit, which stood at $1.1 trillion for the first six months of fiscal 2024. This has accelerated due to the 43% increase in debt servicing costs along with a $31 billion dollar increase in defense spending from a year earlier. Additionally, a $30 billion increase in funding for the Federal Deposit Insurance Corporation in light of the regional banking crisis last year was a major contributor to the deficit increase.
Overall, the CBO forecasts that roughly 75% of the federal deficit’s increase will be due to interest costs by 2034.

-

 Real Estate2 weeks ago
Visualizing America’s Shortage of Affordable Homes
-

 Technology1 week ago
Ranked: Semiconductor Companies by Industry Revenue Share
-

 Money1 week ago
Which States Have the Highest Minimum Wage in America?
-

 Real Estate1 week ago
Ranked: The Most Valuable Housing Markets in America
-

 Business2 weeks ago
Charted: Big Four Market Share by S&P 500 Audits
-

 AI2 weeks ago
The Stock Performance of U.S. Chipmakers So Far in 2024
-

 Misc2 weeks ago
Almost Every EV Stock is Down After Q1 2024
-

 Money2 weeks ago
Where Does One U.S. Tax Dollar Go?