Markets
All of the World’s Stock Exchanges by Size
All of the World’s Stock Exchanges by Size
The Money Project is an ongoing collaboration between Visual Capitalist and Texas Precious Metals that seeks to use intuitive visualizations to explore the origins, nature, and use of money.
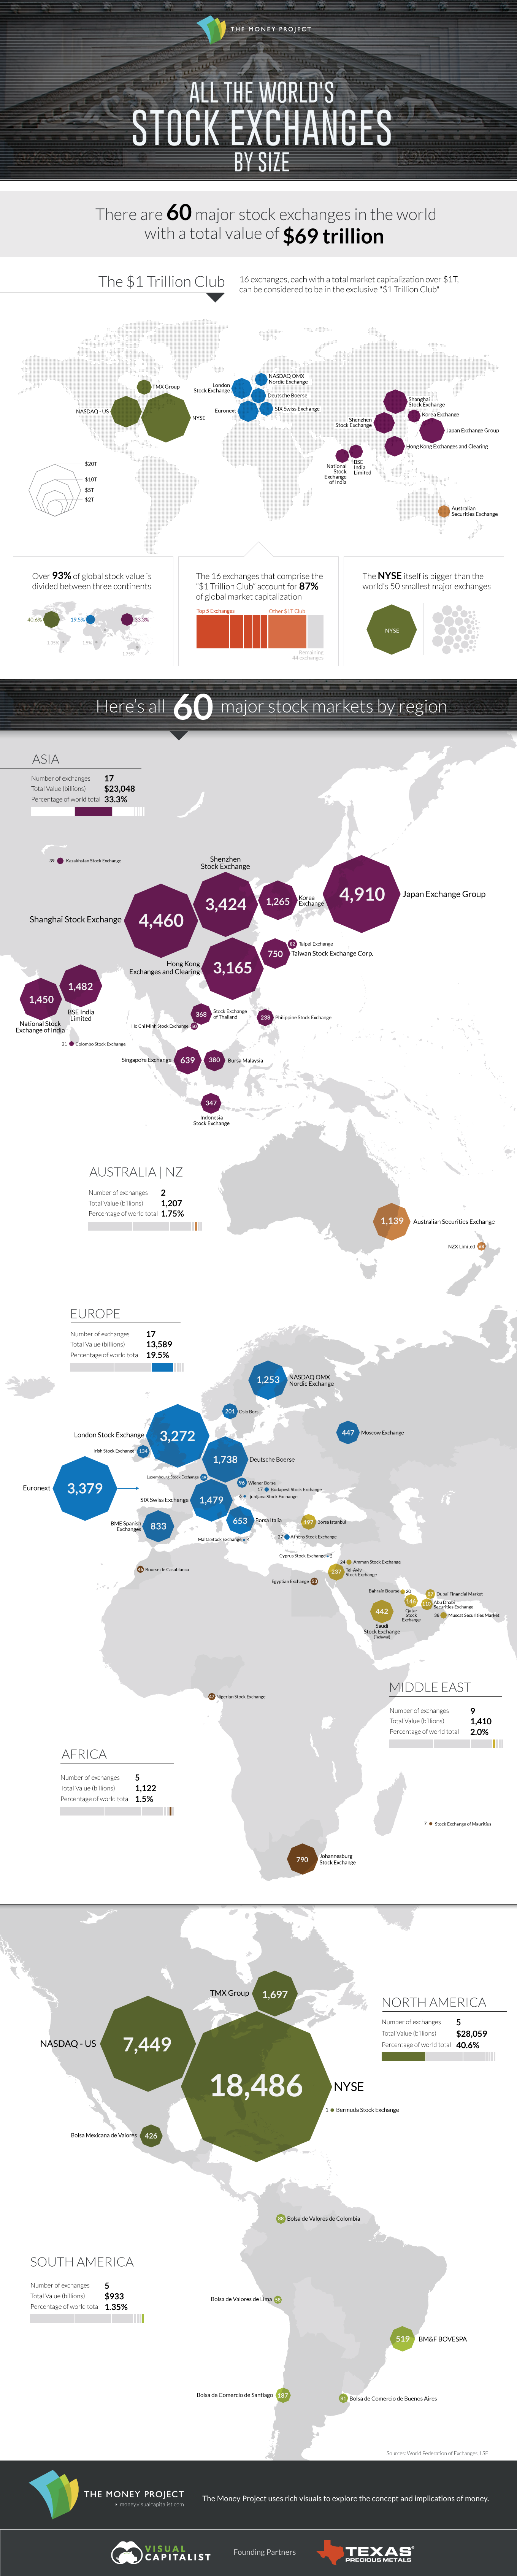
There are 60 major stock exchanges throughout the world, and their range of sizes is quite surprising.
At the high end of the spectrum is the mighty NYSE, representing $18.5 trillion in market capitalization, or about 27% of the total market for global equities.
At the lower end? Stock exchanges on the tiny islands of Malta, Cyprus, and Bermuda all range from just $1 billion to $4 billion in value. Even added together, these three exchanges make up just 0.01% of total market capitalization.
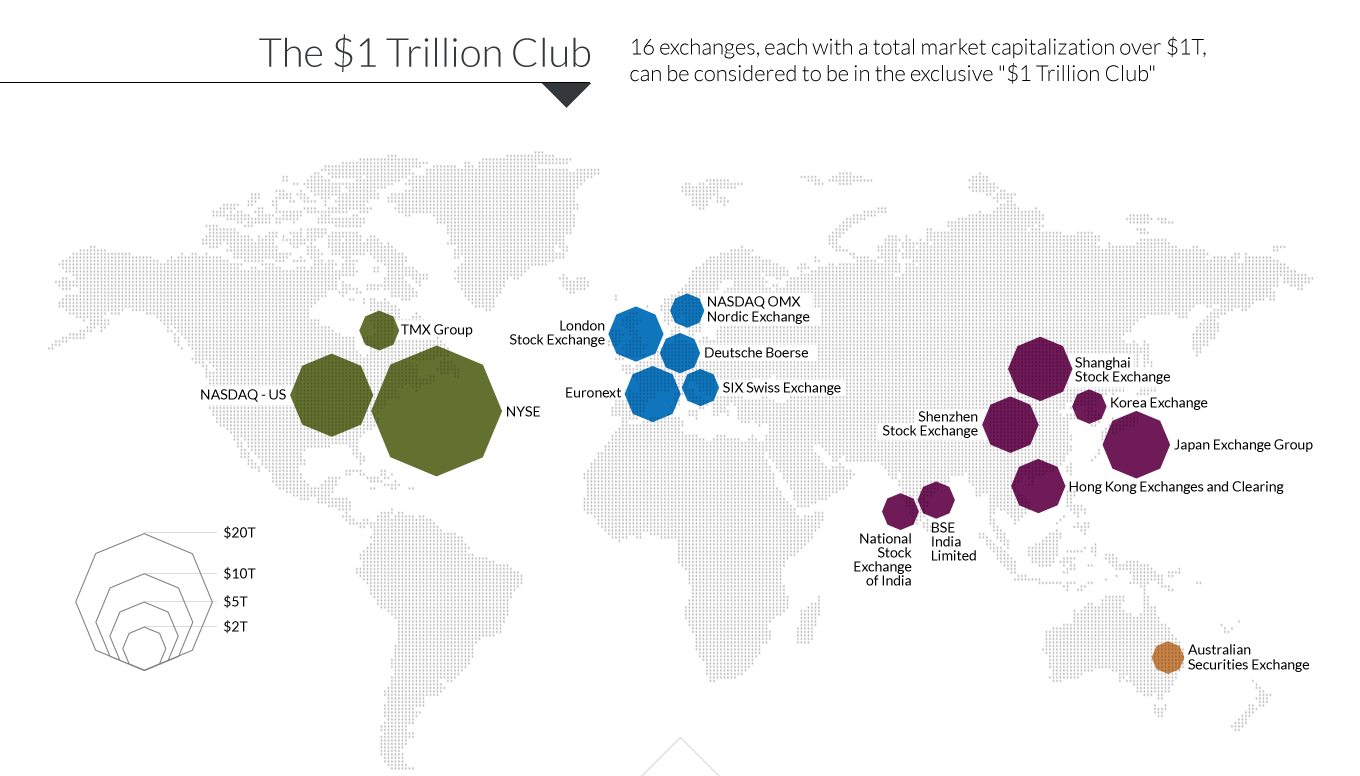
The Trillion Dollar Club
There are 16 exchanges that are a part of the “$1 Trillion Dollar Club” with more than $1 trillion in market capitalization. This elite group, with familiar names such as the NYSE, Nasdaq, LSE, Deutsche Borse, TMX Group, and Japan Exchange Group, comprise 87% of the world’s total value of equities.
Added together, the 44 names outside of this aforementioned group combine for just $9 trillion, or 13%, of the world’s total market capitalization.
Northern Dominance
From a geographical perspective, it is the Northern Hemisphere that is dominant. North America and Europe both hold 40.6% and 19.5% respectively of the world’s markets, and the vast majority of Asia’s 33.3% lies north of the equator in places like Shenzhen, Hong Kong, Tokyo, and Shanghai.
Notable exchanges that are south of the equator include the Australian Securities Exchange, the Indonesia Stock Exchange, the Johannesburg Stock Exchange and the Brazilian BM&F Bovespa.
Notes on Data
Our information in this data visualization comes from the World Federation of Exchanges monthly report from November 2015. It is also worth noting that the London Stock Exchange (and its subsidiary Italian exchange) announced that it was leaving the WFE in 2013. Therefore, we retrieved the data on the LSE and the Borsa Italia from their website market reports, and converted the local currencies into USD.
About the Money Project
The Money Project aims to use intuitive visualizations to explore ideas around the very concept of money itself. Founded in 2015 by Visual Capitalist and Texas Precious Metals, the Money Project will look at the evolving nature of money, and will try to answer the difficult questions that prevent us from truly understanding the role that money plays in finance, investments, and accumulating wealth.


Markets
U.S. Debt Interest Payments Reach $1 Trillion
U.S. debt interest payments have surged past the $1 trillion dollar mark, amid high interest rates and an ever-expanding debt burden.


U.S. Debt Interest Payments Reach $1 Trillion
This was originally posted on our Voronoi app. Download the app for free on iOS or Android and discover incredible data-driven charts from a variety of trusted sources.
The cost of paying for America’s national debt crossed the $1 trillion dollar mark in 2023, driven by high interest rates and a record $34 trillion mountain of debt.
Over the last decade, U.S. debt interest payments have more than doubled amid vast government spending during the pandemic crisis. As debt payments continue to soar, the Congressional Budget Office (CBO) reported that debt servicing costs surpassed defense spending for the first time ever this year.
This graphic shows the sharp rise in U.S. debt payments, based on data from the Federal Reserve.
A $1 Trillion Interest Bill, and Growing
Below, we show how U.S. debt interest payments have risen at a faster pace than at another time in modern history:
| Date | Interest Payments | U.S. National Debt |
|---|---|---|
| 2023 | $1.0T | $34.0T |
| 2022 | $830B | $31.4T |
| 2021 | $612B | $29.6T |
| 2020 | $518B | $27.7T |
| 2019 | $564B | $23.2T |
| 2018 | $571B | $22.0T |
| 2017 | $493B | $20.5T |
| 2016 | $460B | $20.0T |
| 2015 | $435B | $18.9T |
| 2014 | $442B | $18.1T |
| 2013 | $425B | $17.2T |
| 2012 | $417B | $16.4T |
| 2011 | $433B | $15.2T |
| 2010 | $400B | $14.0T |
| 2009 | $354B | $12.3T |
| 2008 | $380B | $10.7T |
| 2007 | $414B | $9.2T |
| 2006 | $387B | $8.7T |
| 2005 | $355B | $8.2T |
| 2004 | $318B | $7.6T |
| 2003 | $294B | $7.0T |
| 2002 | $298B | $6.4T |
| 2001 | $318B | $5.9T |
| 2000 | $353B | $5.7T |
| 1999 | $353B | $5.8T |
| 1998 | $360B | $5.6T |
| 1997 | $368B | $5.5T |
| 1996 | $362B | $5.3T |
| 1995 | $357B | $5.0T |
| 1994 | $334B | $4.8T |
| 1993 | $311B | $4.5T |
| 1992 | $306B | $4.2T |
| 1991 | $308B | $3.8T |
| 1990 | $298B | $3.4T |
| 1989 | $275B | $3.0T |
| 1988 | $254B | $2.7T |
| 1987 | $240B | $2.4T |
| 1986 | $225B | $2.2T |
| 1985 | $219B | $1.9T |
| 1984 | $205B | $1.7T |
| 1983 | $176B | $1.4T |
| 1982 | $157B | $1.2T |
| 1981 | $142B | $1.0T |
| 1980 | $113B | $930.2B |
| 1979 | $96B | $845.1B |
| 1978 | $84B | $789.2B |
| 1977 | $69B | $718.9B |
| 1976 | $61B | $653.5B |
| 1975 | $55B | $576.6B |
| 1974 | $50B | $492.7B |
| 1973 | $45B | $469.1B |
| 1972 | $39B | $448.5B |
| 1971 | $36B | $424.1B |
| 1970 | $35B | $389.2B |
| 1969 | $30B | $368.2B |
| 1968 | $25B | $358.0B |
| 1967 | $23B | $344.7B |
| 1966 | $21B | $329.3B |
Interest payments represent seasonally adjusted annual rate at the end of Q4.
At current rates, the U.S. national debt is growing by a remarkable $1 trillion about every 100 days, equal to roughly $3.6 trillion per year.
As the national debt has ballooned, debt payments even exceeded Medicaid outlays in 2023—one of the government’s largest expenditures. On average, the U.S. spent more than $2 billion per day on interest costs last year. Going further, the U.S. government is projected to spend a historic $12.4 trillion on interest payments over the next decade, averaging about $37,100 per American.
Exacerbating matters is that the U.S. is running a steep deficit, which stood at $1.1 trillion for the first six months of fiscal 2024. This has accelerated due to the 43% increase in debt servicing costs along with a $31 billion dollar increase in defense spending from a year earlier. Additionally, a $30 billion increase in funding for the Federal Deposit Insurance Corporation in light of the regional banking crisis last year was a major contributor to the deficit increase.
Overall, the CBO forecasts that roughly 75% of the federal deficit’s increase will be due to interest costs by 2034.

-

 Misc1 week ago
Airline Incidents: How Do Boeing and Airbus Compare?
-

 Real Estate2 weeks ago
Visualizing America’s Shortage of Affordable Homes
-

 Green2 weeks ago
Ranked: Top Countries by Total Forest Loss Since 2001
-

 Money2 weeks ago
Where Does One U.S. Tax Dollar Go?
-

 Misc2 weeks ago
Almost Every EV Stock is Down After Q1 2024
-

 AI2 weeks ago
The Stock Performance of U.S. Chipmakers So Far in 2024
-

 Business2 weeks ago
Charted: Big Four Market Share by S&P 500 Audits
-

 Real Estate2 weeks ago
Ranked: The Most Valuable Housing Markets in America