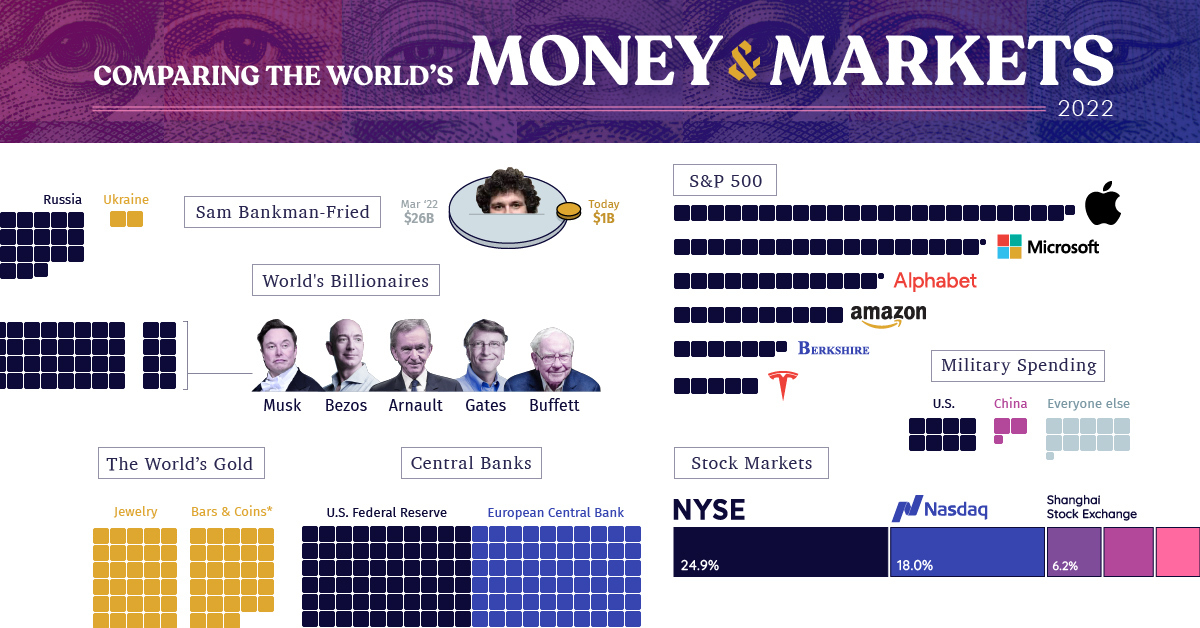
Markets
All of the World’s Money and Markets in One Visualization (2022)


All of the World’s Money and Markets in One Visualization
The era of easy money is now officially over.
For 15 years, policymakers have tried to stimulate the global economy through money creation, zero interest-rate policies, and more recently, aggressive COVID fiscal stimulus.
With capital at near-zero costs over this stretch, investors started to place more value on cash flows in the distant future. Assets inflated and balance sheets expanded, and money inevitably chased more speculative assets like NFTs, crypto, or unproven venture-backed startups.
But the free money party has since ended, after persistent inflation prompted the sudden reversal of many of these policies. And as Warren Buffett says, it’s only when the tide goes out do you get to see “who’s been swimming naked.”
Measuring Money and Markets in 2022
Every time we publish this visualization, our common unit of measurement is a two-dimensional box with a value of $100 billion.
Even though you need many of these to convey the assets on the balance sheet of the U.S. Federal Reserve, or the private wealth held by the world’s billionaires, it’s quite amazing to think what actually fits within this tiny building block of measurement:
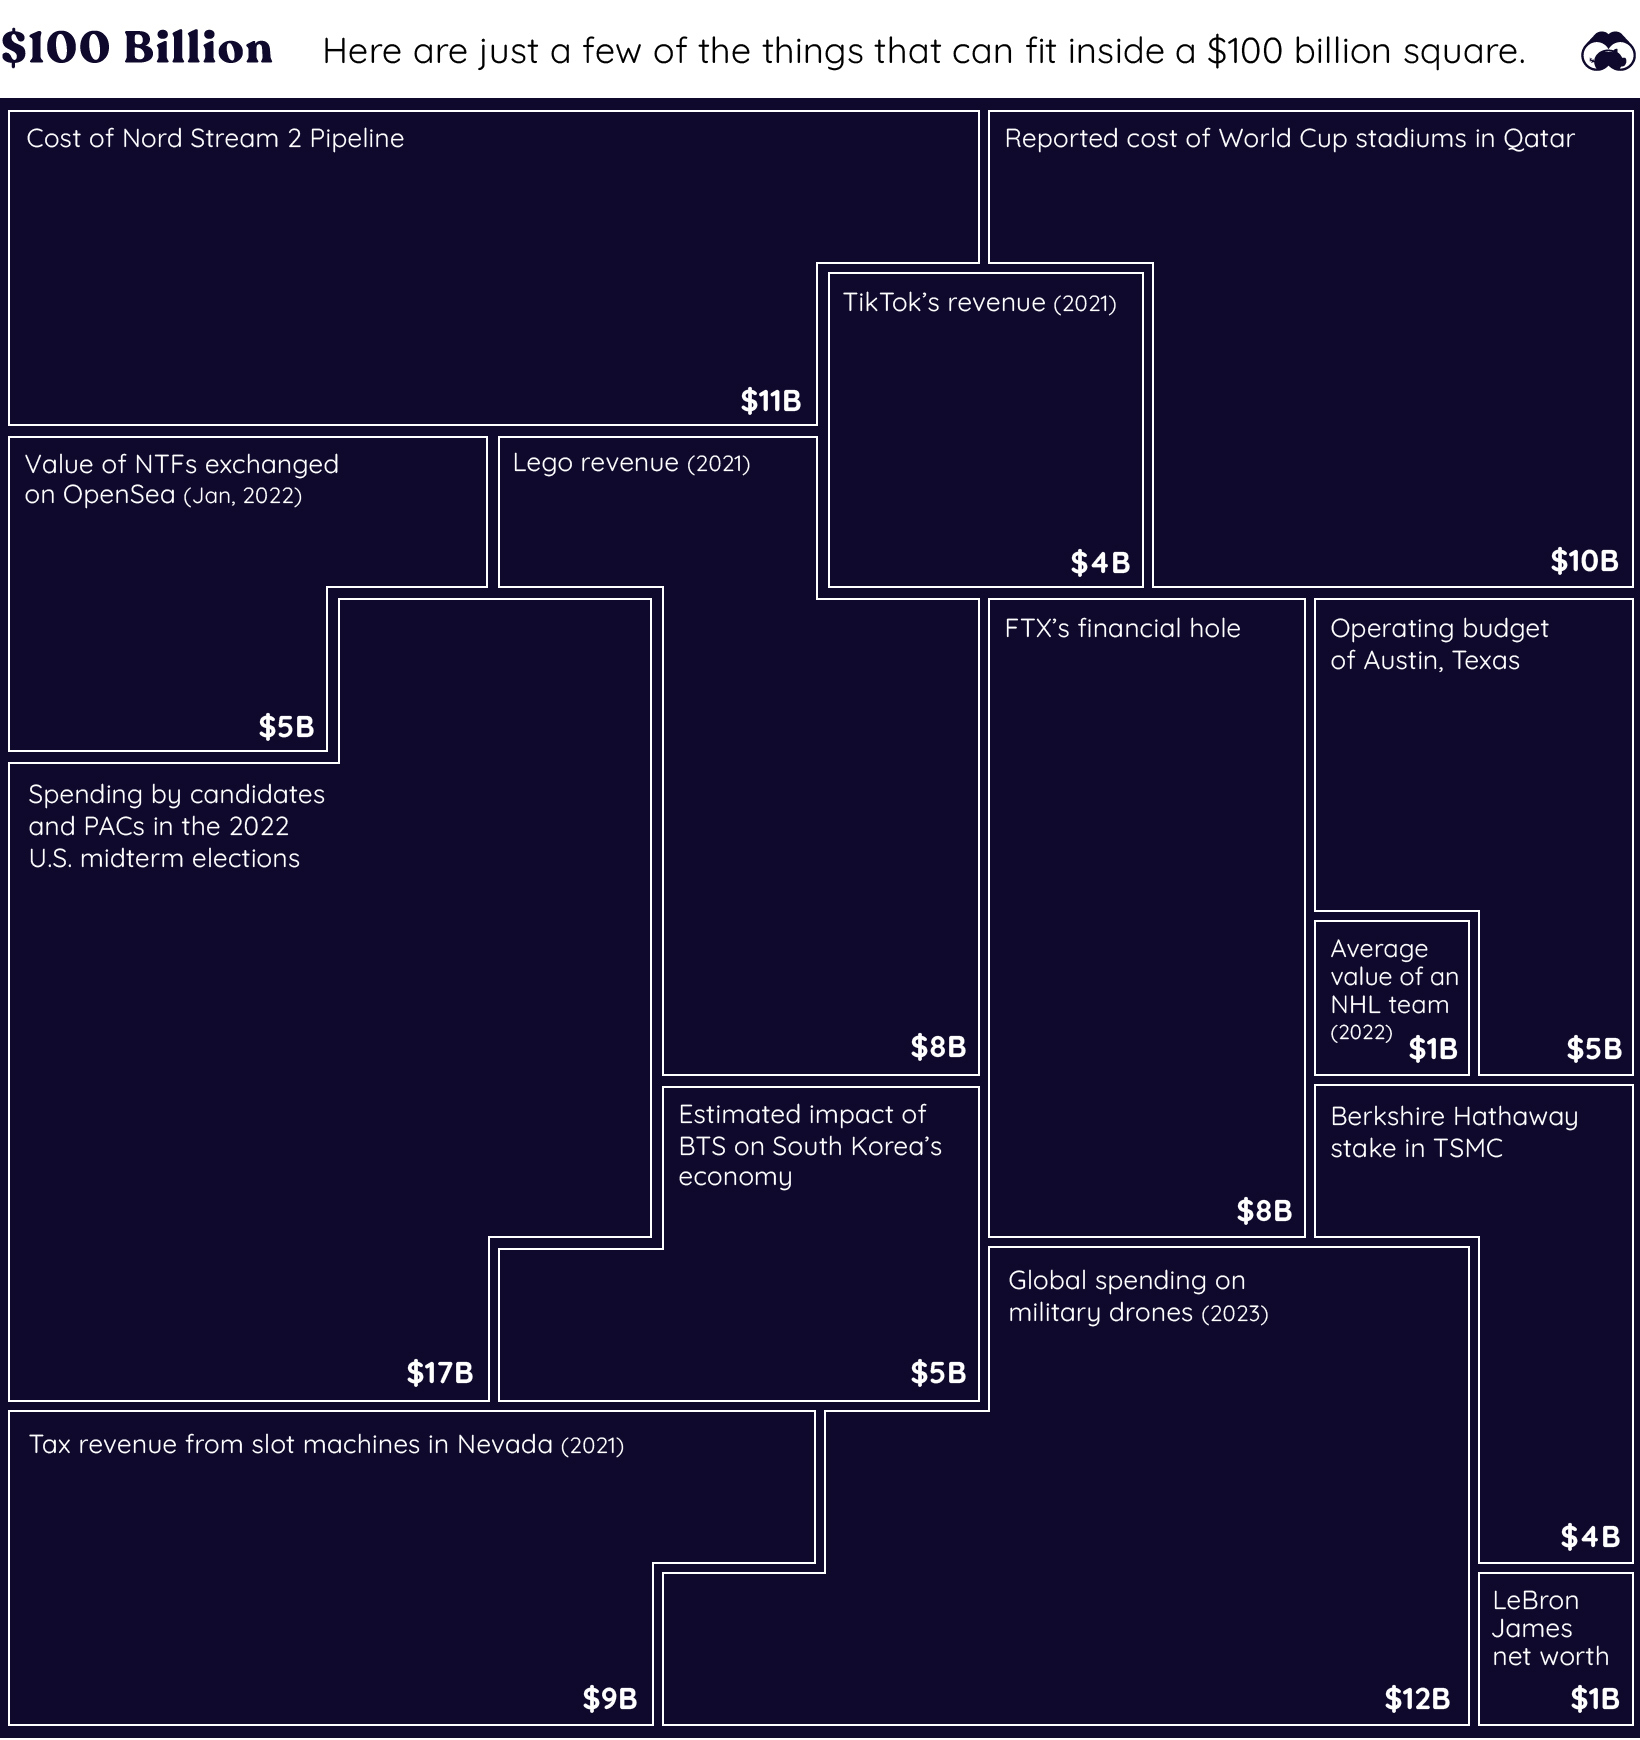
Our little unit of measurement is enough to pay for the construction of the Nord Stream 2 pipeline, while also buying every team in the NHL and digging FTX out of its financial hole several times over.
Here’s an overview of all the items we have listed in this year’s visualization:
| Asset category | Value | Source | Notes |
|---|---|---|---|
| SBF (Peak Net Worth) | $26 billion | Bloomberg | Now sits at <$1B |
| Pro Sports Teams | $340 billion | Forbes | Major pro teams in North America |
| Cryptocurrency | $760 billion | CoinMarketCap | Peaked at $2.8T in 2021 |
| Ukraine GDP | $130 billion | World Bank | Comparable to GDP of Mississippi |
| Russia GDP | $1.8 trillion | World Bank | The world's 11th largest economy |
| Annual Military Spending | $2.1 trillion | SIPRI | 2021 data |
| Physical currency | $8.0 trillion | BIS | 2020 data |
| Gold | $11.5 trillion | World Gold Council | There are 205,238 tonnes of gold in existence |
| Billionaires | $12.7 trillion | Forbes | Sum of fortunes of all 2,668 billionaires |
| Central Bank Assets | $28.0 trillion | Trading Economics | Fed, BoJ, Bank of China, and Eurozone only |
| S&P 500 | $36.0 trillion | Slickcharts | Nov 20, 2022 |
| China GDP | $17.7 trillion | World Bank | |
| U.S. GDP | $23.0 trillion | World Bank | |
| Narrow Money Supply | $49.0 trillion | Trading Economics | Includes US, China, Euro Area, Japan only |
| Broad Money Supply | $82.7 trillion | Trading Economics | Includes US, China, Euro Area, Japan only |
| Global Equities | $95.9 trillion | WFE | Latest available 2022 data |
| Global Debt | $300.1 trillion | IIF | Q2 2022 |
| Global Real Estate | $326.5 trillion | Savills | 2020 data |
| Global Private Wealth | $463.6 trillion | Credit Suisse | 2022 report |
| Derivatives (Market) | $12.4 trillion | BIS | |
| Derivatives (Notional) | $600 trillion | BIS |
Has the Dust Settled Yet?
Through previous editions of our All the World’s Money and Markets visualization, we’ve created snapshots of the world’s assets and markets at different points in time.
For example, in our 2017 edition of this visualization, Apple’s market capitalization was only $807 billion, and all crypto assets combined for $173 billion. The global debt total was at $215 trillion.
| Asset | 2017 edition | 2022 edition | Change (%) |
|---|---|---|---|
| Apple market cap | $807 billion | $2.3 trillion | +185% |
| Crypto | $173 billion | $760 billion | +339% |
| Fed Balance Sheet | $4.5 trillion | $8.7 trillion | +93% |
| Stock Markets | $73 trillion | $95.9 trillion | +31% |
| Global Debt | $215 trillion | $300 trillion | +40% |
And in just five years, Apple nearly quadrupled in size (it peaked at $3 trillion in January 2022), and crypto also expanded into a multi-trillion dollar market until it was brought back to Earth through the 2022 crash and subsequent FTX implosion.
Meanwhile, global debt continues to accumulate—growing by $85 trillion in the five-year period.
With interest rates expected to continue to rise, companies making cost cuts, and policymakers reining in spending and borrowing, today is another unique snapshot in time.
Now that the easy money era is over, where do things go from here?


Economy
Economic Growth Forecasts for G7 and BRICS Countries in 2024
The IMF has released its economic growth forecasts for 2024. How do the G7 and BRICS countries compare?


G7 & BRICS Real GDP Growth Forecasts for 2024
The International Monetary Fund’s (IMF) has released its real gross domestic product (GDP) growth forecasts for 2024, and while global growth is projected to stay steady at 3.2%, various major nations are seeing declining forecasts.
This chart visualizes the 2024 real GDP growth forecasts using data from the IMF’s 2024 World Economic Outlook for G7 and BRICS member nations along with Saudi Arabia, which is still considering an invitation to join the bloc.
Get the Key Insights of the IMF’s World Economic Outlook
Want a visual breakdown of the insights from the IMF’s 2024 World Economic Outlook report?
This visual is part of a special dispatch of the key takeaways exclusively for VC+ members.
Get the full dispatch of charts by signing up to VC+.
Mixed Economic Growth Prospects for Major Nations in 2024
Economic growth projections by the IMF for major nations are mixed, with the majority of G7 and BRICS countries forecasted to have slower growth in 2024 compared to 2023.
Only three BRICS-invited or member countries, Saudi Arabia, the UAE, and South Africa, have higher projected real GDP growth rates in 2024 than last year.
| Group | Country | Real GDP Growth (2023) | Real GDP Growth (2024P) |
|---|---|---|---|
| G7 | 🇺🇸 U.S. | 2.5% | 2.7% |
| G7 | 🇨🇦 Canada | 1.1% | 1.2% |
| G7 | 🇯🇵 Japan | 1.9% | 0.9% |
| G7 | 🇫🇷 France | 0.9% | 0.7% |
| G7 | 🇮🇹 Italy | 0.9% | 0.7% |
| G7 | 🇬🇧 UK | 0.1% | 0.5% |
| G7 | 🇩🇪 Germany | -0.3% | 0.2% |
| BRICS | 🇮🇳 India | 7.8% | 6.8% |
| BRICS | 🇨🇳 China | 5.2% | 4.6% |
| BRICS | 🇦🇪 UAE | 3.4% | 3.5% |
| BRICS | 🇮🇷 Iran | 4.7% | 3.3% |
| BRICS | 🇷🇺 Russia | 3.6% | 3.2% |
| BRICS | 🇪🇬 Egypt | 3.8% | 3.0% |
| BRICS-invited | 🇸🇦 Saudi Arabia | -0.8% | 2.6% |
| BRICS | 🇧🇷 Brazil | 2.9% | 2.2% |
| BRICS | 🇿🇦 South Africa | 0.6% | 0.9% |
| BRICS | 🇪🇹 Ethiopia | 7.2% | 6.2% |
| 🌍 World | 3.2% | 3.2% |
China and India are forecasted to maintain relatively high growth rates in 2024 at 4.6% and 6.8% respectively, but compared to the previous year, China is growing 0.6 percentage points slower while India is an entire percentage point slower.
On the other hand, four G7 nations are set to grow faster than last year, which includes Germany making its comeback from its negative real GDP growth of -0.3% in 2023.
Faster Growth for BRICS than G7 Nations
Despite mostly lower growth forecasts in 2024 compared to 2023, BRICS nations still have a significantly higher average growth forecast at 3.6% compared to the G7 average of 1%.
While the G7 countries’ combined GDP is around $15 trillion greater than the BRICS nations, with continued higher growth rates and the potential to add more members, BRICS looks likely to overtake the G7 in economic size within two decades.
BRICS Expansion Stutters Before October 2024 Summit
BRICS’ recent expansion has stuttered slightly, as Argentina’s newly-elected president Javier Milei declined its invitation and Saudi Arabia clarified that the country is still considering its invitation and has not joined BRICS yet.
Even with these initial growing pains, South Africa’s Foreign Minister Naledi Pandor told reporters in February that 34 different countries have submitted applications to join the growing BRICS bloc.
Any changes to the group are likely to be announced leading up to or at the 2024 BRICS summit which takes place October 22-24 in Kazan, Russia.
Get the Full Analysis of the IMF’s Outlook on VC+
This visual is part of an exclusive special dispatch for VC+ members which breaks down the key takeaways from the IMF’s 2024 World Economic Outlook.
For the full set of charts and analysis, sign up for VC+.

-

 Markets1 week ago
U.S. Debt Interest Payments Reach $1 Trillion
-

 Markets2 weeks ago
Charted: Big Four Market Share by S&P 500 Audits
-

 Markets2 weeks ago
Ranked: The Most Valuable Housing Markets in America
-

 Money2 weeks ago
Which States Have the Highest Minimum Wage in America?
-

 AI2 weeks ago
Ranked: Semiconductor Companies by Industry Revenue Share
-

 Markets2 weeks ago
Ranked: The World’s Top Flight Routes, by Revenue
-

 Countries2 weeks ago
Population Projections: The World’s 6 Largest Countries in 2075
-

 Markets2 weeks ago
The Top 10 States by Real GDP Growth in 2023