Misc
A Visual Guide to Human Emotion
A Visual Guide to Human Emotion
Despite vast differences in culture around the world, humanity’s DNA is 99.9% similar.
There are few attributes more central and universal to the human experience than our emotions. Of course, the broad spectrum of emotions we’re capable of experiencing can be difficult to articulate. That’s where this brilliant visualization by the Junto Institute comes in.
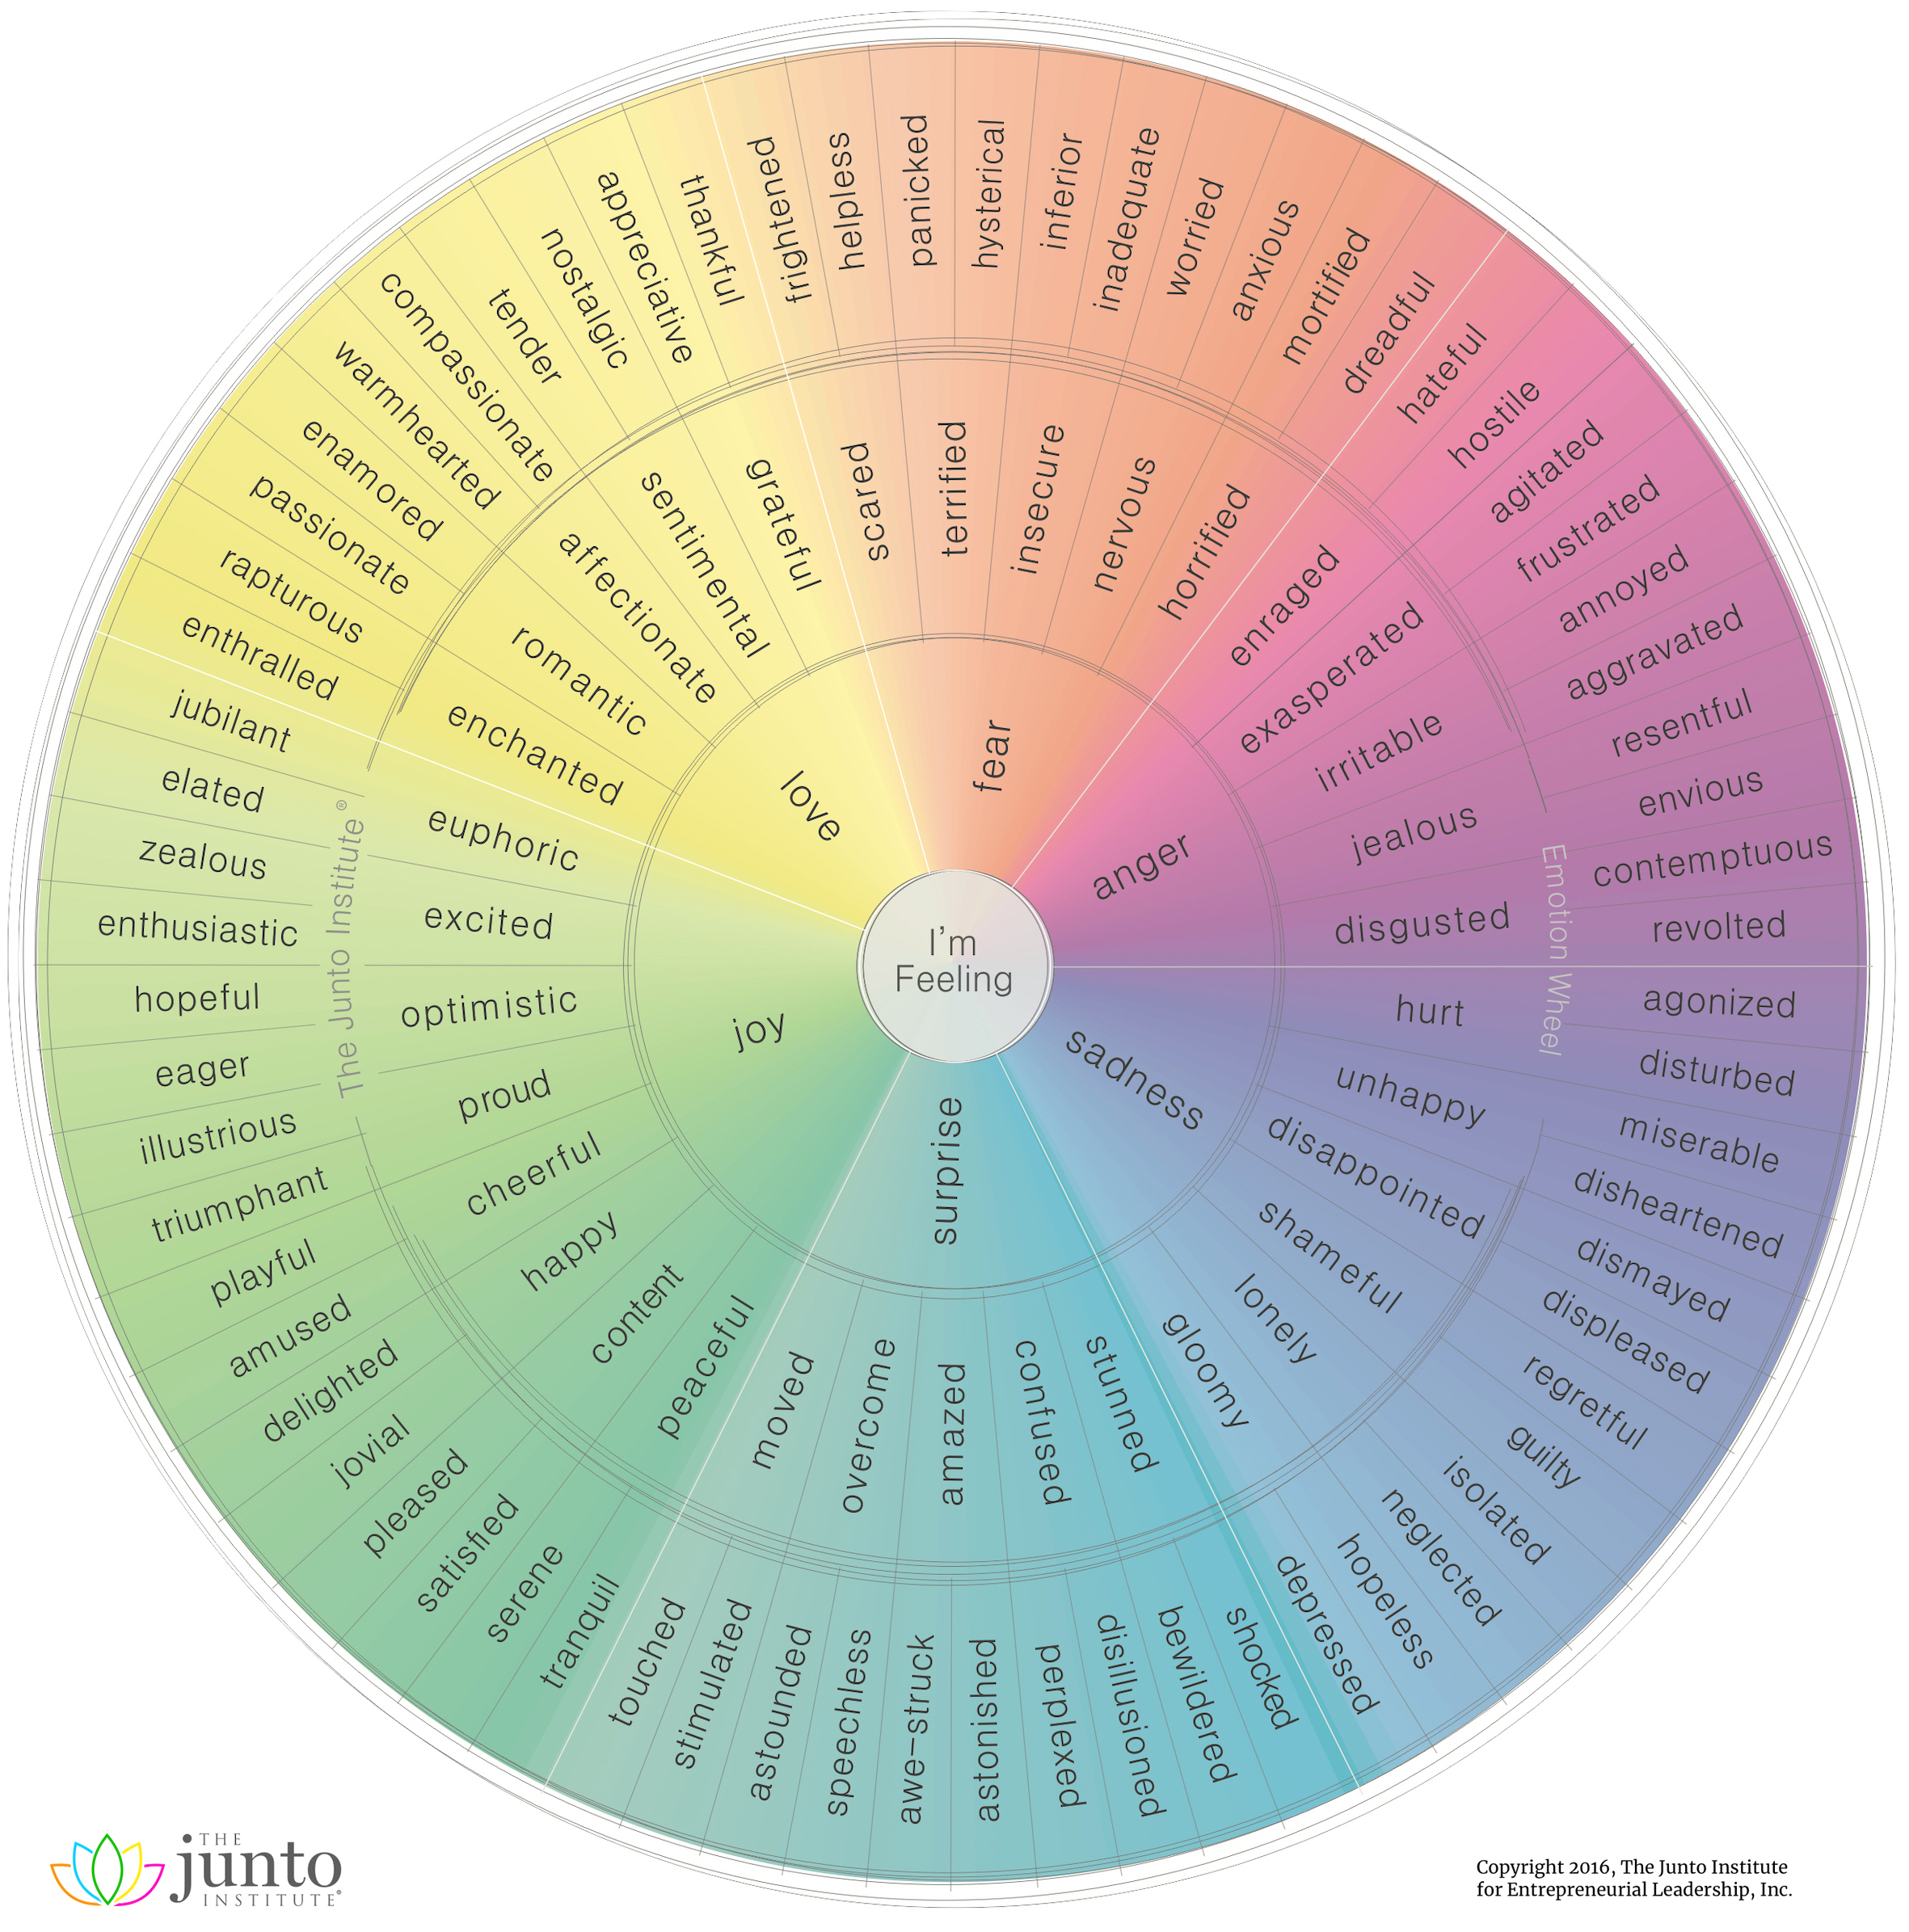
This circular visualization is the latest in an ongoing attempt to neatly categorize the full range of emotions in a logical way.
A Taxonomy of Human Emotion
Our understanding has come a long way since William James proposed four basic emotions – fear, grief, love, and rage—though these core emotions still form much of the foundation for current frameworks.
The wheel visualization above identifies six root emotions:
- Fear
- Anger
- Sadness
- Surprise
- Joy
- Love
From these six emotions, more nuanced descriptions emerge, such as jealousy as a subset of anger, and awe-struck as a subset of surprise. In total, there are 102 second- and third-order emotions listed on this emotion wheel.
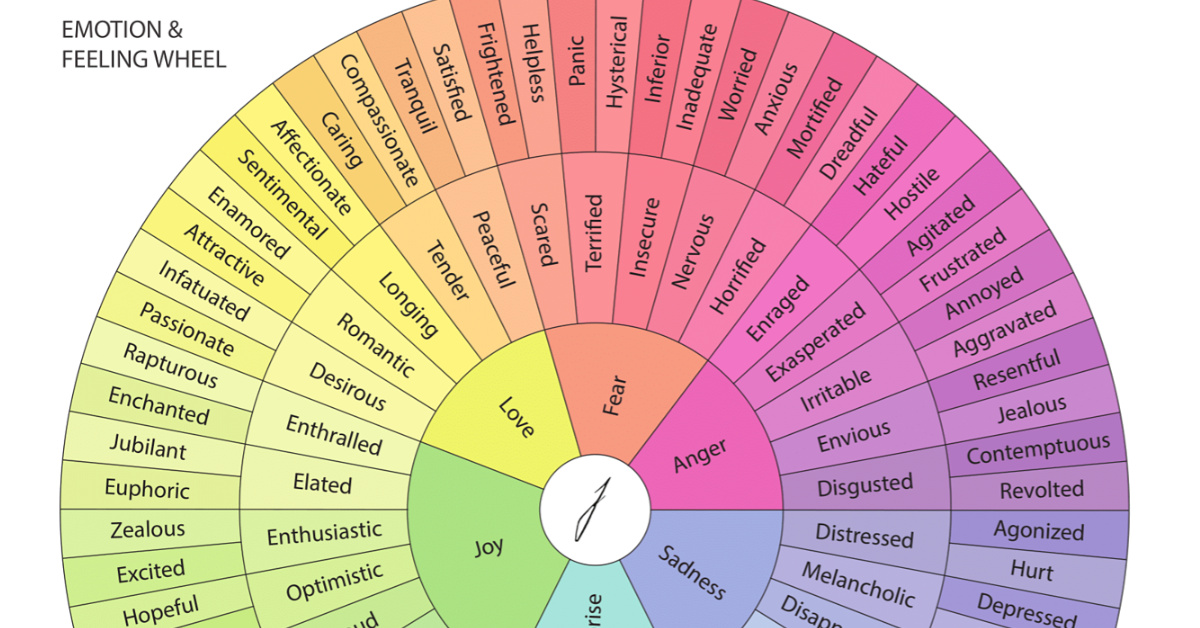
Reinventing the Feeling Wheel
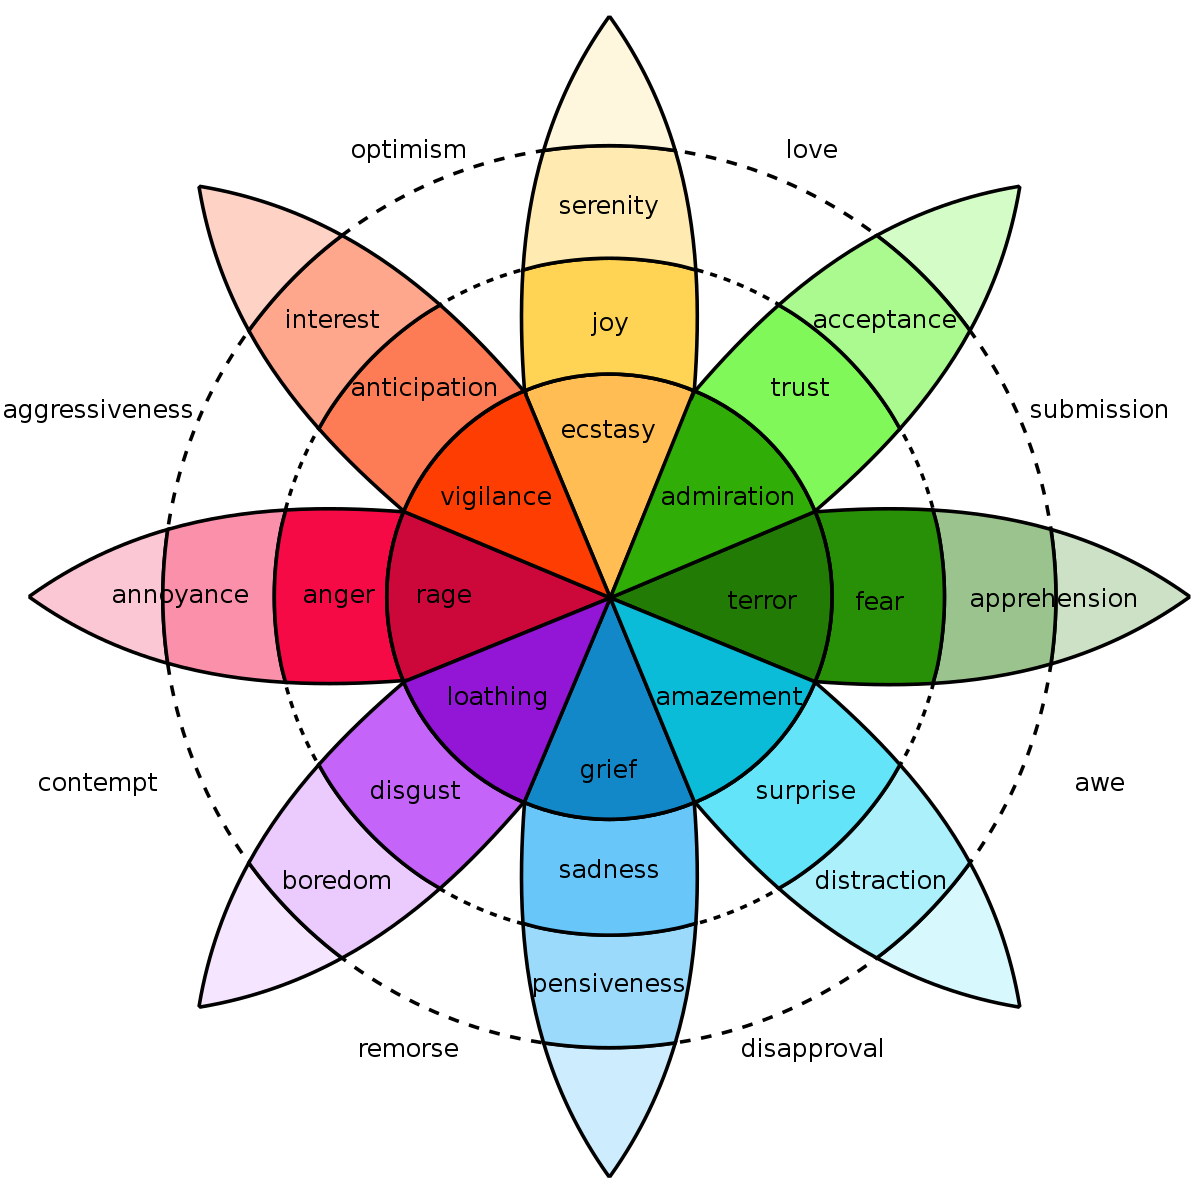
The concept of mapping the range of human emotions on a wheel picked up traction in the 1980s, and has evolved ever since.
One of these original concepts was developed by American psychologist Robert Plutchik, who mapped eight primary emotions—anger, fear, sadness, disgust, surprise, anticipation, trust, and joy. These “high survival value” emotions were believed to be the most useful in keeping our ancient ancestors alive.
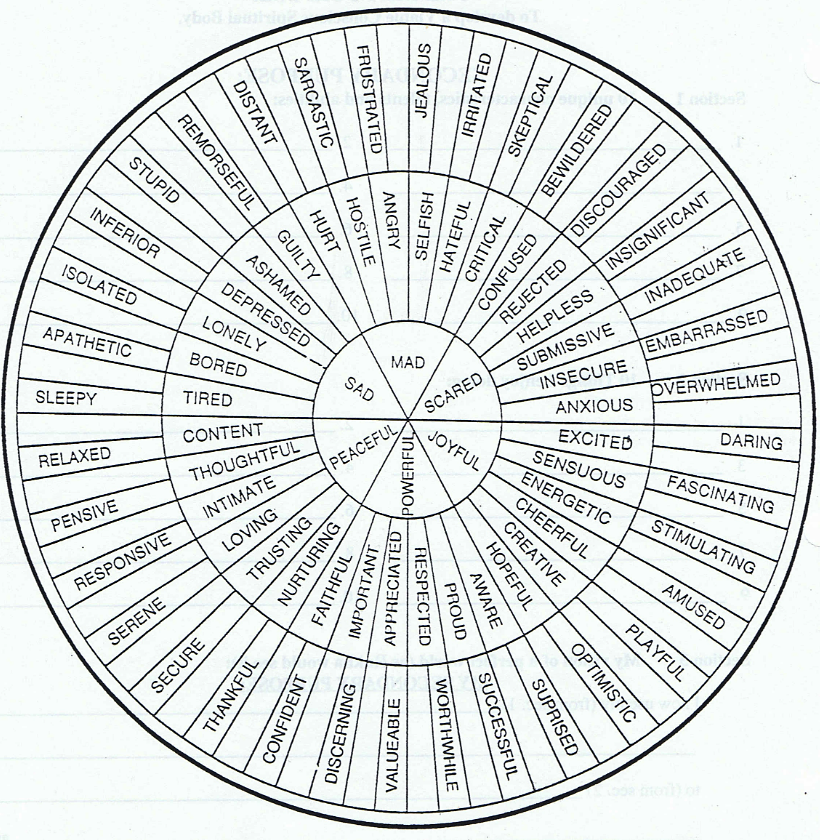
Another seminal graphic concept was developed by author Dr. Gloria Willcox. This version of the emotions wheel has spawned dozens of similar designs, as people continue to try to improve on the concept.
Further Exploration
The more we research human emotion, the more nuanced our understanding becomes in terms of how we react to the world around us.
Researchers at UC Berkeley used 2,185 short video clips to elicit emotions from study participants. Study participants rated the videos using 27 dimensions of self-reported emotional experience, and the results were mapped in an incredible interactive visualization. It is interesting to note that some video clips garnered a wide array of responses, while other clips elicit a near unanimous emotional response.
Here are some example videos and the distribution of responses:

The data visualization clusters these types of videos together, giving us a unique perspective on how people respond to certain types of stimuli.
Much like emotion itself, our desire to understand and classify the world around us is powerful and uniquely human.
Misc
How Hard Is It to Get Into an Ivy League School?
We detail the admission rates and average annual cost for Ivy League schools, as well as the median SAT scores required to be accepted.


How Hard Is It to Get Into an Ivy League School?
This was originally posted on our Voronoi app. Download the app for free on iOS or Android and discover incredible data-driven charts from a variety of trusted sources.
Ivy League institutions are renowned worldwide for their academic excellence and long-standing traditions. But how hard is it to get into one of the top universities in the U.S.?
In this graphic, we detail the admission rates and average annual cost for Ivy League schools, as well as the median SAT scores required to be accepted. The data comes from the National Center for Education Statistics and was compiled by 24/7 Wall St.
Note that “average annual cost” represents the net price a student pays after subtracting the average value of grants and/or scholarships received.
Harvard is the Most Selective
The SAT is a standardized test commonly used for college admissions in the United States. It’s taken by high school juniors and seniors to assess their readiness for college-level academic work.
When comparing SAT scores, Harvard and Dartmouth are among the most challenging universities to gain admission to. The median SAT scores for their students are 760 for reading and writing and 790 for math. Still, Harvard has half the admission rate (3.2%) compared to Dartmouth (6.4%).
| School | Admission rate (%) | SAT Score: Reading & Writing | SAT Score: Math | Avg Annual Cost* |
|---|---|---|---|---|
| Harvard University | 3.2 | 760 | 790 | $13,259 |
| Columbia University | 3.9 | 750 | 780 | $12,836 |
| Yale University | 4.6 | 760 | 780 | $16,341 |
| Brown University | 5.1 | 760 | 780 | $26,308 |
| Princeton University | 5.7 | 760 | 780 | $11,080 |
| Dartmouth College | 6.4 | 760 | 790 | $33,023 |
| University of Pennsylvania | 6.5 | 750 | 790 | $14,851 |
| Cornell University | 7.5 | 750 | 780 | $29,011 |
*Costs after receiving federal financial aid.
Additionally, Dartmouth has the highest average annual cost at $33,000. Princeton has the lowest at $11,100.
While student debt has surged in the United States in recent years, hitting $1.73 trillion in 2023, the worth of obtaining a degree from any of the schools listed surpasses mere academics. This is evidenced by the substantial incomes earned by former students.
Harvard grads, for example, have the highest average starting salary in the country, at $91,700.

-

 Maps2 weeks ago
Mapped: Average Wages Across Europe
-

 Money1 week ago
Which States Have the Highest Minimum Wage in America?
-

 Real Estate1 week ago
Ranked: The Most Valuable Housing Markets in America
-

 Markets1 week ago
Charted: Big Four Market Share by S&P 500 Audits
-

 AI1 week ago
The Stock Performance of U.S. Chipmakers So Far in 2024
-

 Automotive2 weeks ago
Almost Every EV Stock is Down After Q1 2024
-

 Money2 weeks ago
Where Does One U.S. Tax Dollar Go?
-

 Green2 weeks ago
Ranked: Top Countries by Total Forest Loss Since 2001