Misc
A Visual Guide to Human Emotion
A Visual Guide to Human Emotion
Despite vast differences in culture around the world, humanity’s DNA is 99.9% similar.
There are few attributes more central and universal to the human experience than our emotions. Of course, the broad spectrum of emotions we’re capable of experiencing can be difficult to articulate. That’s where this brilliant visualization by the Junto Institute comes in.
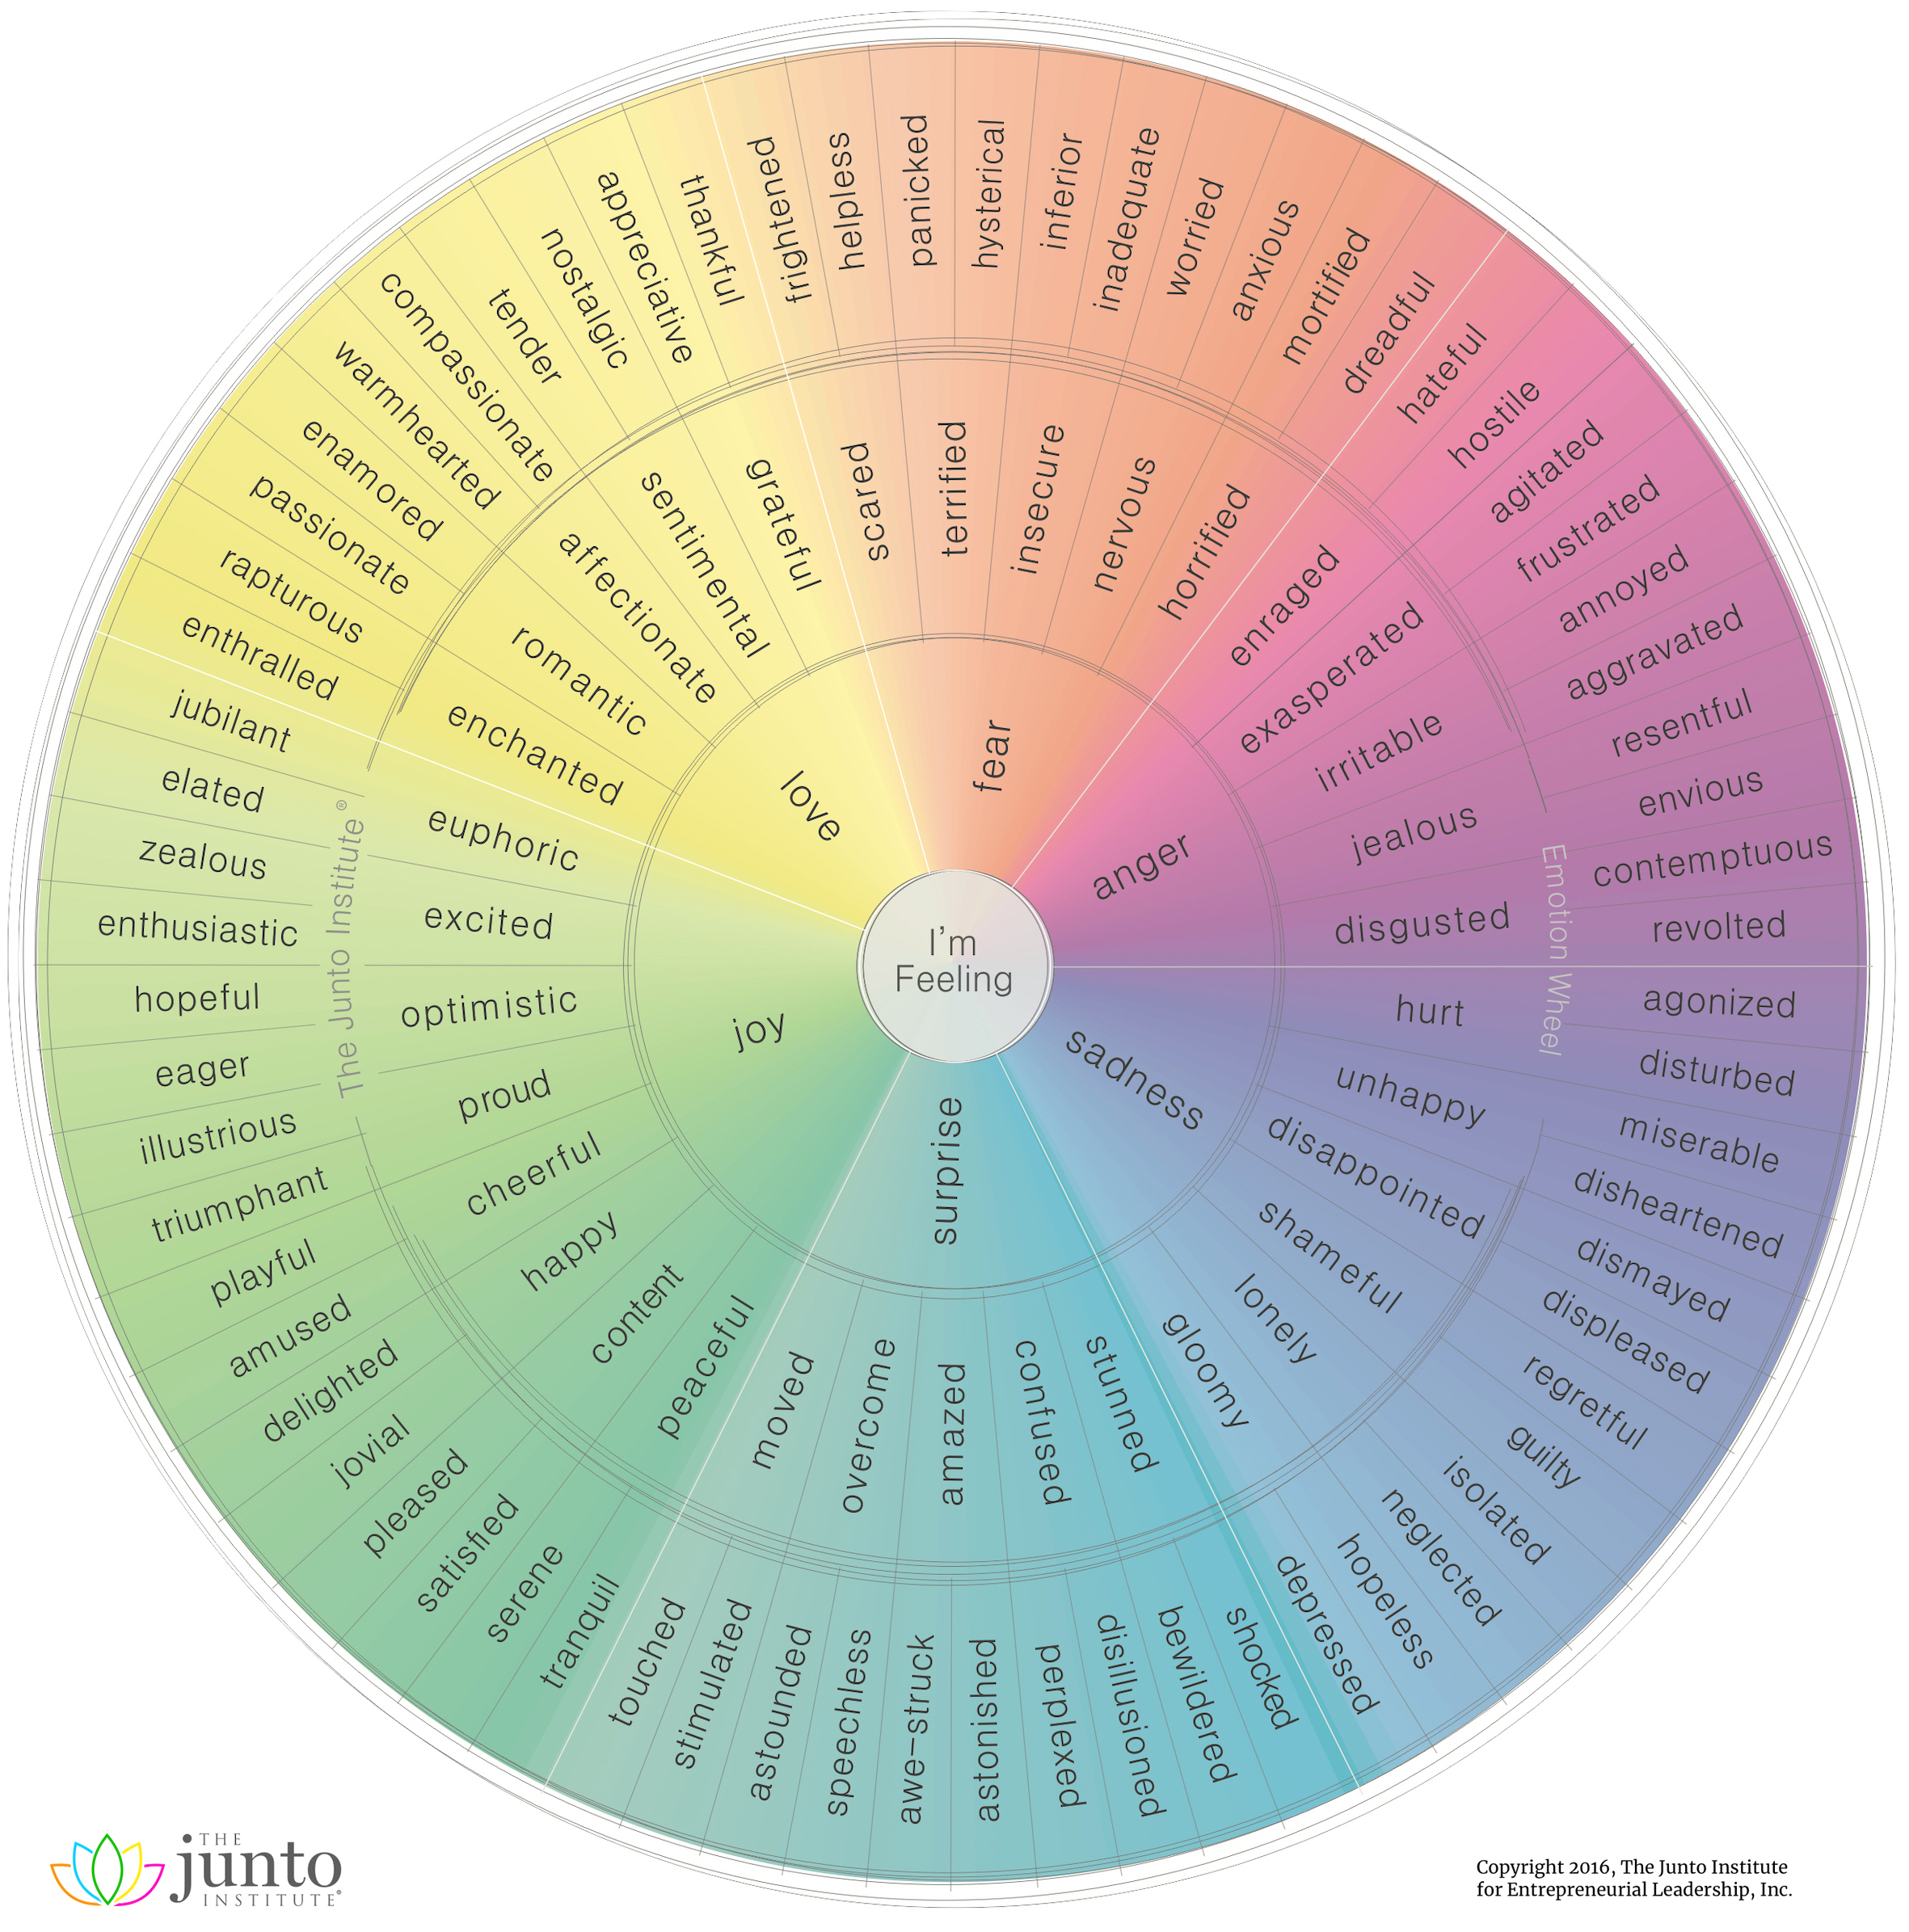
This circular visualization is the latest in an ongoing attempt to neatly categorize the full range of emotions in a logical way.
A Taxonomy of Human Emotion
Our understanding has come a long way since William James proposed four basic emotions – fear, grief, love, and rage—though these core emotions still form much of the foundation for current frameworks.
The wheel visualization above identifies six root emotions:
- Fear
- Anger
- Sadness
- Surprise
- Joy
- Love
From these six emotions, more nuanced descriptions emerge, such as jealousy as a subset of anger, and awe-struck as a subset of surprise. In total, there are 102 second- and third-order emotions listed on this emotion wheel.
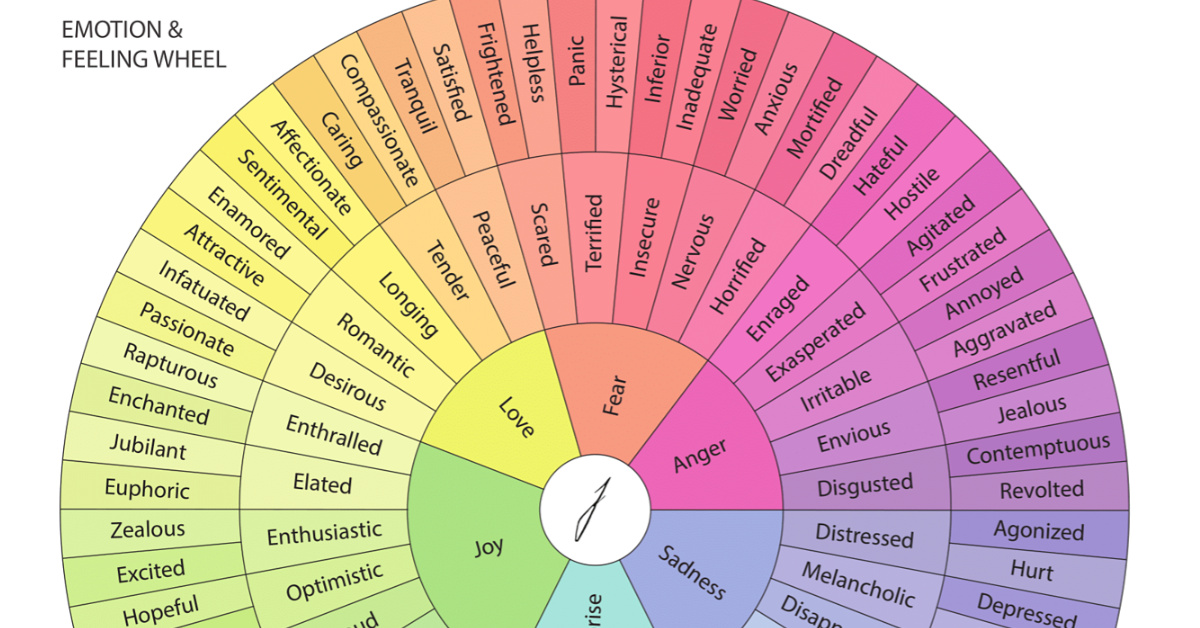
Reinventing the Feeling Wheel
The concept of mapping the range of human emotions on a wheel picked up traction in the 1980s, and has evolved ever since.
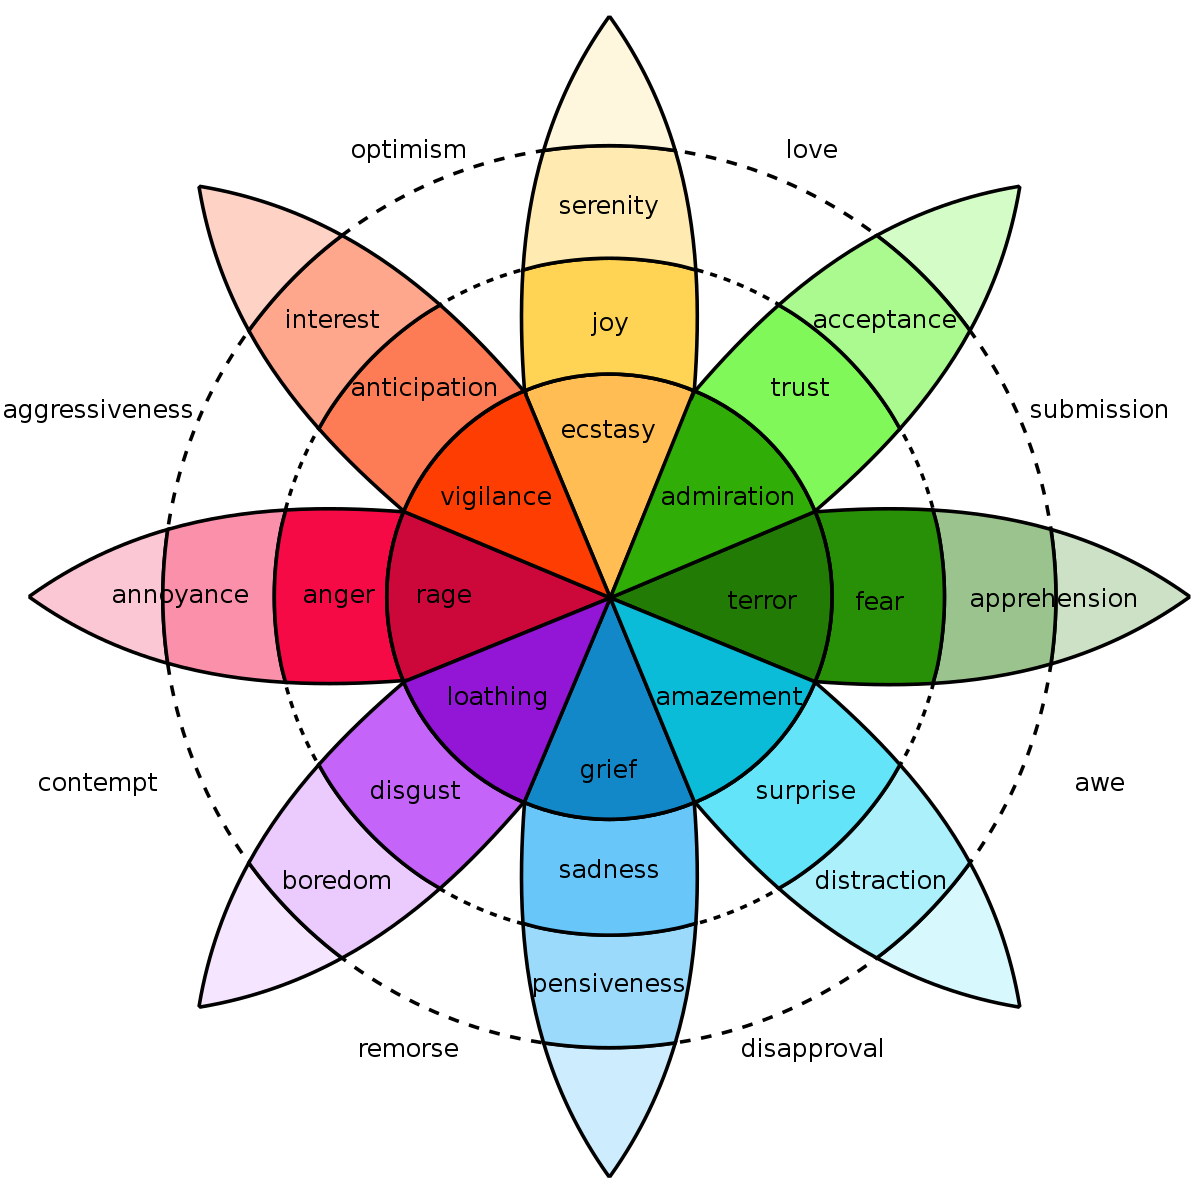
One of these original concepts was developed by American psychologist Robert Plutchik, who mapped eight primary emotions—anger, fear, sadness, disgust, surprise, anticipation, trust, and joy. These “high survival value” emotions were believed to be the most useful in keeping our ancient ancestors alive.
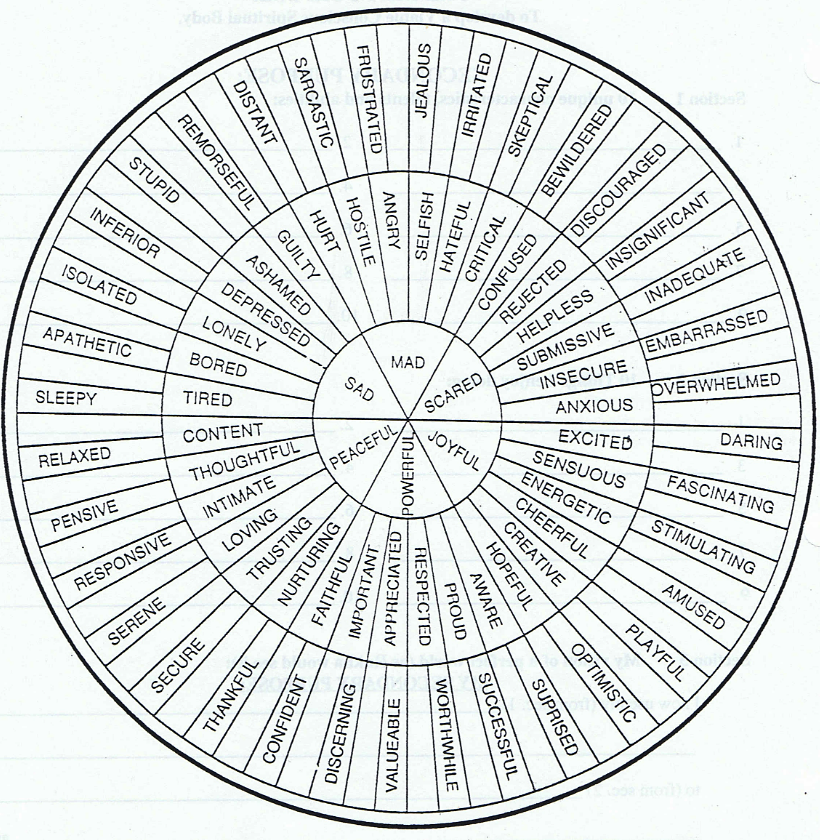
Another seminal graphic concept was developed by author Dr. Gloria Willcox. This version of the emotions wheel has spawned dozens of similar designs, as people continue to try to improve on the concept.
Further Exploration
The more we research human emotion, the more nuanced our understanding becomes in terms of how we react to the world around us.
Researchers at UC Berkeley used 2,185 short video clips to elicit emotions from study participants. Study participants rated the videos using 27 dimensions of self-reported emotional experience, and the results were mapped in an incredible interactive visualization. It is interesting to note that some video clips garnered a wide array of responses, while other clips elicit a near unanimous emotional response.
Here are some example videos and the distribution of responses:

The data visualization clusters these types of videos together, giving us a unique perspective on how people respond to certain types of stimuli.
Much like emotion itself, our desire to understand and classify the world around us is powerful and uniquely human.
Maps
The Largest Earthquakes in the New York Area (1970-2024)
The earthquake that shook buildings across New York in April 2024 was the third-largest quake in the Northeast U.S. over the past 50 years.


The Largest Earthquakes in the New York Area
This was originally posted on our Voronoi app. Download the app for free on Apple or Android and discover incredible data-driven charts from a variety of trusted sources.
The 4.8 magnitude earthquake that shook buildings across New York on Friday, April 5th, 2024 was the third-largest quake in the U.S. Northeast area over the past 50 years.
In this map, we illustrate earthquakes with a magnitude of 4.0 or greater recorded in the Northeastern U.S. since 1970, according to the United States Geological Survey (USGS).
Shallow Quakes and Older Buildings
The earthquake that struck the U.S. Northeast in April 2024 was felt by millions of people from Washington, D.C., to north of Boston. It even caused a full ground stop at Newark Airport.
The quake, occurring just 5 km beneath the Earth’s surface, was considered shallow, which is what contributed to more intense shaking at the surface.
According to the USGS, rocks in the eastern U.S. are significantly older, denser, and harder than those on the western side, compressed by time. This makes them more efficient conduits for seismic energy. Additionally, buildings in the Northeast tend to be older and may not adhere to the latest earthquake codes.
Despite disrupting work and school life, the earthquake was considered minor, according to the Michigan Technological University magnitude scale:
| Magnitude | Earthquake Effects | Estimated Number Each Year |
|---|---|---|
| 2.5 or less | Usually not felt, but can be recorded by seismograph. | Millions |
| 2.5 to 5.4 | Often felt, but only causes minor damage. | 500,000 |
| 5.5 to 6.0 | Slight damage to buildings and other structures. | 350 |
| 6.1 to 6.9 | May cause a lot of damage in very populated areas. | 100 |
| 7.0 to 7.9 | Major earthquake. Serious damage. | 10-15 |
| 8.0 or greater | Great earthquake. Can totally destroy communities near the epicenter. | One every year or two |
The largest earthquake felt in the area over the past 50 years was a 5.3 magnitude quake that occurred in Au Sable Forks, New York, in 2002. It damaged houses and cracked roads in a remote corner of the Adirondack Mountains, but caused no injuries.
| Date | Magnitude | Location | State |
|---|---|---|---|
| April 20, 2002 | 5.3 | Au Sable Forks | New York |
| October 7, 1983 | 5.1 | Newcomb | New York |
| April 5, 2024 | 4.8 | Whitehouse Station | New Jersey |
| October 16, 2012 | 4.7 | Hollis Center | Maine |
| January 16, 1994 | 4.6 | Sinking Spring | Pennsylvania |
| January 19, 1982 | 4.5 | Sanbornton | New Hampshire |
| September 25, 1998 | 4.5 | Adamsville | Pennsylvania |
| June 9, 1975 | 4.2 | Altona | New York |
| May 29, 1983 | 4.2 | Peru | Maine |
| April 23, 1984 | 4.2 | Conestoga | Pennsylvania |
| January 16, 1994 | 4.2 | Sinking Spring | Pennsylvania |
| November 3, 1975 | 4 | Long Lake | New York |
| June 17, 1991 | 4 | Worcester | New York |
The largest earthquake in U.S. history, however, was the 1964 Good Friday quake in Alaska, measuring 9.2 magnitude and killing 131 people.

-

 Business2 weeks ago
America’s Top Companies by Revenue (1994 vs. 2023)
-

 Environment1 week ago
Ranked: Top Countries by Total Forest Loss Since 2001
-

 Markets1 week ago
Visualizing America’s Shortage of Affordable Homes
-

 Maps2 weeks ago
Mapped: Average Wages Across Europe
-

 Mining2 weeks ago
Charted: The Value Gap Between the Gold Price and Gold Miners
-

 Demographics2 weeks ago
Visualizing the Size of the Global Senior Population
-

 Misc2 weeks ago
Tesla Is Once Again the World’s Best-Selling EV Company
-

 Technology2 weeks ago
Ranked: The Most Popular Smartphone Brands in the U.S.