Politics
A Visual Guide to Europe’s Member States


Who are Europe’s Member States?
With Ukraine’s recent bid to join the European Union (EU), the current status of Europe’s member states is back in the fray.
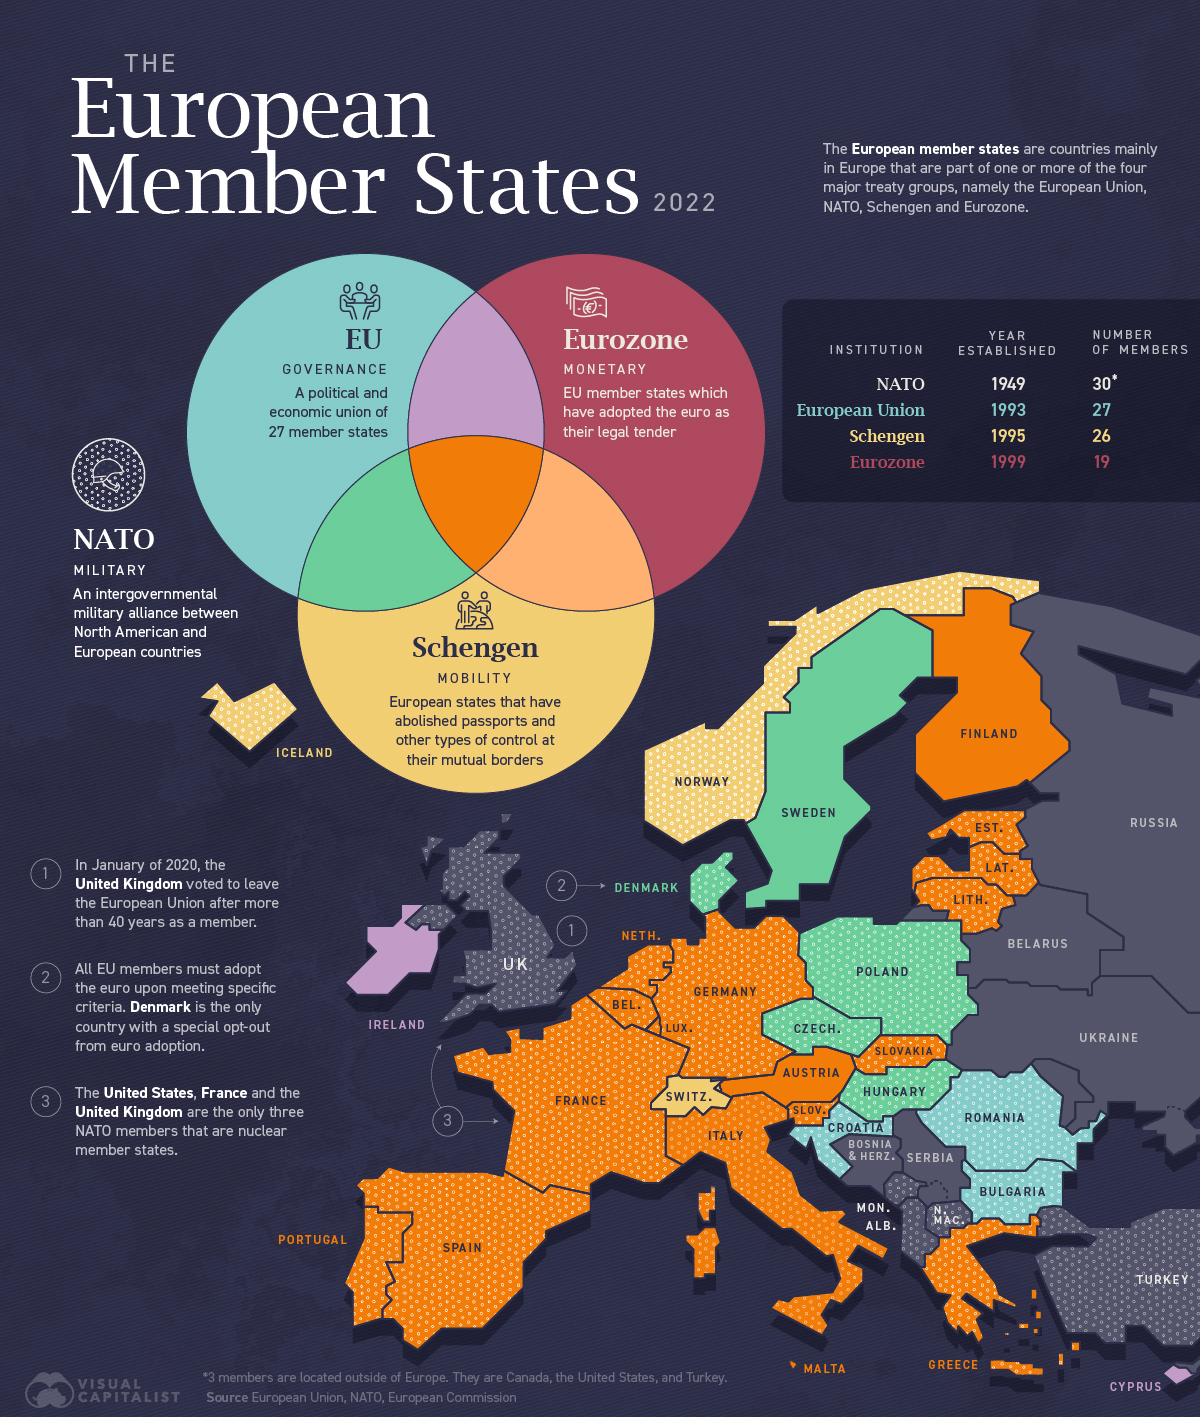
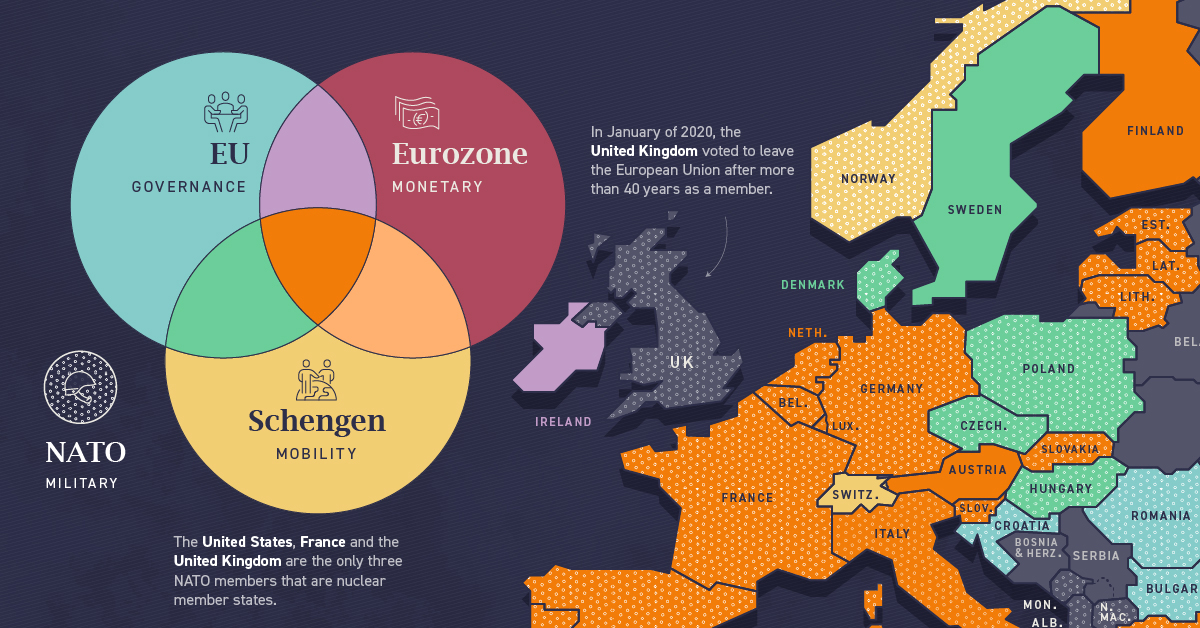
The European member states are countries mainly in Europe, and three outside, that are part of one or more of the four major treaty groups, namely the European Union (EU), NATO, Schengen, and eurozone.
Each of these institutions governs a different aspect of the region’s infrastructure.
Let’s take a look at each of them.
European Union
The European Union (EU) is a unique economic and political union between 27 European countries.
First created as the European Economic Community in the aftermath of WW2, the organization’s main focus was to foster economic cooperation. The idea was simple: countries that trade with one another and become economically interdependent are more likely to avoid conflict.
Beginning with six countries in 1958, the European Economic Community has since added 21 more countries (the UK left the EU in 2020), with a primary focus on single or internal markets.
Here are the countries that comprise the European Union:
| Number | Countries | Year of Accession |
|---|---|---|
| 1 | 🇦🇹 Austria | 1995 |
| 2 | 🇧🇪 Belgium | Founder |
| 3 | 🇧🇬 Bulgaria | 2007 |
| 4 | 🇭🇷 Croatia | 2013 |
| 5 | 🇨🇾 Cyprus | 2004 |
| 6 | 🇨🇿 Czech Republic | 2004 |
| 7 | 🇩🇰 Denmark | 1973 |
| 8 | 🇪🇪 Estonia | 2004 |
| 9 | 🇫🇮 Finland | 1995 |
| 10 | 🇫🇷 France | Founder |
| 11 | 🇩🇪 Germany | Founder |
| 12 | 🇬🇷 Greece | 1981 |
| 13 | 🇭🇺 Hungary | 2004 |
| 14 | 🇮🇪 Ireland | 1973 |
| 15 | 🇮🇹 Italy | Founder |
| 16 | 🇱🇻 Latvia | 2004 |
| 17 | 🇱🇹 Lithuania | 2004 |
| 18 | 🇱🇺 Luxembourg | Founder |
| 19 | 🇲🇹 Malta | 2004 |
| 20 | 🇳🇱 Netherlands | Founder |
| 21 | 🇵🇱 Poland | 2004 |
| 22 | 🇵🇹 Portugal | 1986 |
| 23 | 🇷🇴 Romania | 2007 |
| 24 | 🇸🇰 Slovakia | 2004 |
| 25 | 🇸🇮 Slovenia | 2004 |
| 26 | 🇪🇸 Spain | 1986 |
| 27 | 🇸🇪 Sweden | 1995 |
What began as a purely economic union has evolved into an organization pioneering the development of many different policy areas. A name change from the European Economic Community to the European Union in 1993 reflected this.
NATO
The North Atlantic Treaty Organization (NATO) exists for the sole purpose of facilitating a political and military alliance between its 30 member countries.
Established in 1949 in response to post-WW2 Soviet aggression, NATO exists for the collective defense and security of the group. Members share few laws and regulations. An attack on one constitutes an attack on all, and member states are obligated to defend one another.
The chronological timeline of NATO’s expansion since its establishment paints a fascinating picture.
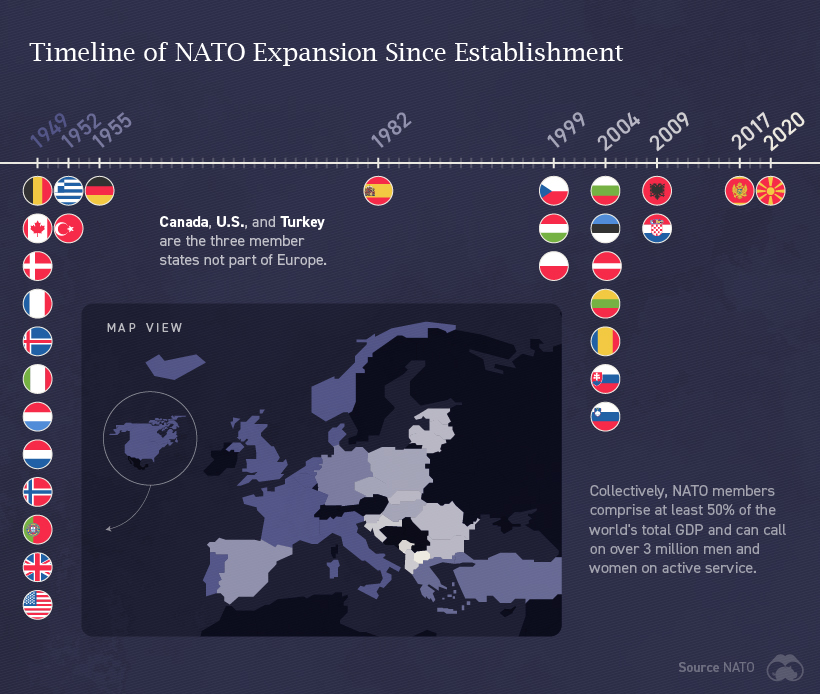
As of 2021, NATO officially recognizes three aspiring NATO members: Bosnia and Herzegovina, Georgia, and Ukraine. Ukraine has voiced its desire to join NATO since 2014 but hasn’t met its political and military criteria.
Eurozone
The eurozone is a geographic and economic region that consists of countries that have adopted the euro as their national currency. Approximately 340 million people live in the euro area.
Today, the eurozone consists of 19 countries of the European Union. Here they are:
| Number | Countries | Year of Adoption |
|---|---|---|
| 1 | 🇦🇹 Austria | 1999 |
| 2 | 🇧🇪 Belgium | 1999 |
| 3 | 🇨🇾 Cyprus | 2008 |
| 4 | 🇪🇪 Estonia | 2011 |
| 5 | 🇫🇮 Finland | 1999 |
| 6 | 🇫🇷 France | 1999 |
| 7 | 🇩🇪 Germany | 1999 |
| 8 | 🇬🇷 Greece | 2001 |
| 9 | 🇮🇪 Ireland | 1999 |
| 10 | 🇮🇹 Italy | 1999 |
| 11 | 🇱🇻 Latvia | 2014 |
| 12 | 🇱🇹 Lithuania | 2015 |
| 13 | 🇱🇺 Luxembourg | 1999 |
| 14 | 🇲🇹 Malta | 2008 |
| 15 | 🇳🇱 Netherlands | 1999 |
| 16 | 🇵🇹 Portugal | 1999 |
| 17 | 🇸🇰 Slovakia | 2009 |
| 18 | 🇸🇮 Slovenia | 2007 |
| 19 | 🇪🇸 Spain | 1999 |
European Union nations that decide to participate in the eurozone must meet a multitude of financial requirements. They include price stability, sound public finances, the durability of convergence, and exchange rate stability.
Not all countries have to adopt the currency, though. For example, Denmark has a special opt-out clause to use its own currency and maintain its financial independence.
Schengen
The Schengen Area comprises 26 European countries that agreed to create common entry and exit requirements to remove the need for internal borders. This allows travellers up to 90 days of visa-free travel to any of the countries in the Schengen Area.
The border-free Schengen Area guarantees free movement to more than 400 million EU citizens, along with non-EU nationals living in the EU or visiting as tourists, exchange students, or for business purposes.
Here’s a list of the 26 countries that are a part of the Schengen Area:
| Number | Countries | Year of Implementation |
|---|---|---|
| 1 | 🇦🇹 Austria | 1997 |
| 2 | 🇧🇪 Belgium | 1995 |
| 3 | 🇨🇿 Czech Republic | 2007 |
| 4 | 🇩🇰 Denmark | 2001 |
| 5 | 🇪🇪 Estonia | 2007 |
| 6 | 🇫🇮 Finland | 2001 |
| 7 | 🇫🇷 France | 1995 |
| 8 | 🇩🇪 Germany | 1995 |
| 9 | 🇬🇷 Greece | 2000 |
| 10 | 🇭🇺 Hungary | 2007 |
| 11 | 🇮🇸 Iceland | 2001 |
| 12 | 🇮🇹 Italy | 1997 |
| 13 | 🇱🇻 Latvia | 2007 |
| 14 | 🇱🇮 Liechtenstein | 2011 |
| 15 | 🇱🇹 Lithuania | 2007 |
| 16 | 🇱🇺 Luxembourg | 1995 |
| 17 | 🇲🇹 Malta | 2007 |
| 18 | 🇳🇱 Netherlands | 1995 |
| 19 | 🇳🇴 Norway | 2001 |
| 20 | 🇵🇱 Poland | 2007 |
| 21 | 🇵🇹 Portugal | 1995 |
| 22 | 🇸🇰 Slovakia | 2007 |
| 23 | 🇸🇮 Slovenia | 2007 |
| 24 | 🇪🇸 Spain | 1995 |
| 25 | 🇸🇪 Sweden | 2001 |
| 26 | 🇨🇭 Switzerland | 2008 |
Monaco, Vatican City, and San Marino also have open borders with Schengen area countries even though they aren’t part of the treaty.


Economy
The Bloc Effect: International Trade with Geopolitical Allies on the Rise
Rising geopolitical tensions are shaping the future of international trade, but what is the effect on trading among G7 and BRICS countries?


The Bloc Effect: International Trade with Allies on the Rise
International trade has become increasingly fragmented over the last five years as countries have shifted to trading more with their geopolitical allies.
This graphic from The Hinrich Foundation, the first in a three-part series covering the future of trade, provides visual context to the growing divide in trade in G7 and pre-expansion BRICS countries, which are used as proxies for geopolitical blocs.
Trade Shifts in G7 and BRICS Countries
This analysis uses IMF data to examine differences in shares of exports within and between trading blocs from 2018 to 2023. For example, we looked at the percentage of China’s exports with other BRICS members as well as with G7 members to see how these proportions shifted in percentage points (pp) over time.
Countries traded nearly $270 billion more with allies in 2023 compared to 2018. This shift came at the expense of trade with rival blocs, which saw a decline of $314 billion.
Country Change in Exports Within Bloc (pp) Change in Exports With Other Bloc (pp)
🇮🇳 India 0.0 3.9
🇷🇺 Russia 0.7 -3.8
🇮🇹 Italy 0.8 -0.7
🇨🇦 Canada 0.9 -0.7
🇫🇷 France 1.0 -1.1
🇪🇺 EU 1.1 -1.5
🇩🇪 Germany 1.4 -2.1
🇿🇦 South Africa 1.5 1.5
🇺🇸 U.S. 1.6 -0.4
🇯🇵 Japan 2.0 -1.7
🇨🇳 China 2.1 -5.2
🇧🇷 Brazil 3.7 -3.3
🇬🇧 UK 10.2 0.5
All shifts reported are in percentage points. For example, the EU saw its share of exports to G7 countries rise from 74.3% in 2018 to 75.4% in 2023, which equates to a 1.1 percentage point increase.
The UK saw the largest uptick in trading with other countries within the G7 (+10.2 percentage points), namely the EU, as the post-Brexit trade slump to the region recovered.
Meanwhile, the U.S.-China trade dispute caused China’s share of exports to the G7 to fall by 5.2 percentage points from 2018 to 2023, the largest decline in our sample set. In fact, partly as a result of the conflict, the U.S. has by far the highest number of harmful tariffs in place.
The Russia-Ukraine War and ensuing sanctions by the West contributed to Russia’s share of exports to the G7 falling by 3.8 percentage points over the same timeframe.
India, South Africa, and the UK bucked the trend and continued to witness advances in exports with the opposing bloc.
Average Trade Shifts of G7 and BRICS Blocs
Though results varied significantly on a country-by-country basis, the broader trend towards favoring geopolitical allies in international trade is clear.
Bloc Change in Exports Within Bloc (pp) Change in Exports With Other Bloc (pp)
Average 2.1 -1.1
BRICS 1.6 -1.4
G7 incl. EU 2.4 -1.0
Overall, BRICS countries saw a larger shift away from exports with the other bloc, while for G7 countries the shift within their own bloc was more pronounced. This implies that though BRICS countries are trading less with the G7, they are relying more on trade partners outside their bloc to make up for the lost G7 share.
A Global Shift in International Trade and Geopolitical Proximity
The movement towards strengthening trade relations based on geopolitical proximity is a global trend.
The United Nations categorizes countries along a scale of geopolitical proximity based on UN voting records.
According to the organization’s analysis, international trade between geopolitically close countries rose from the first quarter of 2022 (when Russia first invaded Ukraine) to the third quarter of 2023 by over 6%. Conversely, trade with geopolitically distant countries declined.
The second piece in this series will explore China’s gradual move away from using the U.S. dollar in trade settlements.
Visit the Hinrich Foundation to learn more about the future of geopolitical trade

-

 Economy15 hours ago
Economic Growth Forecasts for G7 and BRICS Countries in 2024
The IMF has released its economic growth forecasts for 2024. How do the G7 and BRICS countries compare?
-

 United States1 week ago
Ranked: The Largest U.S. Corporations by Number of Employees
We visualized the top U.S. companies by employees, revealing the massive scale of retailers like Walmart, Target, and Home Depot.
-

 Economy2 weeks ago
Where U.S. Inflation Hit the Hardest in March 2024
We visualized product categories that saw the highest % increase in price due to U.S. inflation as of March 2024.
-

 Economy4 weeks ago
G20 Inflation Rates: Feb 2024 vs COVID Peak
We visualize inflation rates across G20 countries as of Feb 2024, in the context of their COVID-19 pandemic peak.
-

 Economy1 month ago
Mapped: Unemployment Claims by State
This visual heatmap of unemployment claims by state highlights New York, California, and Alaska leading the country by a wide margin.
-

 Markets2 months ago
Confidence in the Global Economy, by Country
Will the global economy be stronger in 2024 than in 2023?


-

 Markets1 week ago
U.S. Debt Interest Payments Reach $1 Trillion
-

 Markets2 weeks ago
Ranked: The Most Valuable Housing Markets in America
-

 Money2 weeks ago
Which States Have the Highest Minimum Wage in America?
-

 AI2 weeks ago
Ranked: Semiconductor Companies by Industry Revenue Share
-

 Markets2 weeks ago
Ranked: The World’s Top Flight Routes, by Revenue
-

 Countries2 weeks ago
Population Projections: The World’s 6 Largest Countries in 2075
-

 Markets2 weeks ago
The Top 10 States by Real GDP Growth in 2023
-

 Money2 weeks ago
The Smallest Gender Wage Gaps in OECD Countries