Energy
A Visual Crash Course on Geothermal Energy
![]() Subscribe to the Elements free mailing list for more like this
Subscribe to the Elements free mailing list for more like this


A Visual Crash Course on Geothermal Energy
This was originally posted on Elements. Sign up to the free mailing list to get beautiful visualizations on natural resource megatrends in your email every week.
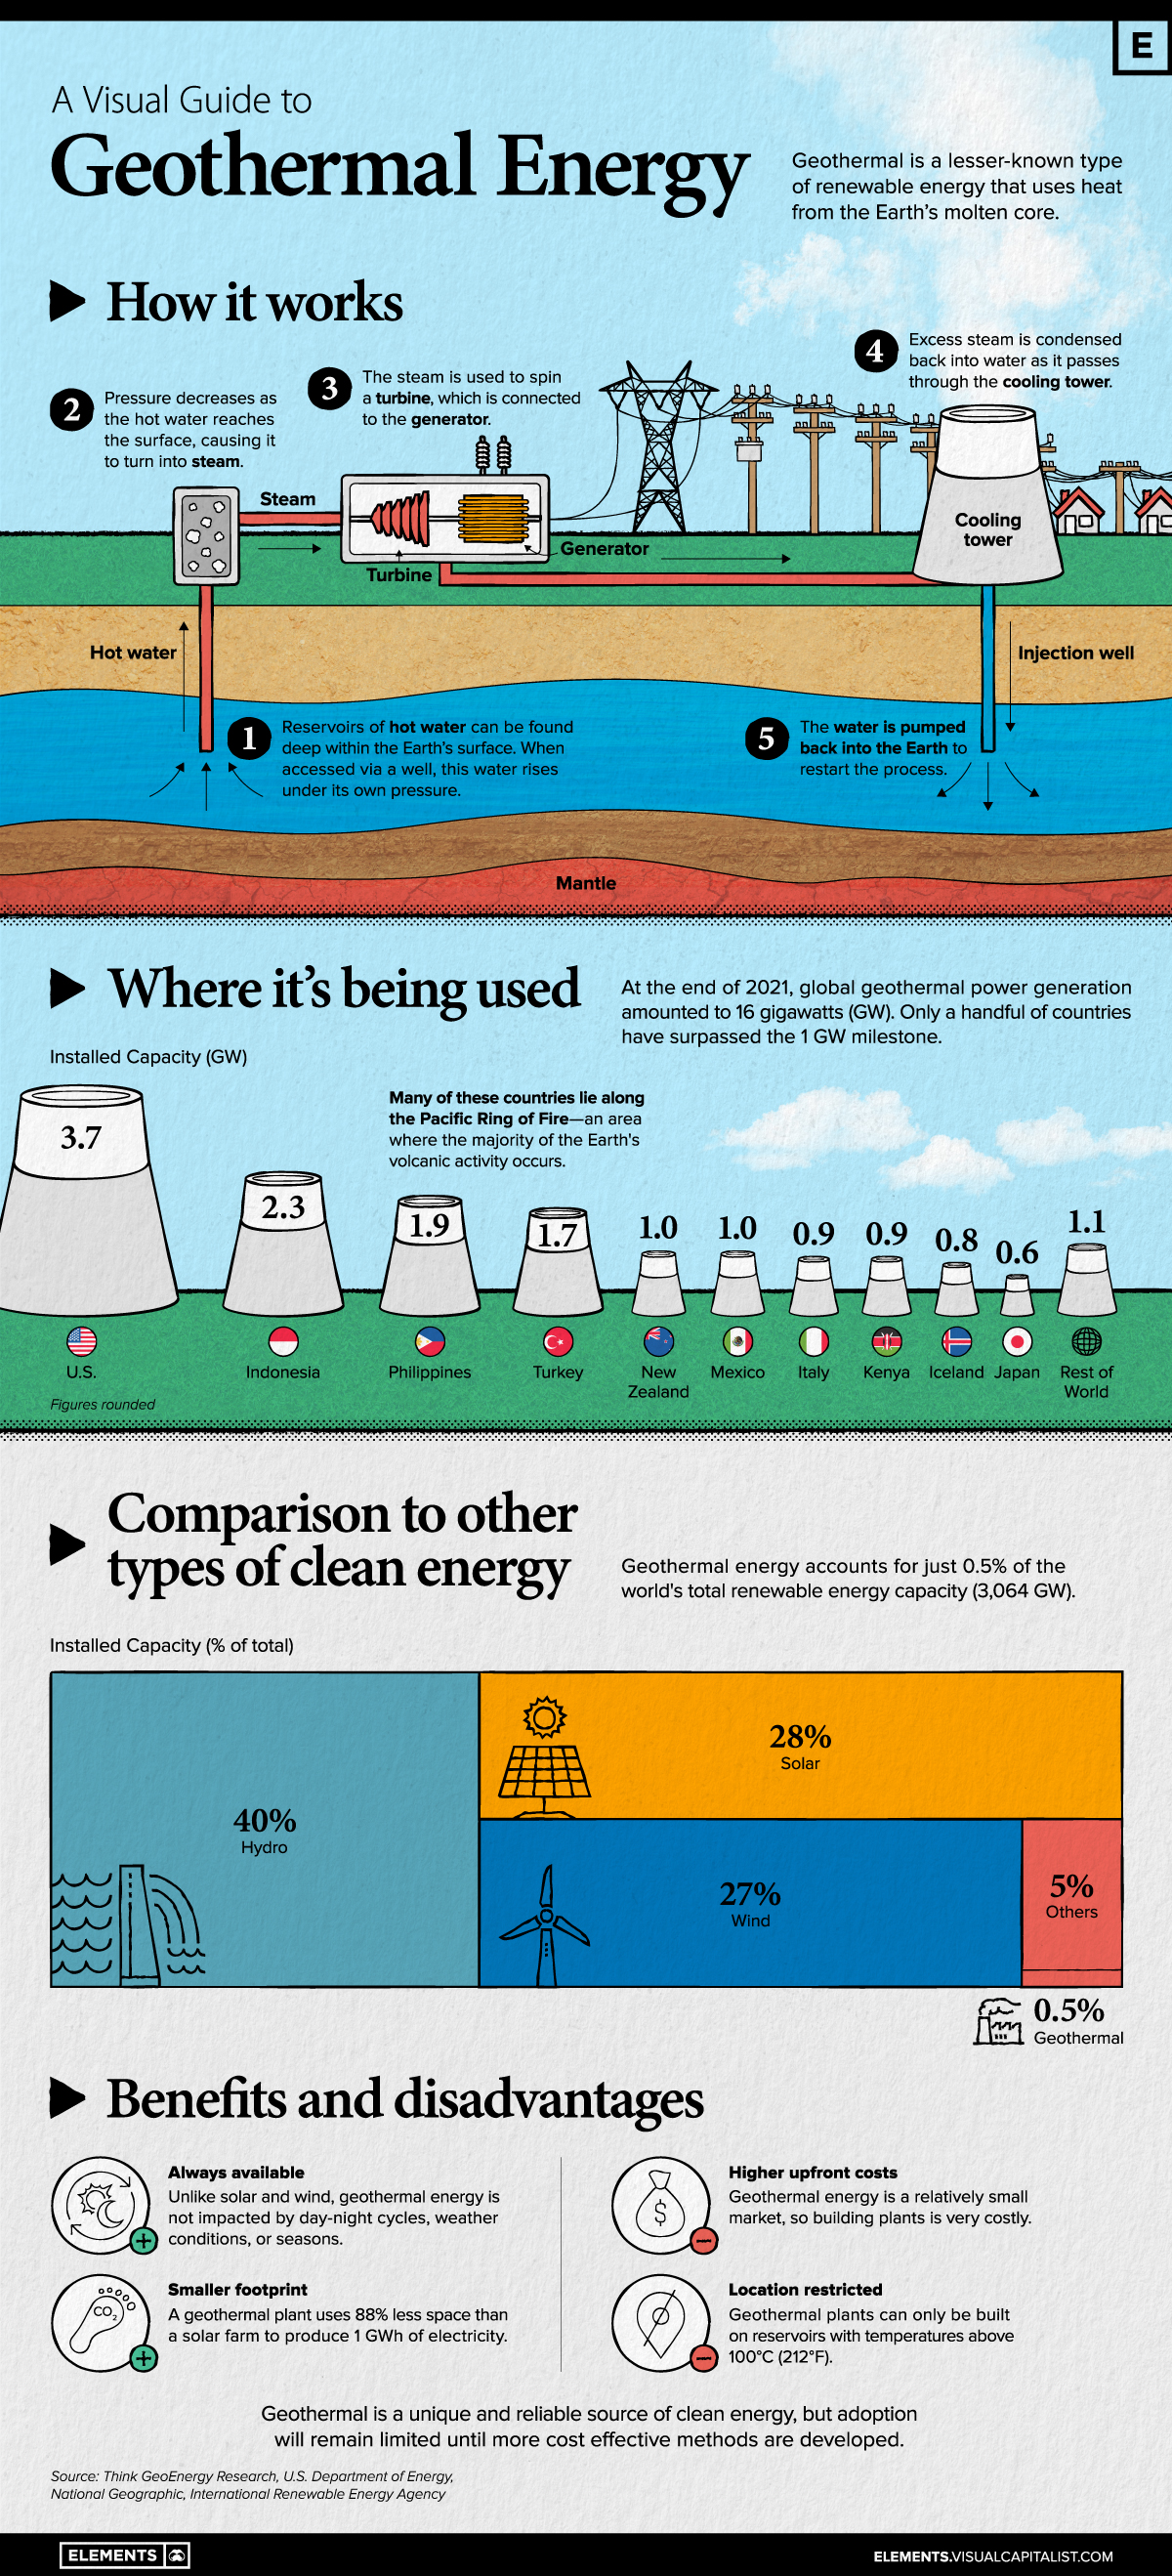
Geothermal is a lesser-known type of renewable energy that uses heat from the Earth’s molten core to produce electricity.
While this unique feature gives it key benefits over solar and wind, it also suffers from high costs and geographic restrictions. Because of this, few countries have managed to produce geothermal energy at scale.
In this infographic, we’ve used a combination of diagrams and charts to give you a high level overview of this sustainable energy source.
How Geothermal Works
Geothermal energy is produced by accessing reservoirs of hot water that are found several miles below the earth’s surface. In certain parts of the planet, this water naturally breaks through the surface, creating what’s known as a hot spring (or in some cases, a geyser).
When accessed via a well, this pressurized water rises up and rapidly expands into steam. That steam is used to spin a turbine, which then drives an electric generator.
Further along the process, excess steam is condensed back into water as it passes through a cooling tower. An injection well pumps this water back into the Earth to ensure sustainability.
Where Is Geothermal Energy Being Used?
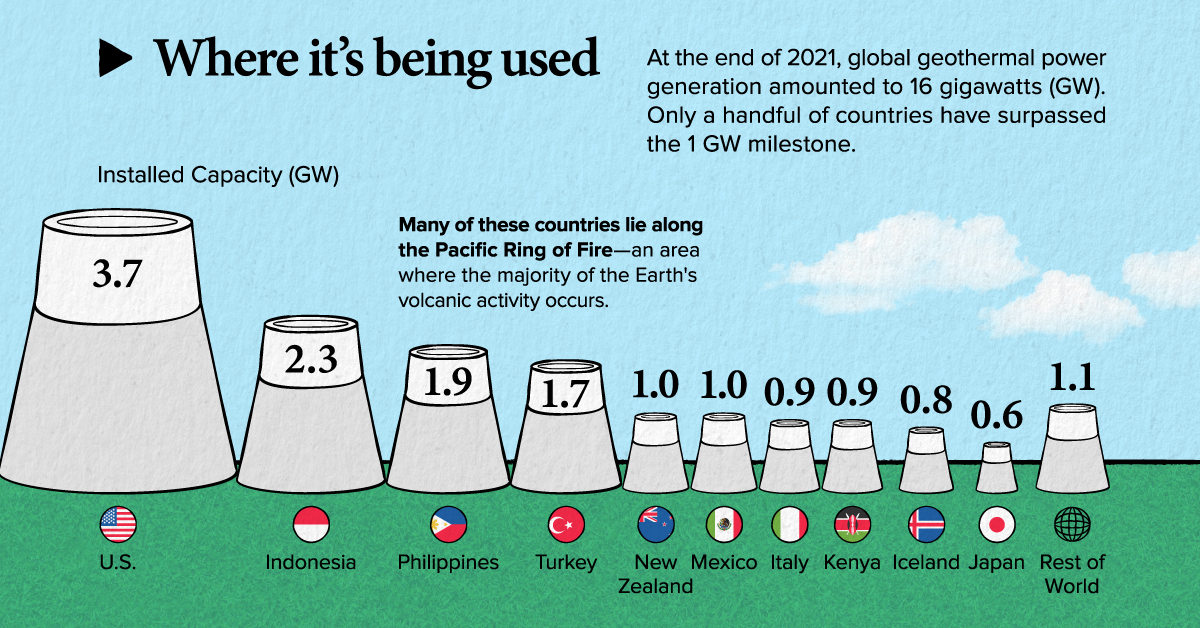
As of 2021, global geothermal power generation amounted to 16 gigawatts (GW). Only a handful of countries have surpassed the 1GW milestone.
| Country | Installed Capacity (GW) |
|---|---|
| 🇺🇸 U.S. | 3.7 |
| 🇮🇩 Indonesia | 2.3 |
| 🇵🇭 Philippines | 1.9 |
| 🇹🇷 Turkey | 1.7 |
| 🇳🇿 New Zealand | 1 |
| 🇲🇽 Mexico | 1 |
| 🇮🇹 Italy | 0.9 |
| 🇰🇪 Kenya | 0.9 |
| 🇮🇸 Iceland | 0.8 |
| 🇯🇵 Japan | 0.6 |
| 🌎 Rest of World | 1.1 |
To give these numbers context, consider the following datapoints:
- America’s 3.7 GW capacity is split across 61 geothermal plants.
- The world’s largest solar plant, the Bhadla Solar Park, has a maximum output of 2.2 GW
- The world’s largest hydroelectric plant, the Three Gorges Dam, can produce up to 22.5 GW
While geothermal plants clearly produce less power, they do have benefits over other types of renewables. For example, geothermal energy is not impacted by day-night cycles, weather conditions, or seasons.
The Big Picture
We now look at a second dataset, which shows the global contribution of each type of renewable energy. These figures are as of April 2022, and were sourced from the International Renewable Energy Agency (IRENA).
| Type | Installed Capacity (% of total) | Installed Capacity (GW) |
|---|---|---|
| Hydro | 40% | 1226 |
| Solar | 28% | 858 |
| Wind | 27% | 827 |
| Others (Geothermal) | 5% (0.5%) | 153 (15*) |
| Total | 100% | 3064 |
*Geothermal’s total capacity in this dataset differs from the previous value of 16GW. This is due to differing sources and rounding.
One reason for the slow adoption of geothermal energy is that they can only be built in regions that have suitable geological features (such as places where there is volcanic activity).
To expand on that point, consider the following data from Fitch Solutions, which shows the forecasted growth of geothermal energy capacity by region.
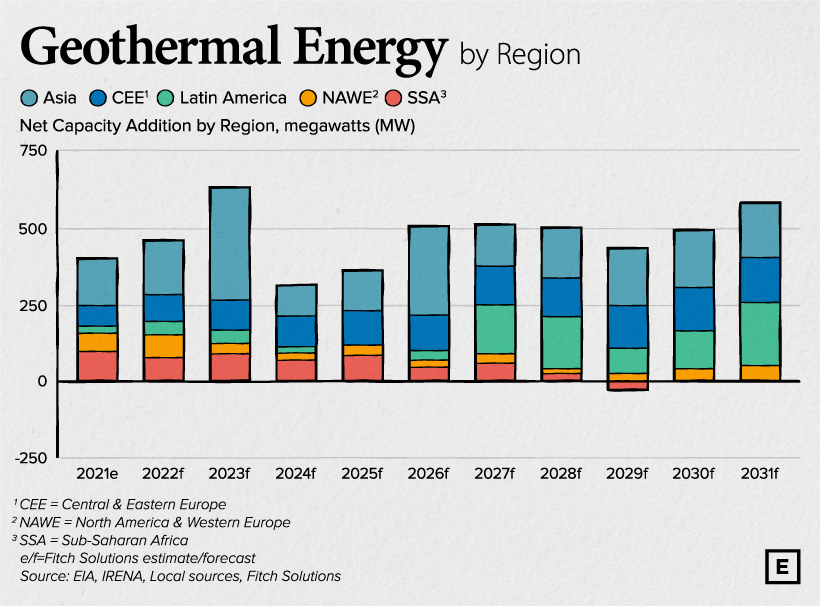
Fitch believes that over the next decade, the majority of new geothermal capacity will be installed in Asia. On the flipside, investment in North America and Western Europe (NAWE) is expected to decrease.
Over the coming years, NAWE will experience a gradual slowdown in geothermal capacity additions as we expect that investments will be crowded out by cheaper wind and solar projects.
– Fitch Solutions
The top markets for geothermal are expected to be Indonesia, the Philippines, and New Zealand, which all lie along the Pacific Ring of Fire. The Ring of Fire is a path along the Pacific Ocean where the majority of volcanic activity occurs.


Energy
Charted: 4 Reasons Why Lithium Could Be the Next Gold Rush
Visual Capitalist has partnered with EnergyX to show why drops in prices and growing demand may make now the right time to invest in lithium.


4 Reasons Why You Should Invest in Lithium
Lithium’s importance in powering EVs makes it a linchpin of the clean energy transition and one of the world’s most precious minerals.
In this graphic, Visual Capitalist partnered with EnergyX to explore why now may be the time to invest in lithium.
1. Lithium Prices Have Dropped
One of the most critical aspects of evaluating an investment is ensuring that the asset’s value is higher than its price would indicate. Lithium is integral to powering EVs, and, prices have fallen fast over the last year:
| Date | LiOH·H₂O* | Li₂CO₃** |
|---|---|---|
| Feb 2023 | $76 | $71 |
| March 2023 | $71 | $61 |
| Apr 2023 | $43 | $33 |
| May 2023 | $43 | $33 |
| June 2023 | $47 | $45 |
| July 2023 | $44 | $40 |
| Aug 2023 | $35 | $35 |
| Sept 2023 | $28 | $27 |
| Oct 2023 | $24 | $23 |
| Nov 2023 | $21 | $21 |
| Dec 2023 | $17 | $16 |
| Jan 2024 | $14 | $15 |
| Feb 2024 | $13 | $14 |
Note: Monthly spot prices were taken as close to the 14th of each month as possible.
*Lithium hydroxide monohydrate MB-LI-0033
**Lithium carbonate MB-LI-0029
2. Lithium-Ion Battery Prices Are Also Falling
The drop in lithium prices is just one reason to invest in the metal. Increasing economies of scale, coupled with low commodity prices, have caused the cost of lithium-ion batteries to drop significantly as well.
In fact, BNEF reports that between 2013 and 2023, the price of a Li-ion battery dropped by 82%.
| Year | Price per KWh |
|---|---|
| 2023 | $139 |
| 2022 | $161 |
| 2021 | $150 |
| 2020 | $160 |
| 2019 | $183 |
| 2018 | $211 |
| 2017 | $258 |
| 2016 | $345 |
| 2015 | $448 |
| 2014 | $692 |
| 2013 | $780 |

3. EV Adoption is Sustainable
One of the best reasons to invest in lithium is that EVs, one of the main drivers behind the demand for lithium, have reached a price point similar to that of traditional vehicle.
According to the Kelly Blue Book, Tesla’s average transaction price dropped by 25% between 2022 and 2023, bringing it in line with many other major manufacturers and showing that EVs are a realistic transport option from a consumer price perspective.
| Manufacturer | September 2022 | September 2023 |
|---|---|---|
| BMW | $69,000 | $72,000 |
| Ford | $54,000 | $56,000 |
| Volkswagon | $54,000 | $56,000 |
| General Motors | $52,000 | $53,000 |
| Tesla | $68,000 | $51,000 |
4. Electricity Demand in Transport is Growing
As EVs become an accessible transport option, there’s an investment opportunity in lithium. But possibly the best reason to invest in lithium is that the IEA reports global demand for the electricity in transport could grow dramatically by 2030:
| Transport Type | 2022 | 2025 | 2030 |
|---|---|---|---|
| Buses 🚌 | 23,000 GWh | 50,000 GWh | 130,000 GWh |
| Cars 🚙 | 65,000 GWh | 200,000 GWh | 570,000 GWh |
| Trucks 🛻 | 4,000 GWh | 15,000 GWh | 94,000 GWh |
| Vans 🚐 | 6,000 GWh | 16,000 GWh | 72,000 GWh |
The Lithium Investment Opportunity
Lithium presents a potentially classic investment opportunity. Lithium and battery prices have dropped significantly, and recently, EVs have reached a price point similar to other vehicles. By 2030, the demand for clean energy, especially in transport, will grow dramatically.
With prices dropping and demand skyrocketing, now is the time to invest in lithium.
EnergyX is poised to exploit lithium demand with cutting-edge lithium extraction technology capable of extracting 300% more lithium than current processes.

-

 Lithium3 days ago
Ranked: The Top 10 EV Battery Manufacturers in 2023
Asia dominates this ranking of the world’s largest EV battery manufacturers in 2023.
-

 Energy1 week ago
The World’s Biggest Nuclear Energy Producers
China has grown its nuclear capacity over the last decade, now ranking second on the list of top nuclear energy producers.
-

 Energy4 weeks ago
The World’s Biggest Oil Producers in 2023
Just three countries accounted for 40% of global oil production last year.
-

 Energy1 month ago
How Much Does the U.S. Depend on Russian Uranium?
Currently, Russia is the largest foreign supplier of nuclear power fuel to the U.S.
-

 Uranium2 months ago
Charted: Global Uranium Reserves, by Country
We visualize the distribution of the world’s uranium reserves by country, with 3 countries accounting for more than half of total reserves.
-

 Energy3 months ago
Visualizing the Rise of the U.S. as Top Crude Oil Producer
Over the last decade, the United States has established itself as the world’s top producer of crude oil, surpassing Saudi Arabia and Russia.


-

 Markets1 week ago
U.S. Debt Interest Payments Reach $1 Trillion
-

 Markets2 weeks ago
Ranked: The Most Valuable Housing Markets in America
-

 Money2 weeks ago
Which States Have the Highest Minimum Wage in America?
-

 AI2 weeks ago
Ranked: Semiconductor Companies by Industry Revenue Share
-

 Markets2 weeks ago
Ranked: The World’s Top Flight Routes, by Revenue
-

 Countries2 weeks ago
Population Projections: The World’s 6 Largest Countries in 2075
-

 Markets2 weeks ago
The Top 10 States by Real GDP Growth in 2023
-

 Money2 weeks ago
The Smallest Gender Wage Gaps in OECD Countries