Visual Capitalist
A Sneak Preview Of Our New Book
By now, you’ve likely heard of the ambitious plans for our new book “Visualizing Change”.
We’re aiming to take hundreds of pages of our best infographics, charts, and visualizations, and connect them with one universal theme: what are the fundamental forces shaping the business and investing world?
To make the book a reality we are funding through Kickstarter – and with just a few days remaining to reach our goal, only you can help us make it there.
Example Book Spreads
As we get closer to the funding deadline, we’ve been working hard to imagine how the book could look. Click below to see two exclusive sneak previews of how the pages of this infographic book will be laid out:
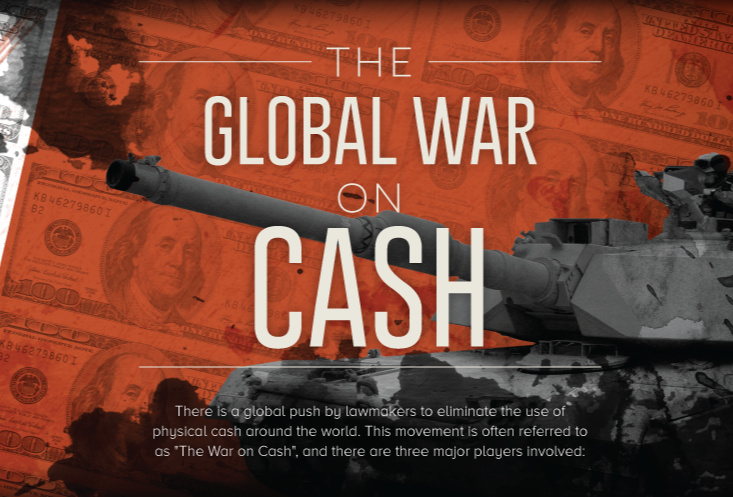
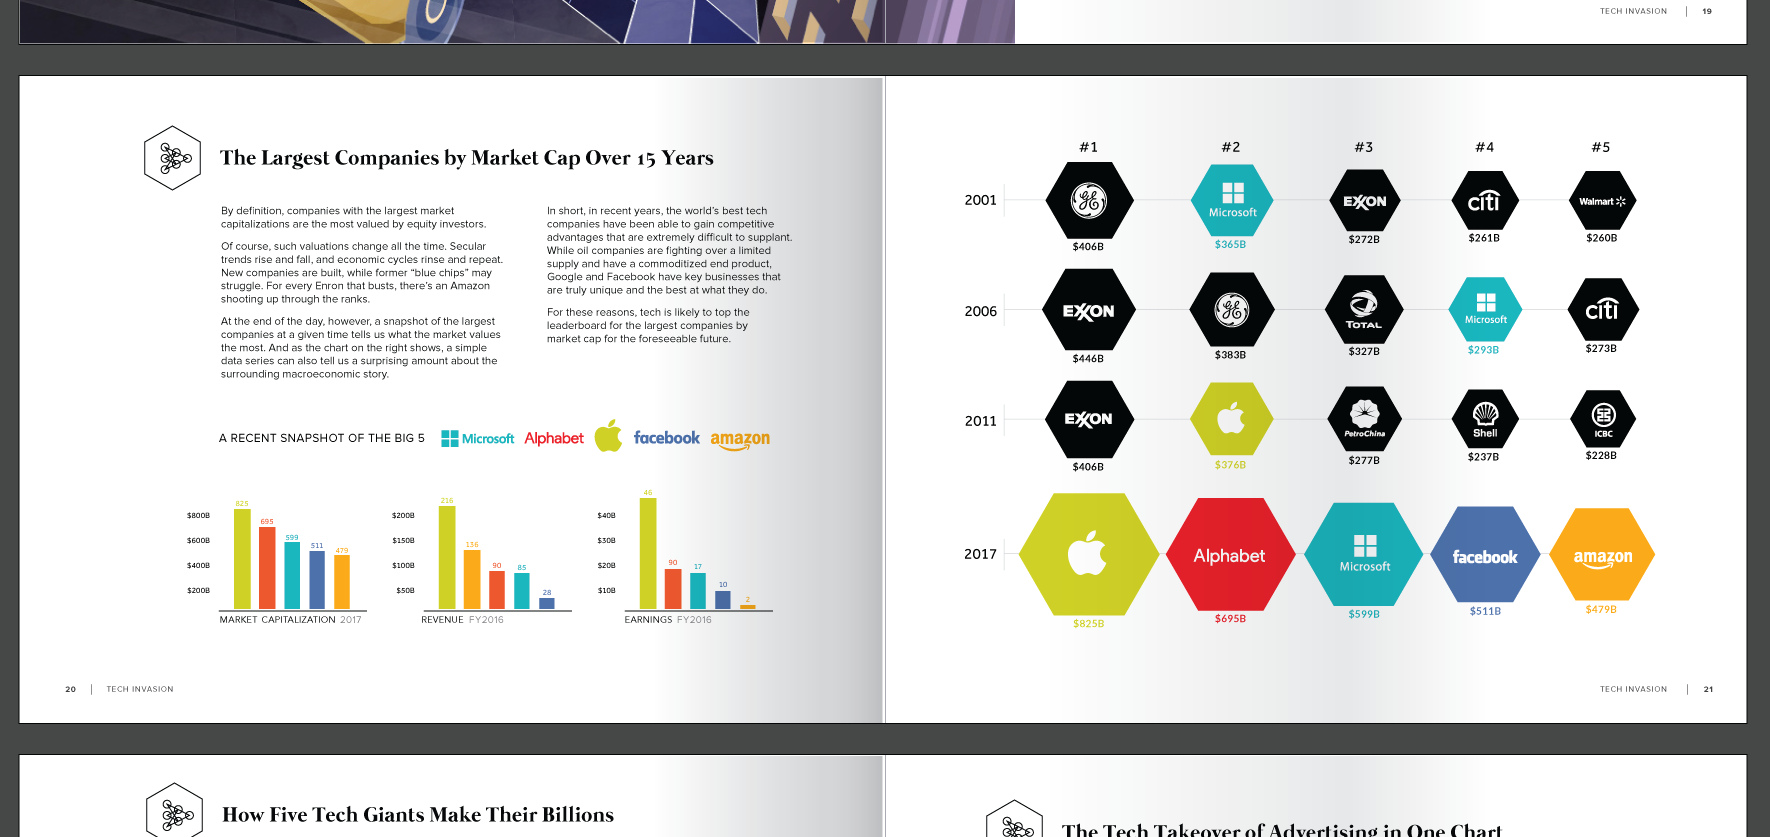
| "The War on Cash" The first six pages of this infographic, mocked up as it could appear in book. | "The Tech Invasion" How tech companies make their money, and are taking non-tech markets by storm. |
 |  |
The final product is guaranteed to capture your imagination with hundreds of pages of our best work to date, including 40+ pages of new, never-before-seen infographics!
One Potential Snag…
To date, we are still short of reaching our funding goal to make the book – and now there are less than 10 days left.
Want to help make sure it goes into production? Here’s how you can help:
- Make any pledge on our Kickstarter page here to help us reach our funding goal
- Share the campaign for the book on social media or with friends
- Instead of ordering one copy, order a bulk-pack of 10 or 50 (branded with your logo) and give to clients or friends
It’s zero-risk to pledge on Kickstarter, and credit cards don’t get charged unless we reach our funding goal.


VC+
VC+: Get Our Key Takeaways From the IMF’s World Economic Outlook
A sneak preview of the exclusive VC+ Special Dispatch—your shortcut to understanding IMF’s World Economic Outlook report.

Have you read IMF’s latest World Economic Outlook yet? At a daunting 202 pages, we don’t blame you if it’s still on your to-do list.
But don’t worry, you don’t need to read the whole April release, because we’ve already done the hard work for you.
To save you time and effort, the Visual Capitalist team has compiled a visual analysis of everything you need to know from the report—and our VC+ Special Dispatch is available exclusively to VC+ members. All you need to do is log into the VC+ Archive.
If you’re not already subscribed to VC+, make sure you sign up now to access the full analysis of the IMF report, and more (we release similar deep dives every week).
For now, here’s what VC+ members get to see.
Your Shortcut to Understanding IMF’s World Economic Outlook
With long and short-term growth prospects declining for many countries around the world, this Special Dispatch offers a visual analysis of the key figures and takeaways from the IMF’s report including:
- The global decline in economic growth forecasts
- Real GDP growth and inflation forecasts for major nations in 2024
- When interest rate cuts will happen and interest rate forecasts
- How debt-to-GDP ratios have changed since 2000
- And much more!

Get the Full Breakdown in the Next VC+ Special Dispatch
VC+ members can access the full Special Dispatch by logging into the VC+ Archive, where you can also check out previous releases.
Make sure you join VC+ now to see exclusive charts and the full analysis of key takeaways from IMF’s World Economic Outlook.
Don’t miss out. Become a VC+ member today.
What You Get When You Become a VC+ Member
VC+ is Visual Capitalist’s premium subscription. As a member, you’ll get the following:
- Special Dispatches: Deep dive visual briefings on crucial reports and global trends
- Markets This Month: A snappy summary of the state of the markets and what to look out for
- The Trendline: Weekly curation of the best visualizations from across the globe
- Global Forecast Series: Our flagship annual report that covers everything you need to know related to the economy, markets, geopolitics, and the latest tech trends
- VC+ Archive: Hundreds of previously released VC+ briefings and reports that you’ve been missing out on, all in one dedicated hub
You can get all of the above, and more, by joining VC+ today.

-

 Mining1 week ago
Gold vs. S&P 500: Which Has Grown More Over Five Years?
-

 Markets2 weeks ago
Ranked: The Most Valuable Housing Markets in America
-

 Money2 weeks ago
Which States Have the Highest Minimum Wage in America?
-

 AI2 weeks ago
Ranked: Semiconductor Companies by Industry Revenue Share
-

 Markets2 weeks ago
Ranked: The World’s Top Flight Routes, by Revenue
-

 Countries2 weeks ago
Population Projections: The World’s 6 Largest Countries in 2075
-

 Markets2 weeks ago
The Top 10 States by Real GDP Growth in 2023
-

 Demographics2 weeks ago
The Smallest Gender Wage Gaps in OECD Countries