Economic Growth Forecasts for G7 and BRICS Countries in 2024
U.S. Debt Interest Payments Reach $1 Trillion
Ranked: The Largest U.S. Corporations by Number of Employees
The Top 10 States by Real GDP Growth in 2023
Ranked: The World’s Top Flight Routes, by Revenue
Visualizing AI Patents by Country
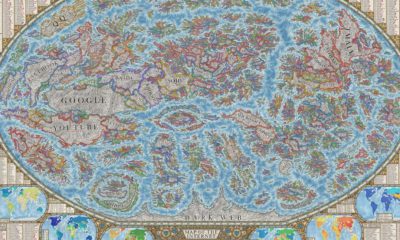
How Tech Logos Have Evolved Over Time
Ranked: Semiconductor Companies by Industry Revenue Share
The Stock Performance of U.S. Chipmakers So Far in 2024
Ranked: The Most Popular Smartphone Brands in the U.S.
Charted: Who Has Savings in This Economy?
How Debt-to-GDP Ratios Have Changed Since 2000
The Smallest Gender Wage Gaps in OECD Countries
Which States Have the Highest Minimum Wage in America?
Where Does One U.S. Tax Dollar Go?
The Cost of an EpiPen in Major Markets
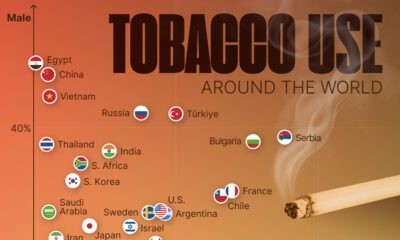
Charted: Global Tobacco Use by Country and Sex
Visualized: What Lives in Your Gut Microbiome?
Charted: Average Years Left to Live by Age
Charted: The Average Cost of Insulin By Country
Ranked: The Top 10 EV Battery Manufacturers in 2023
The World’s Biggest Nuclear Energy Producers
The World’s Biggest Oil Producers in 2023
How Much Does the U.S. Depend on Russian Uranium?
Charted: Global Uranium Reserves, by Country
The Largest Earthquakes in the New York Area (1970-2024)
Mapped: Average Wages Across Europe
Mapped: Asia’s Population Patterns by Density
A Map of Global Happiness By Country in 2024
Mapped: Population Growth by Region (1900-2050F)
Gold vs. S&P 500: Which Has Grown More Over Five Years?
Charted: The Value Gap Between the Gold Price and Gold Miners
The Periodic Table of Commodity Returns (2014-2023)
Ranking the Top 15 Countries by Carbon Tax Revenue
Ranked: The Countries With the Most Air Pollution in 2023
Top Countries By Forest Growth Since 2001
Ranked: Top Countries by Total Forest Loss Since 2001
The World’s Top Cocoa Producing Countries
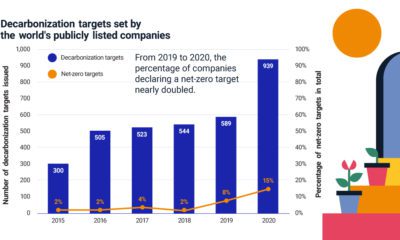
The Steps to Net-Zero Emissions To help prevent the worst effects of climate change, a growing number of companies are pledging to achieve net-zero emissions by...
Charting Global Tobacco Use by Country and Sex This was originally posted on our Voronoi app. Download the app for free on iOS or Android and...
...bonus gift ‘The Best of the VC+ Archive’. Hurry – only available for a limited time! Sign Up Now Need more information? Here’s what VC+ members...
To celebrate the launch of our 2023 Global Forecast Series, we’re offering all VC+ subscribers a bonus gift – ‘Our Best of VC+ in 2022’. BONUS...
...what the U.S. pays for the same achievement Which Countries Award the Highest Olympic Medal Bonus? For many of the world’s top athletes, simply representing their...
...ventures in this location. By accessing this website and other Company information, you agree to be bound by the following terms and conditions: Under no circumstances...
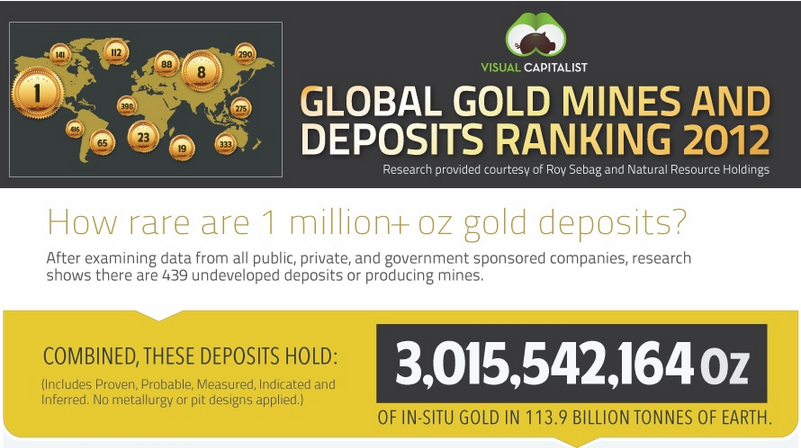
...difficult to draw the line as to what was a gold deposit vs. a copper deposit. In this year’s report we included deposits such as Reko...
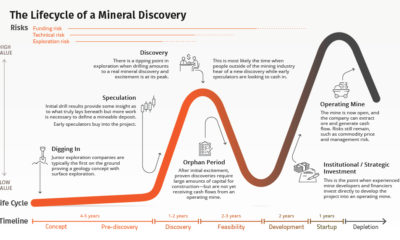
...of a Mineral Discovery In the life cycle of a mineral deposit, there are seven stages that each offer specific risks and rewards. As a company...
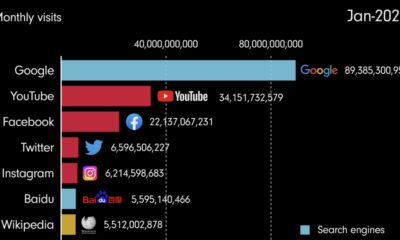
...the top, and the website is still the most popular website as of January 2022. The Late 2000s, Early 2010s: Social Media Enters the Chat While...
...spot Visual Capitalist? We’re right in between TechCrunch and The Guardian above. The colored borders represent a website’s logo or user interface. In terms of scale,...


 Creator Program