Markets
The $80 Trillion World Economy in One Chart
Check out the latest 2023 update of the world economy in one chart.
The $80 Trillion World Economy in One Chart
Check out the latest 2023 update of the world economy in one chart.
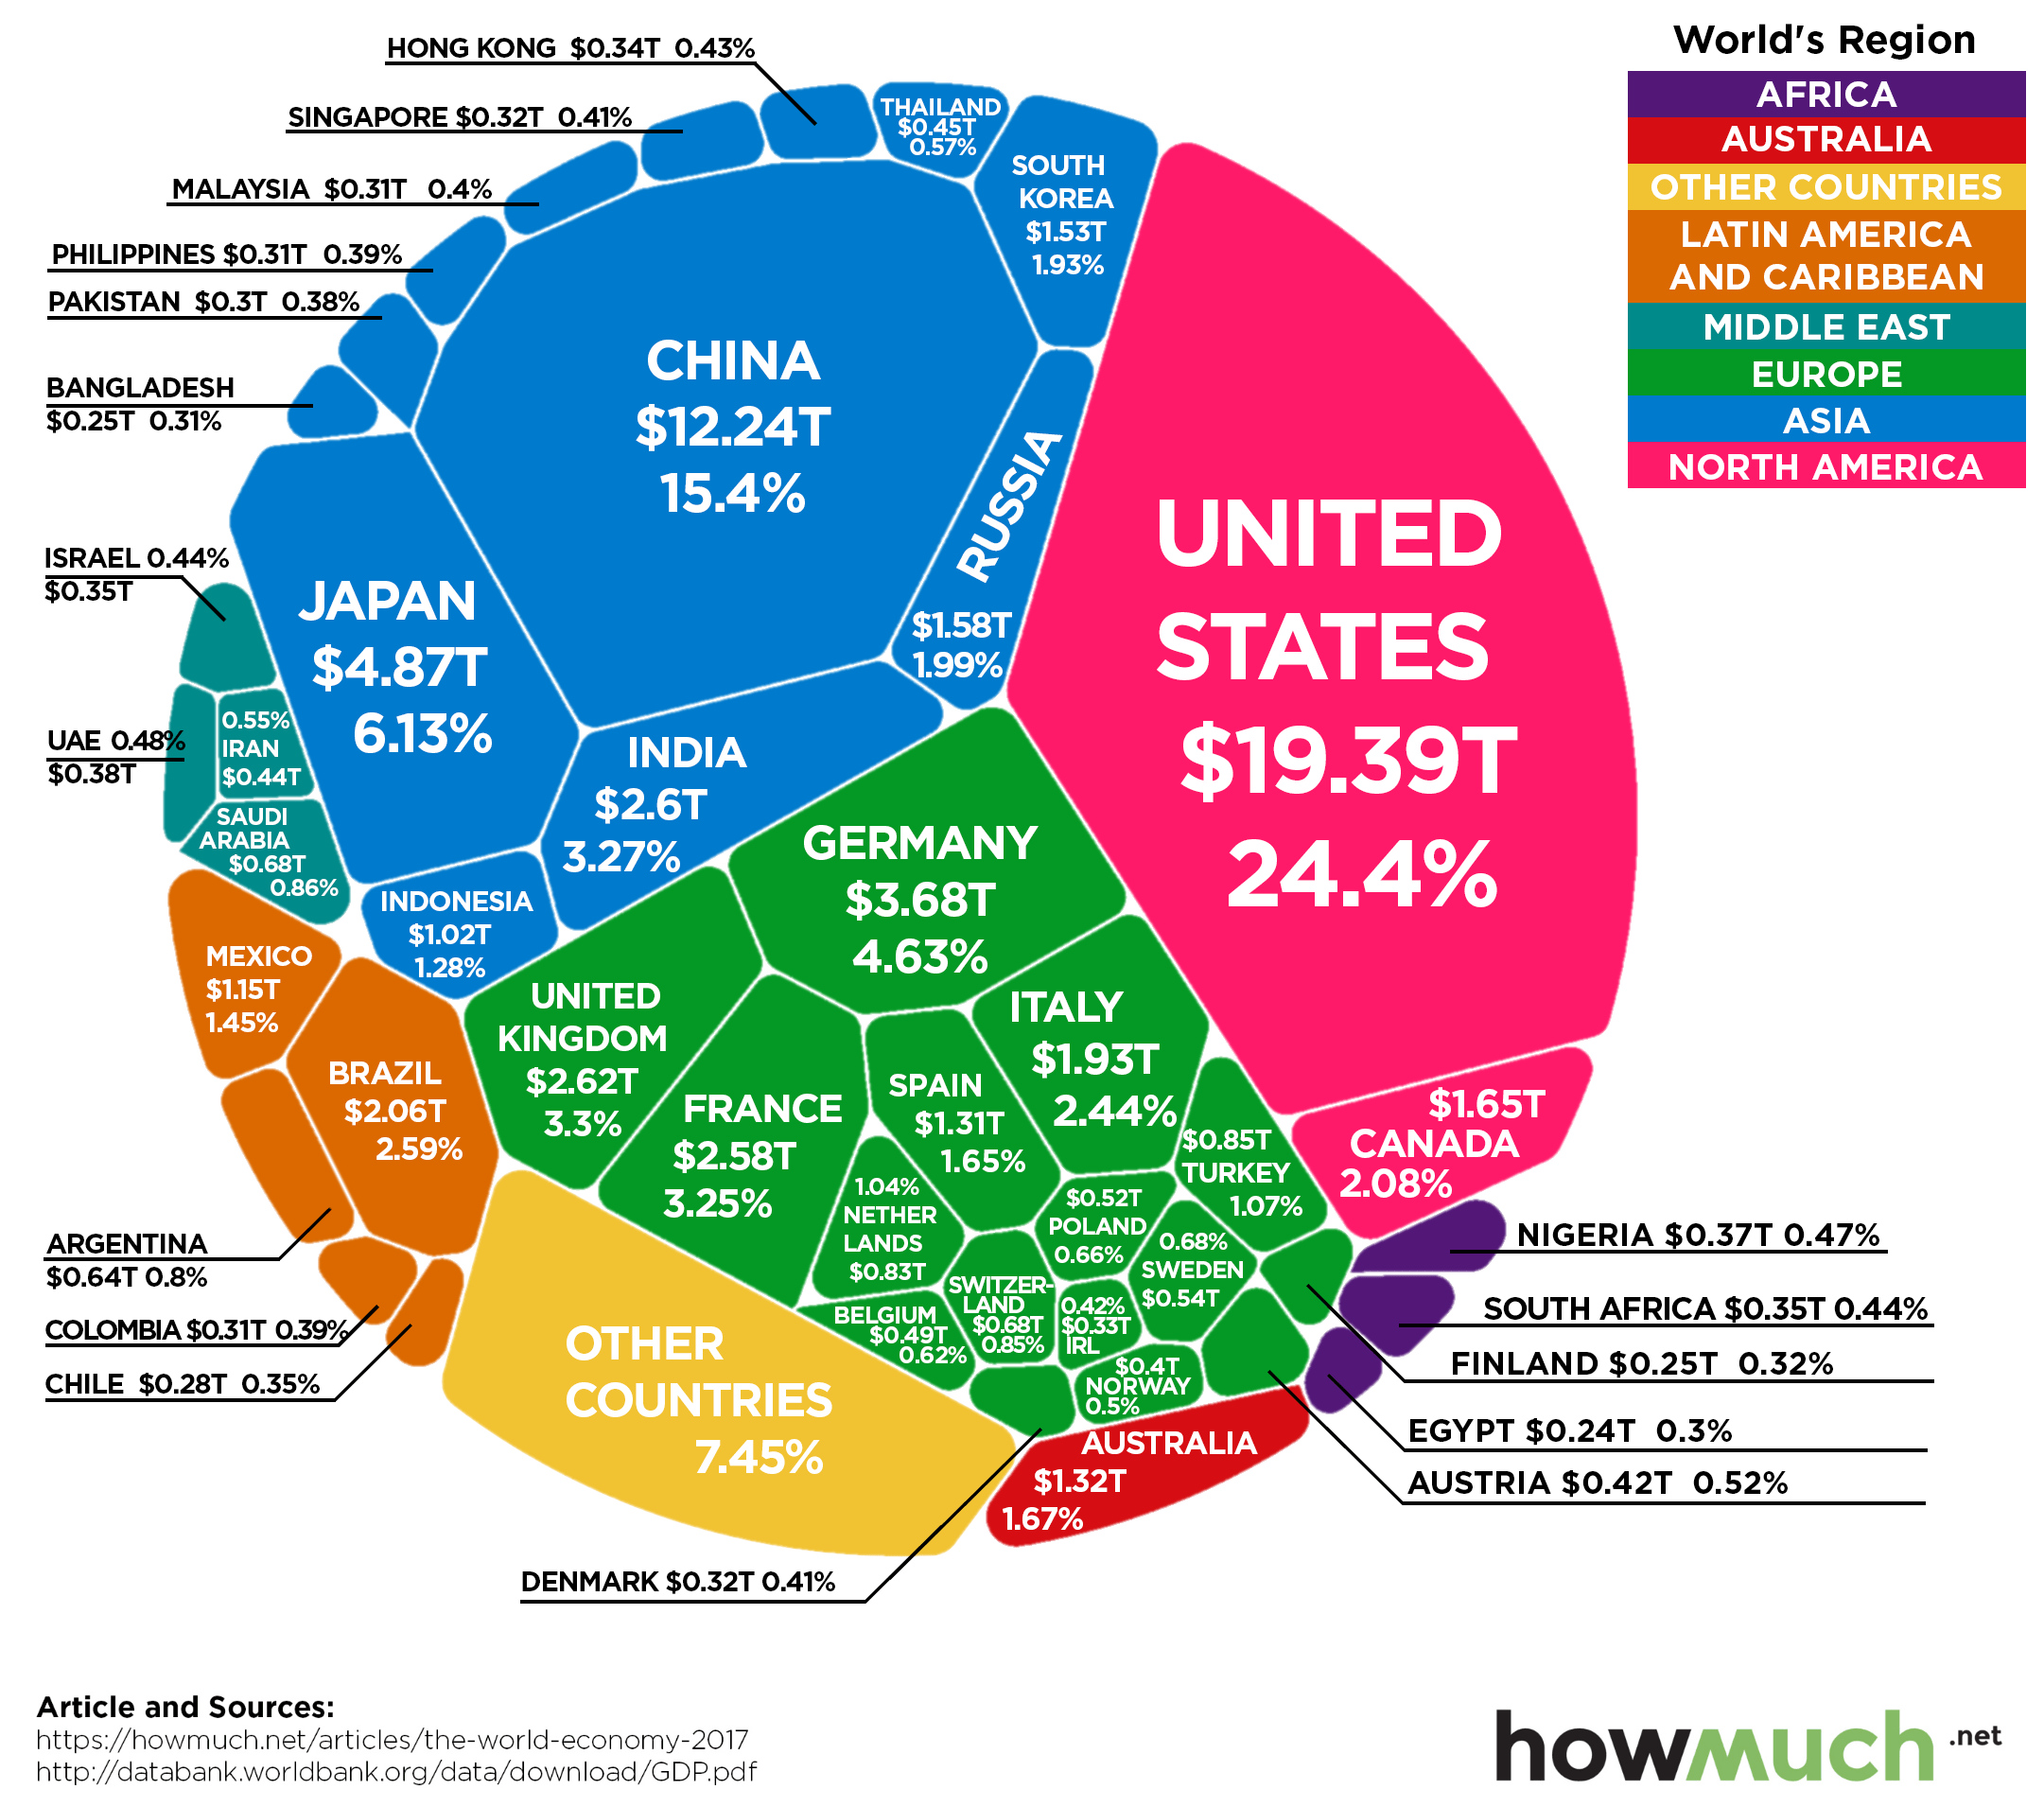
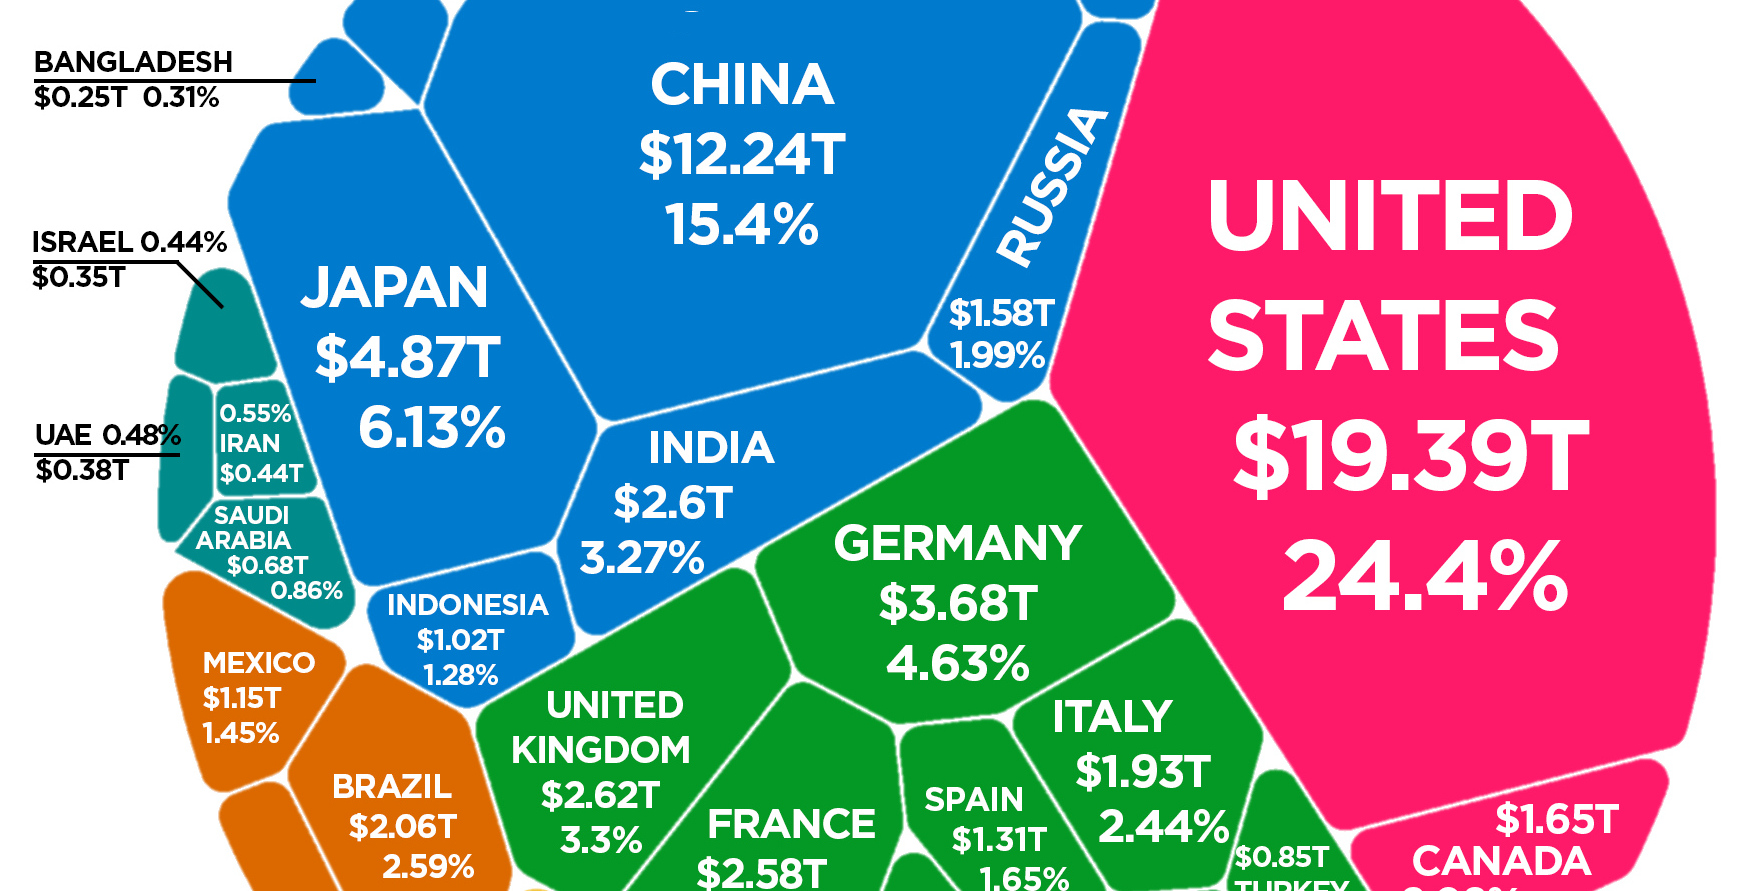
The latest estimate from the World Bank puts global GDP at roughly $80 trillion in nominal terms for 2017.
Today’s chart from HowMuch.net uses this data to show all major economies in a visualization called a Voronoi diagram – let’s dive into the stats to learn more.
The World’s Top 10 Economies
Here are the world’s top 10 economies, which together combine for a whopping two-thirds of global GDP.
| Rank | Country | GDP | % of Global GDP |
|---|---|---|---|
| #1 | United States | $19.4 trillion | 24.4% |
| #2 | China | $12.2 trillion | 15.4% |
| #3 | Japan | $4.87 trillion | 6.1% |
| #4 | Germany | $3.68 trillion | 4.6% |
| #5 | United Kingdom | $2.62 trillion | 3.3% |
| #6 | India | $2.60 trillion | 3.3% |
| #7 | France | $2.58 trillion | 3.3% |
| #8 | Brazil | $2.06 trillion | 2.6% |
| #9 | Italy | $1.93 trillion | 2.4% |
| #10 | Canada | $1.65 trillion | 2.1% |
In nominal terms, the U.S. still has the largest GDP at $19.4 trillion, making up 24.4% of the world economy.
While China’s economy is far behind in nominal terms at $12.2 trillion, you may recall that the Chinese economy has been the world’s largest when adjusted for purchasing power parity (PPP) since 2016.
The next two largest economies are Japan ($4.9 trillion) and Germany ($4.6 trillion) – and when added to the U.S. and China, the top four economies combined account for over 50% of the world economy.
Movers and Shakers
Over recent years, the list of top economies hasn’t changed much – and in a similar visualization we posted 18 months ago, the four aforementioned top economies all fell in the exact same order.
However, look outside of these incumbents, and you’ll see that the major forces shaping the future of the global economy are in full swing, especially when it comes to emerging markets.
Here are some of the most important movements:
India has now passed France in nominal terms with a $2.6 trillion economy, which is about 3.3% of the global total. In the most recent quarter, Indian GDP growth saw its highest growth rate in two years at about 8.2%.
Brazil, despite its very recent economic woes, surpassed Italy in GDP rankings to take the #8 spot overall.
Turkey has surpassed The Netherlands to become the world’s 17th largest economy, and Saudi Arabia has jumped past Switzerland to claim the 19th spot.


Markets
U.S. Debt Interest Payments Reach $1 Trillion
U.S. debt interest payments have surged past the $1 trillion dollar mark, amid high interest rates and an ever-expanding debt burden.


U.S. Debt Interest Payments Reach $1 Trillion
This was originally posted on our Voronoi app. Download the app for free on iOS or Android and discover incredible data-driven charts from a variety of trusted sources.
The cost of paying for America’s national debt crossed the $1 trillion dollar mark in 2023, driven by high interest rates and a record $34 trillion mountain of debt.
Over the last decade, U.S. debt interest payments have more than doubled amid vast government spending during the pandemic crisis. As debt payments continue to soar, the Congressional Budget Office (CBO) reported that debt servicing costs surpassed defense spending for the first time ever this year.
This graphic shows the sharp rise in U.S. debt payments, based on data from the Federal Reserve.
A $1 Trillion Interest Bill, and Growing
Below, we show how U.S. debt interest payments have risen at a faster pace than at another time in modern history:
| Date | Interest Payments | U.S. National Debt |
|---|---|---|
| 2023 | $1.0T | $34.0T |
| 2022 | $830B | $31.4T |
| 2021 | $612B | $29.6T |
| 2020 | $518B | $27.7T |
| 2019 | $564B | $23.2T |
| 2018 | $571B | $22.0T |
| 2017 | $493B | $20.5T |
| 2016 | $460B | $20.0T |
| 2015 | $435B | $18.9T |
| 2014 | $442B | $18.1T |
| 2013 | $425B | $17.2T |
| 2012 | $417B | $16.4T |
| 2011 | $433B | $15.2T |
| 2010 | $400B | $14.0T |
| 2009 | $354B | $12.3T |
| 2008 | $380B | $10.7T |
| 2007 | $414B | $9.2T |
| 2006 | $387B | $8.7T |
| 2005 | $355B | $8.2T |
| 2004 | $318B | $7.6T |
| 2003 | $294B | $7.0T |
| 2002 | $298B | $6.4T |
| 2001 | $318B | $5.9T |
| 2000 | $353B | $5.7T |
| 1999 | $353B | $5.8T |
| 1998 | $360B | $5.6T |
| 1997 | $368B | $5.5T |
| 1996 | $362B | $5.3T |
| 1995 | $357B | $5.0T |
| 1994 | $334B | $4.8T |
| 1993 | $311B | $4.5T |
| 1992 | $306B | $4.2T |
| 1991 | $308B | $3.8T |
| 1990 | $298B | $3.4T |
| 1989 | $275B | $3.0T |
| 1988 | $254B | $2.7T |
| 1987 | $240B | $2.4T |
| 1986 | $225B | $2.2T |
| 1985 | $219B | $1.9T |
| 1984 | $205B | $1.7T |
| 1983 | $176B | $1.4T |
| 1982 | $157B | $1.2T |
| 1981 | $142B | $1.0T |
| 1980 | $113B | $930.2B |
| 1979 | $96B | $845.1B |
| 1978 | $84B | $789.2B |
| 1977 | $69B | $718.9B |
| 1976 | $61B | $653.5B |
| 1975 | $55B | $576.6B |
| 1974 | $50B | $492.7B |
| 1973 | $45B | $469.1B |
| 1972 | $39B | $448.5B |
| 1971 | $36B | $424.1B |
| 1970 | $35B | $389.2B |
| 1969 | $30B | $368.2B |
| 1968 | $25B | $358.0B |
| 1967 | $23B | $344.7B |
| 1966 | $21B | $329.3B |
Interest payments represent seasonally adjusted annual rate at the end of Q4.
At current rates, the U.S. national debt is growing by a remarkable $1 trillion about every 100 days, equal to roughly $3.6 trillion per year.
As the national debt has ballooned, debt payments even exceeded Medicaid outlays in 2023—one of the government’s largest expenditures. On average, the U.S. spent more than $2 billion per day on interest costs last year. Going further, the U.S. government is projected to spend a historic $12.4 trillion on interest payments over the next decade, averaging about $37,100 per American.
Exacerbating matters is that the U.S. is running a steep deficit, which stood at $1.1 trillion for the first six months of fiscal 2024. This has accelerated due to the 43% increase in debt servicing costs along with a $31 billion dollar increase in defense spending from a year earlier. Additionally, a $30 billion increase in funding for the Federal Deposit Insurance Corporation in light of the regional banking crisis last year was a major contributor to the deficit increase.
Overall, the CBO forecasts that roughly 75% of the federal deficit’s increase will be due to interest costs by 2034.

-

 Real Estate2 weeks ago
Visualizing America’s Shortage of Affordable Homes
-

 Technology1 week ago
Ranked: Semiconductor Companies by Industry Revenue Share
-

 Money1 week ago
Which States Have the Highest Minimum Wage in America?
-

 Real Estate1 week ago
Ranked: The Most Valuable Housing Markets in America
-

 Business2 weeks ago
Charted: Big Four Market Share by S&P 500 Audits
-

 AI2 weeks ago
The Stock Performance of U.S. Chipmakers So Far in 2024
-

 Misc2 weeks ago
Almost Every EV Stock is Down After Q1 2024
-

 Money2 weeks ago
Where Does One U.S. Tax Dollar Go?