Markets
$69 Trillion of World Debt in One Infographic
Get this infographic as a poster (and save 15% by being a VC+ member)


$69 Trillion of World Debt in One Infographic
Two decades ago, total government debt was estimated to sit at $20 trillion.
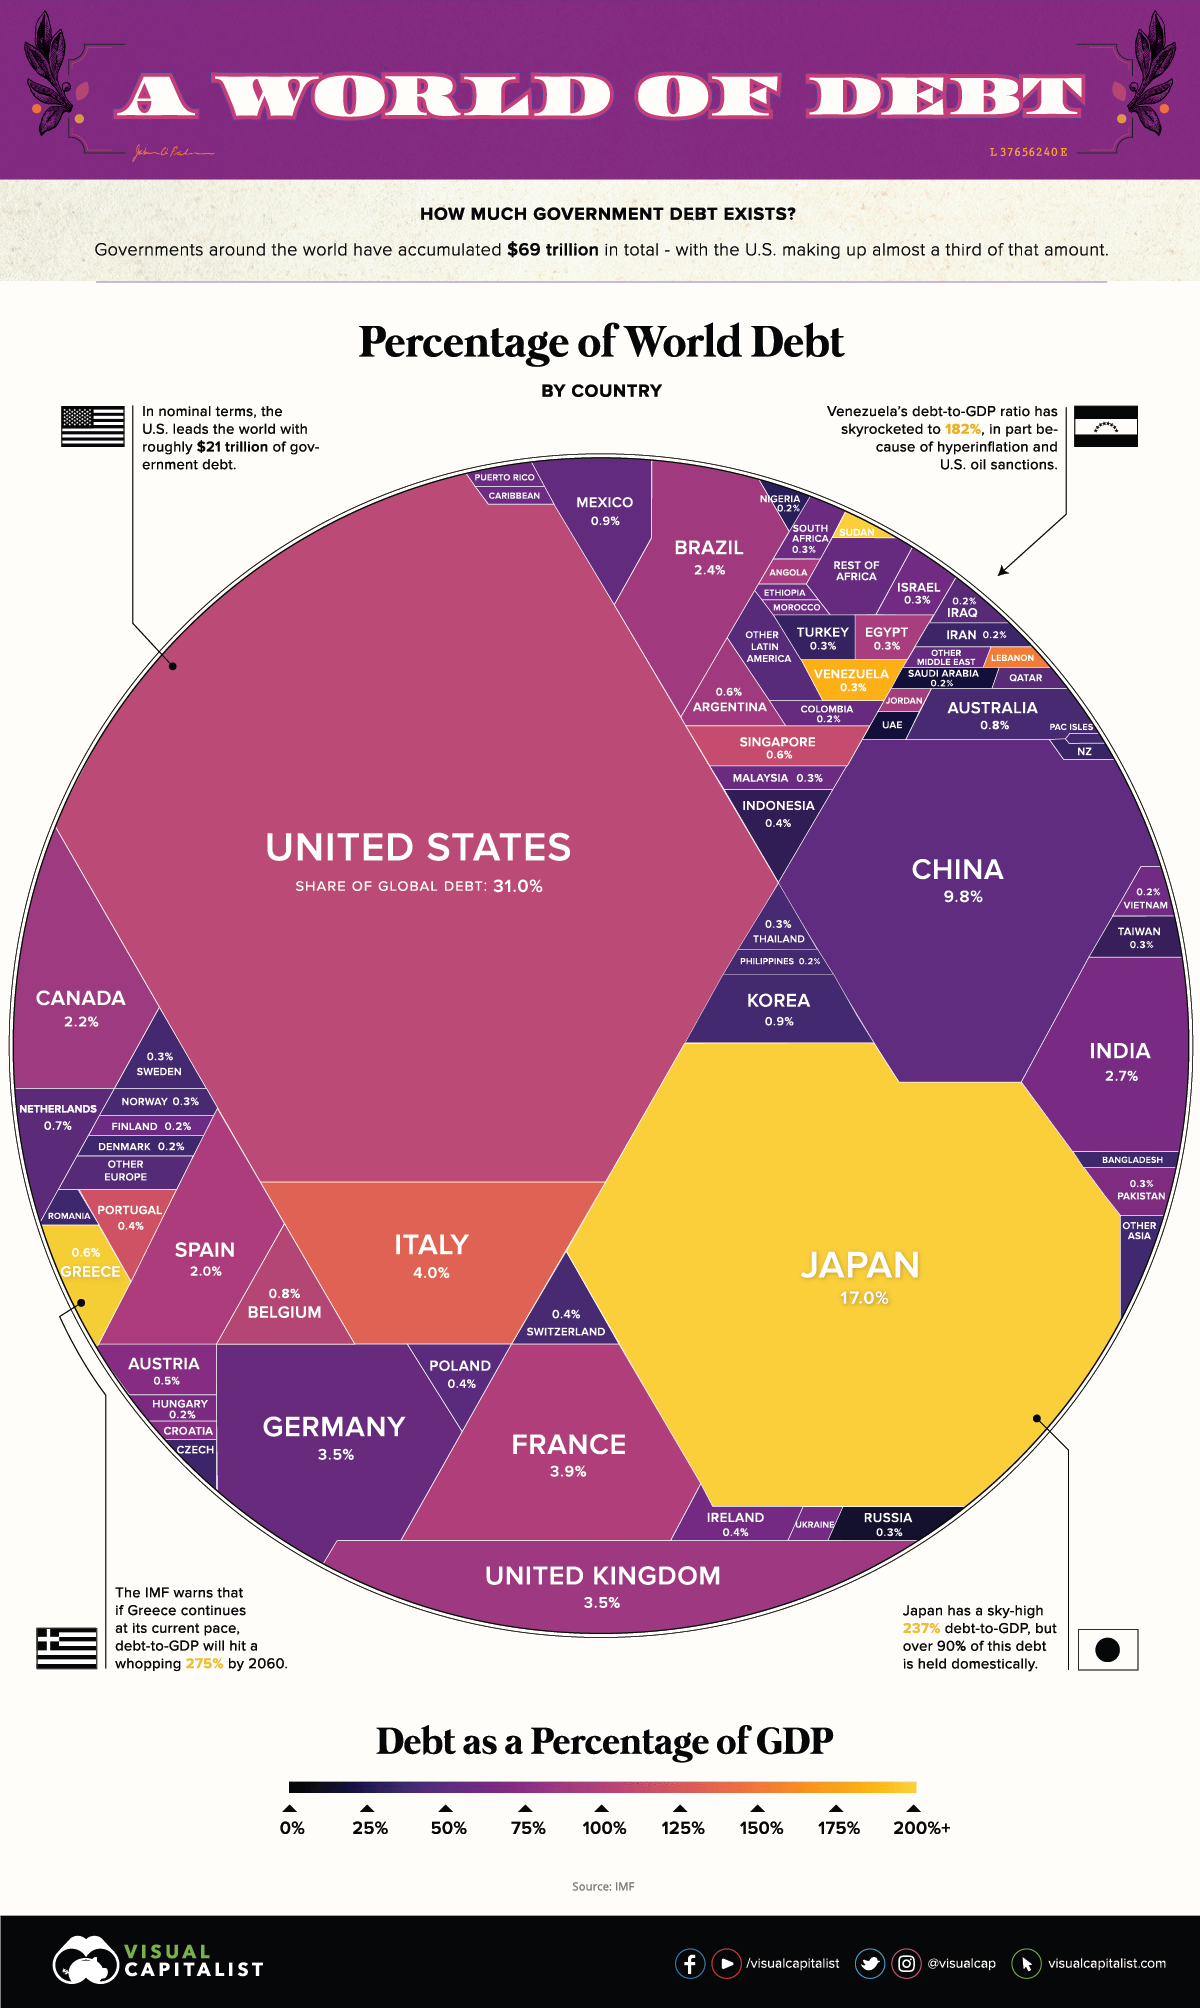
Since then, according to the latest figures by the IMF, the number has ballooned to $69.3 trillion with a debt to GDP ratio of 82% — the highest totals in human history.
Which countries owe the most money, and how do these figures compare?
The Regional Breakdown
Let’s start by looking at the continental level, to get an idea of how world debt is divided from a geographical perspective:
| Region | Debt to GDP | Gross Debt (Billions of USD) | % of Total World Debt |
|---|---|---|---|
| Asia and Pacific | 79.8% | $24,120 | 34.8% |
| North America | 100.4% | $23,710 | 34.2% |
| Europe | 74.2% | $16,225 | 23.4% |
| South America | 75.0% | $2,699 | 3.9% |
| Africa | 56.9% | $1,313 | 1.9% |
| Other | 37.1% | $1,231 | 1.8% |
| World | 81.8% | $69,298 | 100.0% |
In absolute terms, over 90% of global debt is concentrated in North America, Asia Pacific, and Europe — meanwhile, regions like Africa, South America, and other account for less than 10%.
This is not surprising, since advanced economies hold most of the world’s debt (about 75.4%), while emerging or developing economies hold the rest.
World Debt by Country
Now let’s look at individual countries, according to data released by the IMF in October 2019.
It’s worth mentioning that the following numbers are representative of 2018 data, and that for a tiny subset of countries (i.e. Syria) we used the latest available numbers as an estimate.
| Rank | Country | Debt to GDP | Gross Debt ($B) | % of World Total |
|---|---|---|---|---|
| #1 | 🇺🇸 United States | 104.3% | $21,465 | 31.0% |
| #2 | 🇯🇵 Japan | 237.1% | $11,788 | 17.0% |
| #3 | 🇨🇳 China, People's Republic of | 50.6% | $6,764 | 9.8% |
| #4 | 🇮🇹 Italy | 132.2% | $2,744 | 4.0% |
| #5 | 🇫🇷 France | 98.4% | $2,736 | 3.9% |
| #6 | 🇬🇧 United Kingdom | 86.8% | $2,455 | 3.5% |
| #7 | 🇩🇪 Germany | 61.7% | $2,438 | 3.5% |
| #8 | 🇮🇳 India | 68.1% | $1,851 | 2.7% |
| #9 | 🇧🇷 Brazil | 87.9% | $1,642 | 2.4% |
| #10 | 🇨🇦 Canada | 89.9% | $1,540 | 2.2% |
| #11 | 🇪🇸 Spain | 97.1% | $1,386 | 2.0% |
| #12 | 🇲🇽 Mexico | 53.6% | $655 | 0.9% |
| #13 | 🇰🇷 Korea, Republic of | 37.9% | $652 | 0.9% |
| #14 | 🇦🇺 Australia | 41.4% | $588 | 0.8% |
| #15 | 🇧🇪 Belgium | 102.0% | $543 | 0.8% |
| #16 | Netherlands | 52.4% | $479 | 0.7% |
| #17 | Argentina | 86.1% | $447 | 0.6% |
| #18 | Singapore | 113.6% | $414 | 0.6% |
| #19 | Greece | 184.9% | $404 | 0.6% |
| #20 | Austria | 73.8% | $337 | 0.5% |
| #21 | Indonesia | 30.1% | $308 | 0.4% |
| #22 | Portugal | 120.1% | $289 | 0.4% |
| #23 | Poland | 48.9% | $286 | 0.4% |
| #24 | Switzerland | 40.5% | $286 | 0.4% |
| #25 | Ireland | 63.7% | $244 | 0.4% |
| #26 | Russian Federation | 14.6% | $242 | 0.3% |
| #27 | Turkey | 30.2% | $233 | 0.3% |
| #28 | Egypt | 92.7% | $231 | 0.3% |
| #29 | Pakistan | 71.7% | $226 | 0.3% |
| #30 | Israel | 60.8% | $225 | 0.3% |
| #31 | Sweden | 38.5% | $214 | 0.3% |
| #32 | Thailand | 42.1% | $213 | 0.3% |
| #33 | South Africa | 56.7% | $209 | 0.3% |
| #34 | Taiwan Province of China | 35.1% | $207 | 0.3% |
| #35 | Malaysia | 55.6% | $199 | 0.3% |
| #36 | Venezuela | 182.4% | $180 | 0.3% |
| #37 | Norway | 40.0% | $174 | 0.3% |
| #38 | Colombia | 52.2% | $173 | 0.2% |
| #39 | Finland | 59.3% | $163 | 0.2% |
| #40 | Saudi Arabia | 19.0% | $149 | 0.2% |
| #41 | Iran | 32.2% | $144 | 0.2% |
| #42 | Vietnam | 55.6% | $134 | 0.2% |
| #43 | Philippines | 38.9% | $129 | 0.2% |
| #44 | Denmark | 34.3% | $121 | 0.2% |
| #45 | Hungary | 70.8% | $114 | 0.2% |
| #46 | Iraq | 49.3% | $111 | 0.2% |
| #47 | Nigeria | 27.3% | $109 | 0.2% |
| #48 | Bangladesh | 34.0% | $98.1 | 0.14% |
| #49 | Angola | 89.0% | $94.3 | 0.14% |
| #50 | Qatar | 48.6% | $93.0 | 0.13% |
| #51 | Romania | 36.7% | $87.9 | 0.13% |
| #52 | Lebanon | 151.0% | $85.1 | 0.12% |
| #53 | Czech Republic | 32.6% | $79.9 | 0.12% |
| #54 | United Arab Emirates | 19.1% | $79.1 | 0.11% |
| #55 | Ukraine | 60.2% | $78.8 | 0.11% |
| #56 | Morocco | 65.0% | $77.0 | 0.11% |
| #57 | Chile | 25.6% | $76.3 | 0.11% |
| #58 | Sri Lanka | 83.3% | $74.1 | 0.11% |
| #59 | Sudan | 212.1% | $72.7 | 0.10% |
| #60 | Algeria | 38.3% | $66.5 | 0.10% |
| #61 | New Zealand | 29.8% | $60.5 | 0.09% |
| #62 | Peru | 26.1% | $58.8 | 0.08% |
| #63 | Puerto Rico | 55.5% | $56.1 | 0.08% |
| #64 | Kenya | 60.1% | $52.8 | 0.08% |
| #65 | Slovak Republic | 48.9% | $52.1 | 0.08% |
| #66 | Ecuador | 45.8% | $49.6 | 0.07% |
| #67 | Ethiopia | 61.0% | $49.0 | 0.07% |
| #68 | Croatia | 74.6% | $45.4 | 0.07% |
| #69 | Dominican Republic | 50.5% | $43.2 | 0.06% |
| #70 | Oman | 53.4% | $42.3 | 0.06% |
| #71 | Jordan | 94.4% | $39.9 | 0.06% |
| #72 | Ghana | 59.3% | $38.9 | 0.06% |
| #73 | Slovenia | 70.4% | $38.1 | 0.05% |
| #74 | Uruguay | 63.5% | $37.9 | 0.05% |
| #75 | Kazakhstan | 21.0% | $36.3 | 0.05% |
| #76 | Bahrain | 94.7% | $35.7 | 0.05% |
| #77 | Costa Rica | 53.5% | $32.3 | 0.05% |
| #78 | Tunisia | 77.0% | $30.7 | 0.04% |
| #79 | Belarus | 47.8% | $28.5 | 0.04% |
| #80 | Serbia | 54.5% | $27.5 | 0.04% |
| #81 | Myanmar | 38.2% | $26.2 | 0.04% |
| #82 | Panama | 39.5% | $25.7 | 0.04% |
| #83 | Cyprus | 102.5% | $25.1 | 0.04% |
| #84 | Côte d'Ivoire | 53.2% | $22.9 | 0.03% |
| #85 | Bolivia | 53.8% | $21.8 | 0.03% |
| #86 | Tanzania | 37.3% | $21.2 | 0.03% |
| #87 | Zambia | 78.1% | $20.9 | 0.03% |
| #88 | Kuwait | 14.7% | $20.8 | 0.03% |
| #89 | Guatemala | 24.7% | $19.4 | 0.03% |
| #90 | Lithuania | 34.2% | $18.2 | 0.03% |
| #91 | Syria | 30.0% | $18.0 | 0.03% |
| #92 | Yemen | 64.8% | $17.9 | 0.03% |
| #93 | El Salvador | 67.1% | $17.5 | 0.03% |
| #94 | Cameroon | 39.1% | $15.1 | 0.02% |
| #95 | Luxembourg | 21.4% | $14.9 | 0.02% |
| #96 | Jamaica | 94.4% | $14.6 | 0.02% |
| #97 | Senegal | 61.6% | $14.5 | 0.02% |
| #98 | Mozambique | 99.8% | $14.4 | 0.02% |
| #99 | Bulgaria | 20.4% | $13.3 | 0.02% |
| #100 | Latvia | 35.9% | $12.5 | 0.02% |
| #101 | Turkmenistan | 29.1% | $11.9 | 0.02% |
| #102 | Uganda | 41.4% | $11.6 | 0.02% |
| #103 | Albania | 69.9% | $10.5 | 0.02% |
| #104 | Uzbekistan | 20.6% | $10.4 | 0.02% |
| #105 | Lao P.D.R. | 57.2% | $10.4 | 0.01% |
| #106 | Gabon | 60.7% | $10.2 | 0.01% |
| #107 | Congo, Republic of | 87.8% | $10.2 | 0.01% |
| #108 | Trinidad and Tobago | 45.1% | $10.2 | 0.01% |
| #109 | Iceland | 37.6% | $9.8 | 0.01% |
| #110 | Honduras | 40.2% | $9.6 | 0.01% |
| #111 | Mauritius | 66.2% | $9.4 | 0.01% |
| #112 | Paraguay | 21.5% | $9.0 | 0.01% |
| #113 | Azerbaijan | 18.8% | $8.8 | 0.01% |
| #114 | Nepal | 30.2% | $8.8 | 0.01% |
| #115 | Papua New Guinea | 35.5% | $8.2 | 0.01% |
| #116 | Bahamas, The | 63.3% | $7.9 | 0.01% |
| #117 | Zimbabwe | 37.1% | $7.8 | 0.01% |
| #118 | Georgia | 44.9% | $7.3 | 0.01% |
| #119 | Congo, Dem. Rep. of the | 15.3% | $7.2 | 0.01% |
| #120 | Cambodia | 28.6% | $7.0 | 0.01% |
| #121 | Bosnia and Herzegovina | 34.3% | $6.9 | 0.01% |
| #122 | Namibia | 45.8% | $6.6 | 0.01% |
| #123 | Malta | 45.2% | $6.6 | 0.01% |
| #124 | Mali | 37.3% | $6.4 | 0.01% |
| #125 | Barbados | 125.7% | $6.4 | 0.01% |
| #126 | Armenia | 51.3% | $6.4 | 0.01% |
| #127 | Burkina Faso | 42.9% | $6.1 | 0.01% |
| #128 | Equatorial Guinea | 43.3% | $5.9 | 0.01% |
| #129 | Benin | 41.0% | $5.9 | 0.01% |
| #130 | Madagascar | 45.7% | $5.5 | 0.01% |
| #131 | Chad | 48.3% | $5.3 | 0.01% |
| #132 | North Macedonia | 40.5% | $5.1 | 0.01% |
| #133 | Niger | 53.8% | $5.0 | 0.01% |
| #134 | Nicaragua | 37.2% | $4.9 | 0.01% |
| #135 | Guinea | 38.2% | $4.6 | 0.01% |
| #136 | Kyrgyz Republic | 56.0% | $4.5 | 0.01% |
| #137 | Mauritania | 82.9% | $4.3 | 0.01% |
| #138 | Malawi | 62.9% | $4.3 | 0.01% |
| #139 | Togo | 76.2% | $4.1 | 0.01% |
| #140 | Montenegro | 72.6% | $4.0 | 0.01% |
| #141 | Rwanda | 40.7% | $3.9 | 0.01% |
| #142 | Maldives | 68.0% | $3.6 | 0.01% |
| #143 | Tajikistan | 47.9% | $3.6 | 0.01% |
| #144 | Eritrea | 174.3% | $3.5 | 0.01% |
| #145 | Moldova | 29.7% | $3.4 | 0.00% |
| #146 | Haiti | 33.3% | $3.2 | 0.00% |
| #147 | Bhutan | 102.4% | $2.6 | 0.00% |
| #148 | Sierra Leone | 63.0% | $2.6 | 0.00% |
| #149 | Estonia | 8.3% | $2.6 | 0.00% |
| #150 | Fiji | 46.2% | $2.6 | 0.00% |
| #151 | Suriname | 72.8% | $2.5 | 0.00% |
| #152 | Cabo Verde | 124.5% | $2.5 | 0.00% |
| #153 | Aruba | 84.5% | $2.4 | 0.00% |
| #154 | Botswana | 12.1% | $2.3 | 0.00% |
| #155 | Guyana | 52.9% | $2.1 | 0.00% |
| #156 | Burundi | 58.4% | $2.0 | 0.00% |
| #157 | South Sudan, Republic of | 42.2% | $1.9 | 0.00% |
| #158 | Belize | 95.2% | $1.8 | 0.00% |
| #159 | Eswatini | 35.2% | $1.7 | 0.00% |
| #160 | Antigua and Barbuda | 89.5% | $1.4 | 0.00% |
| #161 | Gambia, The | 86.6% | $1.4 | 0.00% |
| #162 | Djibouti | 48.0% | $1.4 | 0.00% |
| #163 | Afghanistan | 6.9% | $1.4 | 0.00% |
| #164 | Kosovo | 17.0% | $1.4 | 0.00% |
| #165 | Liberia | 39.9% | $1.3 | 0.00% |
| #166 | San Marino | 77.9% | $1.3 | 0.00% |
| #167 | Saint Lucia | 64.3% | $1.2 | 0.00% |
| #168 | Lesotho | 44.5% | $1.2 | 0.00% |
| #169 | Central African Republic | 49.9% | $1.1 | 0.00% |
| #170 | Guinea-Bissau | 64.3% | $0.9 | 0.00% |
| #171 | Seychelles | 56.9% | $0.9 | 0.00% |
| #172 | Grenada | 63.5% | $0.8 | 0.00% |
| #173 | Saint Vincent and the Grenadines | 74.5% | $0.6 | 0.00% |
| #174 | Saint Kitts and Nevis | 60.5% | $0.6 | 0.00% |
| #175 | Vanuatu | 51.4% | $0.5 | 0.00% |
| #176 | Samoa | 50.3% | $0.4 | 0.00% |
| #177 | Dominica | 74.1% | $0.4 | 0.00% |
| #178 | Hong Kong SAR | 0.1% | $0.4 | 0.00% |
| #179 | Brunei Darussalam | 2.6% | $0.4 | 0.00% |
| #180 | São Tomé and Príncipe | 74.5% | $0.3 | 0.00% |
| #181 | Comoros | 21.0% | $0.2 | 0.00% |
| #182 | Timor-Leste | 6.1% | $0.2 | 0.00% |
| #183 | Solomon Islands | 9.4% | $0.1 | 0.00% |
| #184 | Micronesia, Fed. States of | 20.3% | $0.1 | 0.00% |
| #185 | Nauru | 58.3% | $0.1 | 0.00% |
| #186 | Marshall Islands | 25.2% | $0.1 | 0.00% |
| #187 | Kiribati | 20.6% | $0.0 | 0.00% |
| #188 | Tuvalu | 28.1% | $0.0 | 0.00% |
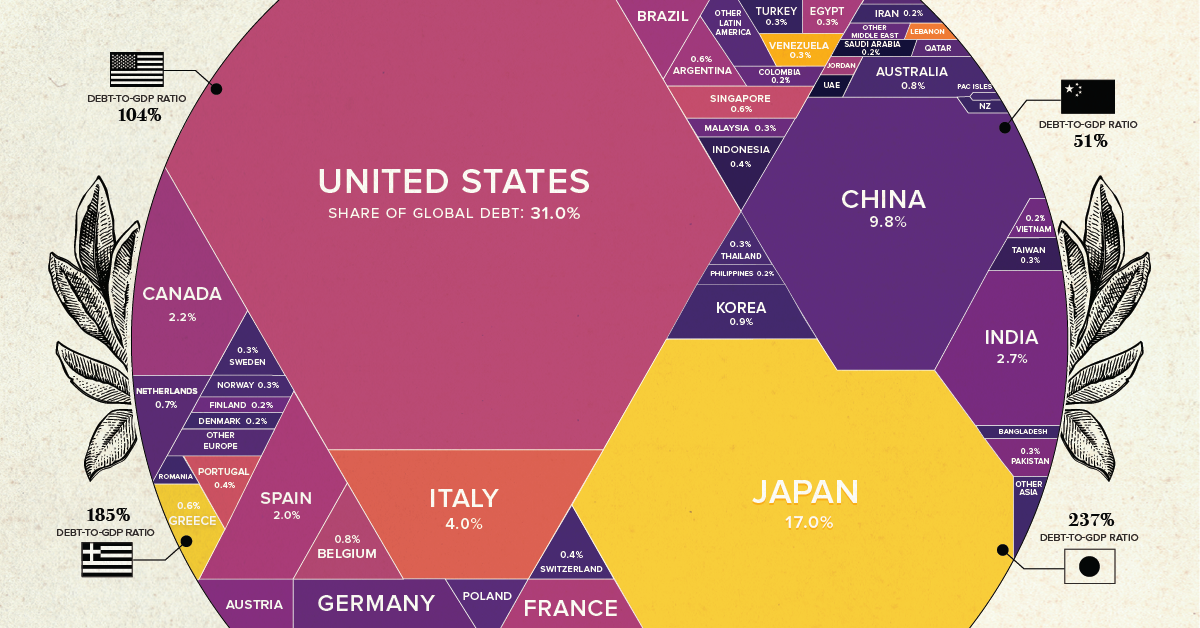
In absolute terms, the most indebted nation is the United States, which has a gross debt of $21.5 trillion according to the IMF as of 2018.
If you’re looking for a more precise figure for 2019, the U.S. government’s “Debt to the Penny” dataset puts the amount owing to exactly $23,015,089,744,090.63 as of November 12, 2019.
Of course, the U.S. is also the world’s largest economy in nominal terms, putting the debt to GDP ratio at 104.3%
Other stand outs from the list above include Japan, which has the highest debt to GDP ratio (237.1%), and China , which has increased government debt by almost $2 trillion in just the last two years. Meanwhile, the European economies of Italy and Belgium check the box as other large debtors with ratios topping 100% debt to GDP.


Markets
U.S. Debt Interest Payments Reach $1 Trillion
U.S. debt interest payments have surged past the $1 trillion dollar mark, amid high interest rates and an ever-expanding debt burden.


U.S. Debt Interest Payments Reach $1 Trillion
This was originally posted on our Voronoi app. Download the app for free on iOS or Android and discover incredible data-driven charts from a variety of trusted sources.
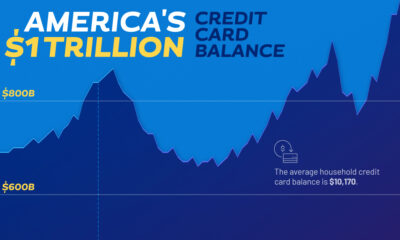
The cost of paying for America’s national debt crossed the $1 trillion dollar mark in 2023, driven by high interest rates and a record $34 trillion mountain of debt.
Over the last decade, U.S. debt interest payments have more than doubled amid vast government spending during the pandemic crisis. As debt payments continue to soar, the Congressional Budget Office (CBO) reported that debt servicing costs surpassed defense spending for the first time ever this year.
This graphic shows the sharp rise in U.S. debt payments, based on data from the Federal Reserve.
A $1 Trillion Interest Bill, and Growing
Below, we show how U.S. debt interest payments have risen at a faster pace than at another time in modern history:
| Date | Interest Payments | U.S. National Debt |
|---|---|---|
| 2023 | $1.0T | $34.0T |
| 2022 | $830B | $31.4T |
| 2021 | $612B | $29.6T |
| 2020 | $518B | $27.7T |
| 2019 | $564B | $23.2T |
| 2018 | $571B | $22.0T |
| 2017 | $493B | $20.5T |
| 2016 | $460B | $20.0T |
| 2015 | $435B | $18.9T |
| 2014 | $442B | $18.1T |
| 2013 | $425B | $17.2T |
| 2012 | $417B | $16.4T |
| 2011 | $433B | $15.2T |
| 2010 | $400B | $14.0T |
| 2009 | $354B | $12.3T |
| 2008 | $380B | $10.7T |
| 2007 | $414B | $9.2T |
| 2006 | $387B | $8.7T |
| 2005 | $355B | $8.2T |
| 2004 | $318B | $7.6T |
| 2003 | $294B | $7.0T |
| 2002 | $298B | $6.4T |
| 2001 | $318B | $5.9T |
| 2000 | $353B | $5.7T |
| 1999 | $353B | $5.8T |
| 1998 | $360B | $5.6T |
| 1997 | $368B | $5.5T |
| 1996 | $362B | $5.3T |
| 1995 | $357B | $5.0T |
| 1994 | $334B | $4.8T |
| 1993 | $311B | $4.5T |
| 1992 | $306B | $4.2T |
| 1991 | $308B | $3.8T |
| 1990 | $298B | $3.4T |
| 1989 | $275B | $3.0T |
| 1988 | $254B | $2.7T |
| 1987 | $240B | $2.4T |
| 1986 | $225B | $2.2T |
| 1985 | $219B | $1.9T |
| 1984 | $205B | $1.7T |
| 1983 | $176B | $1.4T |
| 1982 | $157B | $1.2T |
| 1981 | $142B | $1.0T |
| 1980 | $113B | $930.2B |
| 1979 | $96B | $845.1B |
| 1978 | $84B | $789.2B |
| 1977 | $69B | $718.9B |
| 1976 | $61B | $653.5B |
| 1975 | $55B | $576.6B |
| 1974 | $50B | $492.7B |
| 1973 | $45B | $469.1B |
| 1972 | $39B | $448.5B |
| 1971 | $36B | $424.1B |
| 1970 | $35B | $389.2B |
| 1969 | $30B | $368.2B |
| 1968 | $25B | $358.0B |
| 1967 | $23B | $344.7B |
| 1966 | $21B | $329.3B |
Interest payments represent seasonally adjusted annual rate at the end of Q4.
At current rates, the U.S. national debt is growing by a remarkable $1 trillion about every 100 days, equal to roughly $3.6 trillion per year.
As the national debt has ballooned, debt payments even exceeded Medicaid outlays in 2023—one of the government’s largest expenditures. On average, the U.S. spent more than $2 billion per day on interest costs last year. Going further, the U.S. government is projected to spend a historic $12.4 trillion on interest payments over the next decade, averaging about $37,100 per American.
Exacerbating matters is that the U.S. is running a steep deficit, which stood at $1.1 trillion for the first six months of fiscal 2024. This has accelerated due to the 43% increase in debt servicing costs along with a $31 billion dollar increase in defense spending from a year earlier. Additionally, a $30 billion increase in funding for the Federal Deposit Insurance Corporation in light of the regional banking crisis last year was a major contributor to the deficit increase.
Overall, the CBO forecasts that roughly 75% of the federal deficit’s increase will be due to interest costs by 2034.

-

 Maps2 weeks ago
Mapped: Average Wages Across Europe
-

 Money1 week ago
Which States Have the Highest Minimum Wage in America?
-

 Real Estate1 week ago
Ranked: The Most Valuable Housing Markets in America
-

 Markets1 week ago
Charted: Big Four Market Share by S&P 500 Audits
-

 AI1 week ago
The Stock Performance of U.S. Chipmakers So Far in 2024
-

 Automotive2 weeks ago
Almost Every EV Stock is Down After Q1 2024
-

 Money2 weeks ago
Where Does One U.S. Tax Dollar Go?
-

 Green2 weeks ago
Ranked: Top Countries by Total Forest Loss Since 2001