Markets
$69 Trillion of World Debt in One Infographic
Get this infographic as a poster (and save 15% by being a VC+ member)


$69 Trillion of World Debt in One Infographic
Two decades ago, total government debt was estimated to sit at $20 trillion.
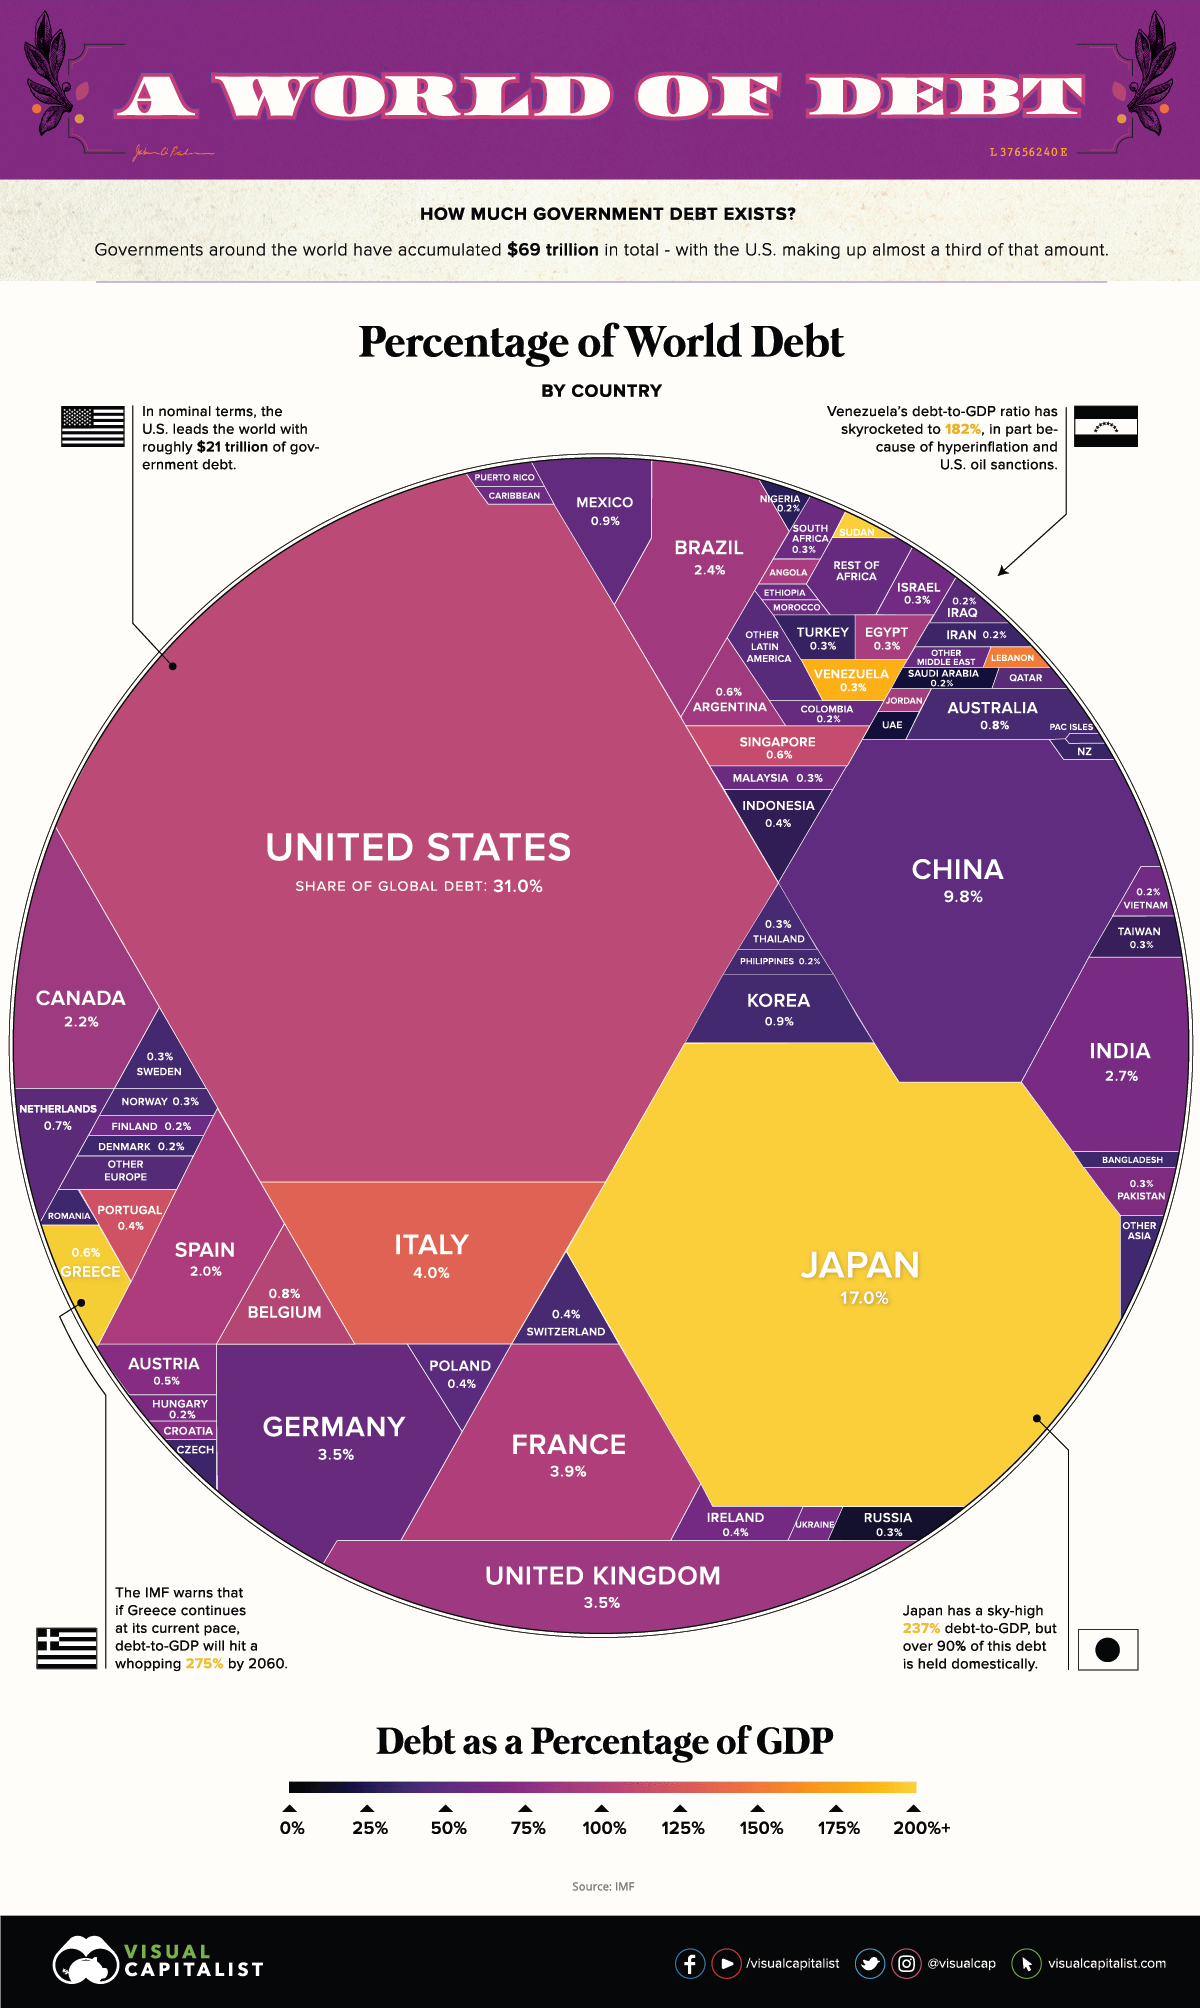
Since then, according to the latest figures by the IMF, the number has ballooned to $69.3 trillion with a debt to GDP ratio of 82% — the highest totals in human history.
Which countries owe the most money, and how do these figures compare?
The Regional Breakdown
Let’s start by looking at the continental level, to get an idea of how world debt is divided from a geographical perspective:
| Region | Debt to GDP | Gross Debt (Billions of USD) | % of Total World Debt |
|---|---|---|---|
| Asia and Pacific | 79.8% | $24,120 | 34.8% |
| North America | 100.4% | $23,710 | 34.2% |
| Europe | 74.2% | $16,225 | 23.4% |
| South America | 75.0% | $2,699 | 3.9% |
| Africa | 56.9% | $1,313 | 1.9% |
| Other | 37.1% | $1,231 | 1.8% |
| World | 81.8% | $69,298 | 100.0% |
In absolute terms, over 90% of global debt is concentrated in North America, Asia Pacific, and Europe — meanwhile, regions like Africa, South America, and other account for less than 10%.
This is not surprising, since advanced economies hold most of the world’s debt (about 75.4%), while emerging or developing economies hold the rest.
World Debt by Country
Now let’s look at individual countries, according to data released by the IMF in October 2019.
It’s worth mentioning that the following numbers are representative of 2018 data, and that for a tiny subset of countries (i.e. Syria) we used the latest available numbers as an estimate.
| Rank | Country | Debt to GDP | Gross Debt ($B) | % of World Total |
|---|---|---|---|---|
| #1 | 🇺🇸 United States | 104.3% | $21,465 | 31.0% |
| #2 | 🇯🇵 Japan | 237.1% | $11,788 | 17.0% |
| #3 | 🇨🇳 China, People's Republic of | 50.6% | $6,764 | 9.8% |
| #4 | 🇮🇹 Italy | 132.2% | $2,744 | 4.0% |
| #5 | 🇫🇷 France | 98.4% | $2,736 | 3.9% |
| #6 | 🇬🇧 United Kingdom | 86.8% | $2,455 | 3.5% |
| #7 | 🇩🇪 Germany | 61.7% | $2,438 | 3.5% |
| #8 | 🇮🇳 India | 68.1% | $1,851 | 2.7% |
| #9 | 🇧🇷 Brazil | 87.9% | $1,642 | 2.4% |
| #10 | 🇨🇦 Canada | 89.9% | $1,540 | 2.2% |
| #11 | 🇪🇸 Spain | 97.1% | $1,386 | 2.0% |
| #12 | 🇲🇽 Mexico | 53.6% | $655 | 0.9% |
| #13 | 🇰🇷 Korea, Republic of | 37.9% | $652 | 0.9% |
| #14 | 🇦🇺 Australia | 41.4% | $588 | 0.8% |
| #15 | 🇧🇪 Belgium | 102.0% | $543 | 0.8% |
| #16 | Netherlands | 52.4% | $479 | 0.7% |
| #17 | Argentina | 86.1% | $447 | 0.6% |
| #18 | Singapore | 113.6% | $414 | 0.6% |
| #19 | Greece | 184.9% | $404 | 0.6% |
| #20 | Austria | 73.8% | $337 | 0.5% |
| #21 | Indonesia | 30.1% | $308 | 0.4% |
| #22 | Portugal | 120.1% | $289 | 0.4% |
| #23 | Poland | 48.9% | $286 | 0.4% |
| #24 | Switzerland | 40.5% | $286 | 0.4% |
| #25 | Ireland | 63.7% | $244 | 0.4% |
| #26 | Russian Federation | 14.6% | $242 | 0.3% |
| #27 | Turkey | 30.2% | $233 | 0.3% |
| #28 | Egypt | 92.7% | $231 | 0.3% |
| #29 | Pakistan | 71.7% | $226 | 0.3% |
| #30 | Israel | 60.8% | $225 | 0.3% |
| #31 | Sweden | 38.5% | $214 | 0.3% |
| #32 | Thailand | 42.1% | $213 | 0.3% |
| #33 | South Africa | 56.7% | $209 | 0.3% |
| #34 | Taiwan Province of China | 35.1% | $207 | 0.3% |
| #35 | Malaysia | 55.6% | $199 | 0.3% |
| #36 | Venezuela | 182.4% | $180 | 0.3% |
| #37 | Norway | 40.0% | $174 | 0.3% |
| #38 | Colombia | 52.2% | $173 | 0.2% |
| #39 | Finland | 59.3% | $163 | 0.2% |
| #40 | Saudi Arabia | 19.0% | $149 | 0.2% |
| #41 | Iran | 32.2% | $144 | 0.2% |
| #42 | Vietnam | 55.6% | $134 | 0.2% |
| #43 | Philippines | 38.9% | $129 | 0.2% |
| #44 | Denmark | 34.3% | $121 | 0.2% |
| #45 | Hungary | 70.8% | $114 | 0.2% |
| #46 | Iraq | 49.3% | $111 | 0.2% |
| #47 | Nigeria | 27.3% | $109 | 0.2% |
| #48 | Bangladesh | 34.0% | $98.1 | 0.14% |
| #49 | Angola | 89.0% | $94.3 | 0.14% |
| #50 | Qatar | 48.6% | $93.0 | 0.13% |
| #51 | Romania | 36.7% | $87.9 | 0.13% |
| #52 | Lebanon | 151.0% | $85.1 | 0.12% |
| #53 | Czech Republic | 32.6% | $79.9 | 0.12% |
| #54 | United Arab Emirates | 19.1% | $79.1 | 0.11% |
| #55 | Ukraine | 60.2% | $78.8 | 0.11% |
| #56 | Morocco | 65.0% | $77.0 | 0.11% |
| #57 | Chile | 25.6% | $76.3 | 0.11% |
| #58 | Sri Lanka | 83.3% | $74.1 | 0.11% |
| #59 | Sudan | 212.1% | $72.7 | 0.10% |
| #60 | Algeria | 38.3% | $66.5 | 0.10% |
| #61 | New Zealand | 29.8% | $60.5 | 0.09% |
| #62 | Peru | 26.1% | $58.8 | 0.08% |
| #63 | Puerto Rico | 55.5% | $56.1 | 0.08% |
| #64 | Kenya | 60.1% | $52.8 | 0.08% |
| #65 | Slovak Republic | 48.9% | $52.1 | 0.08% |
| #66 | Ecuador | 45.8% | $49.6 | 0.07% |
| #67 | Ethiopia | 61.0% | $49.0 | 0.07% |
| #68 | Croatia | 74.6% | $45.4 | 0.07% |
| #69 | Dominican Republic | 50.5% | $43.2 | 0.06% |
| #70 | Oman | 53.4% | $42.3 | 0.06% |
| #71 | Jordan | 94.4% | $39.9 | 0.06% |
| #72 | Ghana | 59.3% | $38.9 | 0.06% |
| #73 | Slovenia | 70.4% | $38.1 | 0.05% |
| #74 | Uruguay | 63.5% | $37.9 | 0.05% |
| #75 | Kazakhstan | 21.0% | $36.3 | 0.05% |
| #76 | Bahrain | 94.7% | $35.7 | 0.05% |
| #77 | Costa Rica | 53.5% | $32.3 | 0.05% |
| #78 | Tunisia | 77.0% | $30.7 | 0.04% |
| #79 | Belarus | 47.8% | $28.5 | 0.04% |
| #80 | Serbia | 54.5% | $27.5 | 0.04% |
| #81 | Myanmar | 38.2% | $26.2 | 0.04% |
| #82 | Panama | 39.5% | $25.7 | 0.04% |
| #83 | Cyprus | 102.5% | $25.1 | 0.04% |
| #84 | Côte d'Ivoire | 53.2% | $22.9 | 0.03% |
| #85 | Bolivia | 53.8% | $21.8 | 0.03% |
| #86 | Tanzania | 37.3% | $21.2 | 0.03% |
| #87 | Zambia | 78.1% | $20.9 | 0.03% |
| #88 | Kuwait | 14.7% | $20.8 | 0.03% |
| #89 | Guatemala | 24.7% | $19.4 | 0.03% |
| #90 | Lithuania | 34.2% | $18.2 | 0.03% |
| #91 | Syria | 30.0% | $18.0 | 0.03% |
| #92 | Yemen | 64.8% | $17.9 | 0.03% |
| #93 | El Salvador | 67.1% | $17.5 | 0.03% |
| #94 | Cameroon | 39.1% | $15.1 | 0.02% |
| #95 | Luxembourg | 21.4% | $14.9 | 0.02% |
| #96 | Jamaica | 94.4% | $14.6 | 0.02% |
| #97 | Senegal | 61.6% | $14.5 | 0.02% |
| #98 | Mozambique | 99.8% | $14.4 | 0.02% |
| #99 | Bulgaria | 20.4% | $13.3 | 0.02% |
| #100 | Latvia | 35.9% | $12.5 | 0.02% |
| #101 | Turkmenistan | 29.1% | $11.9 | 0.02% |
| #102 | Uganda | 41.4% | $11.6 | 0.02% |
| #103 | Albania | 69.9% | $10.5 | 0.02% |
| #104 | Uzbekistan | 20.6% | $10.4 | 0.02% |
| #105 | Lao P.D.R. | 57.2% | $10.4 | 0.01% |
| #106 | Gabon | 60.7% | $10.2 | 0.01% |
| #107 | Congo, Republic of | 87.8% | $10.2 | 0.01% |
| #108 | Trinidad and Tobago | 45.1% | $10.2 | 0.01% |
| #109 | Iceland | 37.6% | $9.8 | 0.01% |
| #110 | Honduras | 40.2% | $9.6 | 0.01% |
| #111 | Mauritius | 66.2% | $9.4 | 0.01% |
| #112 | Paraguay | 21.5% | $9.0 | 0.01% |
| #113 | Azerbaijan | 18.8% | $8.8 | 0.01% |
| #114 | Nepal | 30.2% | $8.8 | 0.01% |
| #115 | Papua New Guinea | 35.5% | $8.2 | 0.01% |
| #116 | Bahamas, The | 63.3% | $7.9 | 0.01% |
| #117 | Zimbabwe | 37.1% | $7.8 | 0.01% |
| #118 | Georgia | 44.9% | $7.3 | 0.01% |
| #119 | Congo, Dem. Rep. of the | 15.3% | $7.2 | 0.01% |
| #120 | Cambodia | 28.6% | $7.0 | 0.01% |
| #121 | Bosnia and Herzegovina | 34.3% | $6.9 | 0.01% |
| #122 | Namibia | 45.8% | $6.6 | 0.01% |
| #123 | Malta | 45.2% | $6.6 | 0.01% |
| #124 | Mali | 37.3% | $6.4 | 0.01% |
| #125 | Barbados | 125.7% | $6.4 | 0.01% |
| #126 | Armenia | 51.3% | $6.4 | 0.01% |
| #127 | Burkina Faso | 42.9% | $6.1 | 0.01% |
| #128 | Equatorial Guinea | 43.3% | $5.9 | 0.01% |
| #129 | Benin | 41.0% | $5.9 | 0.01% |
| #130 | Madagascar | 45.7% | $5.5 | 0.01% |
| #131 | Chad | 48.3% | $5.3 | 0.01% |
| #132 | North Macedonia | 40.5% | $5.1 | 0.01% |
| #133 | Niger | 53.8% | $5.0 | 0.01% |
| #134 | Nicaragua | 37.2% | $4.9 | 0.01% |
| #135 | Guinea | 38.2% | $4.6 | 0.01% |
| #136 | Kyrgyz Republic | 56.0% | $4.5 | 0.01% |
| #137 | Mauritania | 82.9% | $4.3 | 0.01% |
| #138 | Malawi | 62.9% | $4.3 | 0.01% |
| #139 | Togo | 76.2% | $4.1 | 0.01% |
| #140 | Montenegro | 72.6% | $4.0 | 0.01% |
| #141 | Rwanda | 40.7% | $3.9 | 0.01% |
| #142 | Maldives | 68.0% | $3.6 | 0.01% |
| #143 | Tajikistan | 47.9% | $3.6 | 0.01% |
| #144 | Eritrea | 174.3% | $3.5 | 0.01% |
| #145 | Moldova | 29.7% | $3.4 | 0.00% |
| #146 | Haiti | 33.3% | $3.2 | 0.00% |
| #147 | Bhutan | 102.4% | $2.6 | 0.00% |
| #148 | Sierra Leone | 63.0% | $2.6 | 0.00% |
| #149 | Estonia | 8.3% | $2.6 | 0.00% |
| #150 | Fiji | 46.2% | $2.6 | 0.00% |
| #151 | Suriname | 72.8% | $2.5 | 0.00% |
| #152 | Cabo Verde | 124.5% | $2.5 | 0.00% |
| #153 | Aruba | 84.5% | $2.4 | 0.00% |
| #154 | Botswana | 12.1% | $2.3 | 0.00% |
| #155 | Guyana | 52.9% | $2.1 | 0.00% |
| #156 | Burundi | 58.4% | $2.0 | 0.00% |
| #157 | South Sudan, Republic of | 42.2% | $1.9 | 0.00% |
| #158 | Belize | 95.2% | $1.8 | 0.00% |
| #159 | Eswatini | 35.2% | $1.7 | 0.00% |
| #160 | Antigua and Barbuda | 89.5% | $1.4 | 0.00% |
| #161 | Gambia, The | 86.6% | $1.4 | 0.00% |
| #162 | Djibouti | 48.0% | $1.4 | 0.00% |
| #163 | Afghanistan | 6.9% | $1.4 | 0.00% |
| #164 | Kosovo | 17.0% | $1.4 | 0.00% |
| #165 | Liberia | 39.9% | $1.3 | 0.00% |
| #166 | San Marino | 77.9% | $1.3 | 0.00% |
| #167 | Saint Lucia | 64.3% | $1.2 | 0.00% |
| #168 | Lesotho | 44.5% | $1.2 | 0.00% |
| #169 | Central African Republic | 49.9% | $1.1 | 0.00% |
| #170 | Guinea-Bissau | 64.3% | $0.9 | 0.00% |
| #171 | Seychelles | 56.9% | $0.9 | 0.00% |
| #172 | Grenada | 63.5% | $0.8 | 0.00% |
| #173 | Saint Vincent and the Grenadines | 74.5% | $0.6 | 0.00% |
| #174 | Saint Kitts and Nevis | 60.5% | $0.6 | 0.00% |
| #175 | Vanuatu | 51.4% | $0.5 | 0.00% |
| #176 | Samoa | 50.3% | $0.4 | 0.00% |
| #177 | Dominica | 74.1% | $0.4 | 0.00% |
| #178 | Hong Kong SAR | 0.1% | $0.4 | 0.00% |
| #179 | Brunei Darussalam | 2.6% | $0.4 | 0.00% |
| #180 | São Tomé and Príncipe | 74.5% | $0.3 | 0.00% |
| #181 | Comoros | 21.0% | $0.2 | 0.00% |
| #182 | Timor-Leste | 6.1% | $0.2 | 0.00% |
| #183 | Solomon Islands | 9.4% | $0.1 | 0.00% |
| #184 | Micronesia, Fed. States of | 20.3% | $0.1 | 0.00% |
| #185 | Nauru | 58.3% | $0.1 | 0.00% |
| #186 | Marshall Islands | 25.2% | $0.1 | 0.00% |
| #187 | Kiribati | 20.6% | $0.0 | 0.00% |
| #188 | Tuvalu | 28.1% | $0.0 | 0.00% |
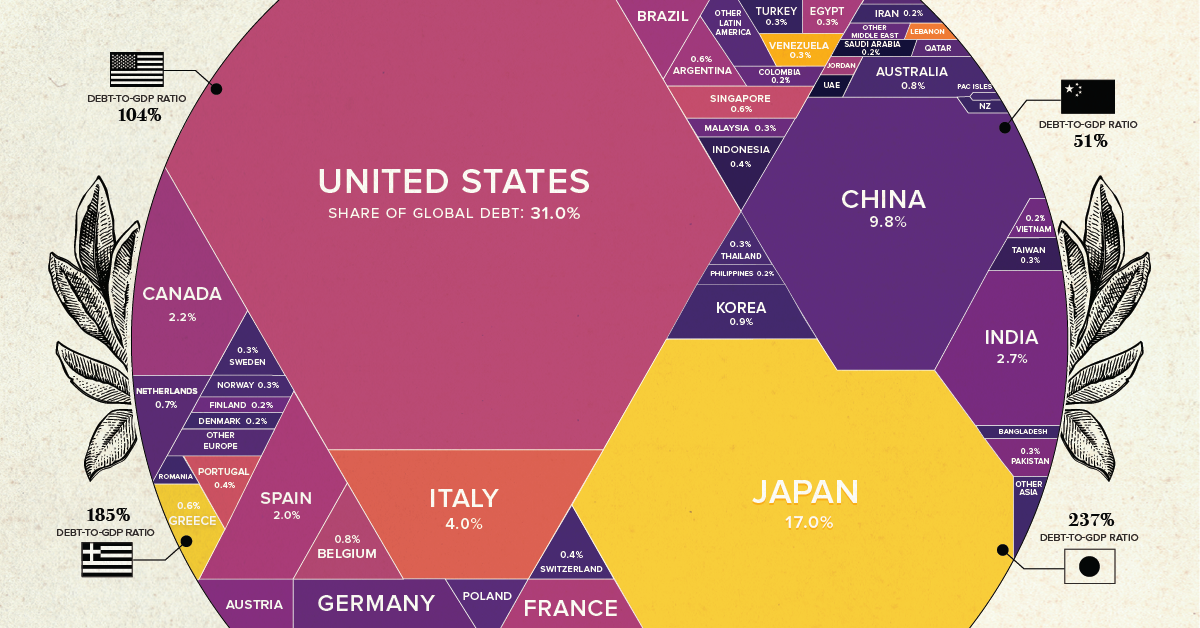
In absolute terms, the most indebted nation is the United States, which has a gross debt of $21.5 trillion according to the IMF as of 2018.
If you’re looking for a more precise figure for 2019, the U.S. government’s “Debt to the Penny” dataset puts the amount owing to exactly $23,015,089,744,090.63 as of November 12, 2019.
Of course, the U.S. is also the world’s largest economy in nominal terms, putting the debt to GDP ratio at 104.3%
Other stand outs from the list above include Japan, which has the highest debt to GDP ratio (237.1%), and China , which has increased government debt by almost $2 trillion in just the last two years. Meanwhile, the European economies of Italy and Belgium check the box as other large debtors with ratios topping 100% debt to GDP.


Economy
Economic Growth Forecasts for G7 and BRICS Countries in 2024
The IMF has released its economic growth forecasts for 2024. How do the G7 and BRICS countries compare?


G7 & BRICS Real GDP Growth Forecasts for 2024
The International Monetary Fund’s (IMF) has released its real gross domestic product (GDP) growth forecasts for 2024, and while global growth is projected to stay steady at 3.2%, various major nations are seeing declining forecasts.
This chart visualizes the 2024 real GDP growth forecasts using data from the IMF’s 2024 World Economic Outlook for G7 and BRICS member nations along with Saudi Arabia, which is still considering an invitation to join the bloc.
Get the Key Insights of the IMF’s World Economic Outlook
Want a visual breakdown of the insights from the IMF’s 2024 World Economic Outlook report?
This visual is part of a special dispatch of the key takeaways exclusively for VC+ members.
Get the full dispatch of charts by signing up to VC+.
Mixed Economic Growth Prospects for Major Nations in 2024
Economic growth projections by the IMF for major nations are mixed, with the majority of G7 and BRICS countries forecasted to have slower growth in 2024 compared to 2023.
Only three BRICS-invited or member countries, Saudi Arabia, the UAE, and South Africa, have higher projected real GDP growth rates in 2024 than last year.
| Group | Country | Real GDP Growth (2023) | Real GDP Growth (2024P) |
|---|---|---|---|
| G7 | 🇺🇸 U.S. | 2.5% | 2.7% |
| G7 | 🇨🇦 Canada | 1.1% | 1.2% |
| G7 | 🇯🇵 Japan | 1.9% | 0.9% |
| G7 | 🇫🇷 France | 0.9% | 0.7% |
| G7 | 🇮🇹 Italy | 0.9% | 0.7% |
| G7 | 🇬🇧 UK | 0.1% | 0.5% |
| G7 | 🇩🇪 Germany | -0.3% | 0.2% |
| BRICS | 🇮🇳 India | 7.8% | 6.8% |
| BRICS | 🇨🇳 China | 5.2% | 4.6% |
| BRICS | 🇦🇪 UAE | 3.4% | 3.5% |
| BRICS | 🇮🇷 Iran | 4.7% | 3.3% |
| BRICS | 🇷🇺 Russia | 3.6% | 3.2% |
| BRICS | 🇪🇬 Egypt | 3.8% | 3.0% |
| BRICS-invited | 🇸🇦 Saudi Arabia | -0.8% | 2.6% |
| BRICS | 🇧🇷 Brazil | 2.9% | 2.2% |
| BRICS | 🇿🇦 South Africa | 0.6% | 0.9% |
| BRICS | 🇪🇹 Ethiopia | 7.2% | 6.2% |
| 🌍 World | 3.2% | 3.2% |
China and India are forecasted to maintain relatively high growth rates in 2024 at 4.6% and 6.8% respectively, but compared to the previous year, China is growing 0.6 percentage points slower while India is an entire percentage point slower.
On the other hand, four G7 nations are set to grow faster than last year, which includes Germany making its comeback from its negative real GDP growth of -0.3% in 2023.
Faster Growth for BRICS than G7 Nations
Despite mostly lower growth forecasts in 2024 compared to 2023, BRICS nations still have a significantly higher average growth forecast at 3.6% compared to the G7 average of 1%.
While the G7 countries’ combined GDP is around $15 trillion greater than the BRICS nations, with continued higher growth rates and the potential to add more members, BRICS looks likely to overtake the G7 in economic size within two decades.
BRICS Expansion Stutters Before October 2024 Summit
BRICS’ recent expansion has stuttered slightly, as Argentina’s newly-elected president Javier Milei declined its invitation and Saudi Arabia clarified that the country is still considering its invitation and has not joined BRICS yet.
Even with these initial growing pains, South Africa’s Foreign Minister Naledi Pandor told reporters in February that 34 different countries have submitted applications to join the growing BRICS bloc.
Any changes to the group are likely to be announced leading up to or at the 2024 BRICS summit which takes place October 22-24 in Kazan, Russia.
Get the Full Analysis of the IMF’s Outlook on VC+
This visual is part of an exclusive special dispatch for VC+ members which breaks down the key takeaways from the IMF’s 2024 World Economic Outlook.
For the full set of charts and analysis, sign up for VC+.

-

 Markets1 week ago
U.S. Debt Interest Payments Reach $1 Trillion
-

 Markets2 weeks ago
Ranked: The Most Valuable Housing Markets in America
-

 Money2 weeks ago
Which States Have the Highest Minimum Wage in America?
-

 AI2 weeks ago
Ranked: Semiconductor Companies by Industry Revenue Share
-

 Markets2 weeks ago
Ranked: The World’s Top Flight Routes, by Revenue
-

 Countries2 weeks ago
Population Projections: The World’s 6 Largest Countries in 2075
-

 Markets2 weeks ago
The Top 10 States by Real GDP Growth in 2023
-

 Money2 weeks ago
The Smallest Gender Wage Gaps in OECD Countries