Misc
Mapped: The 50-Year Evolution of Walt Disney World
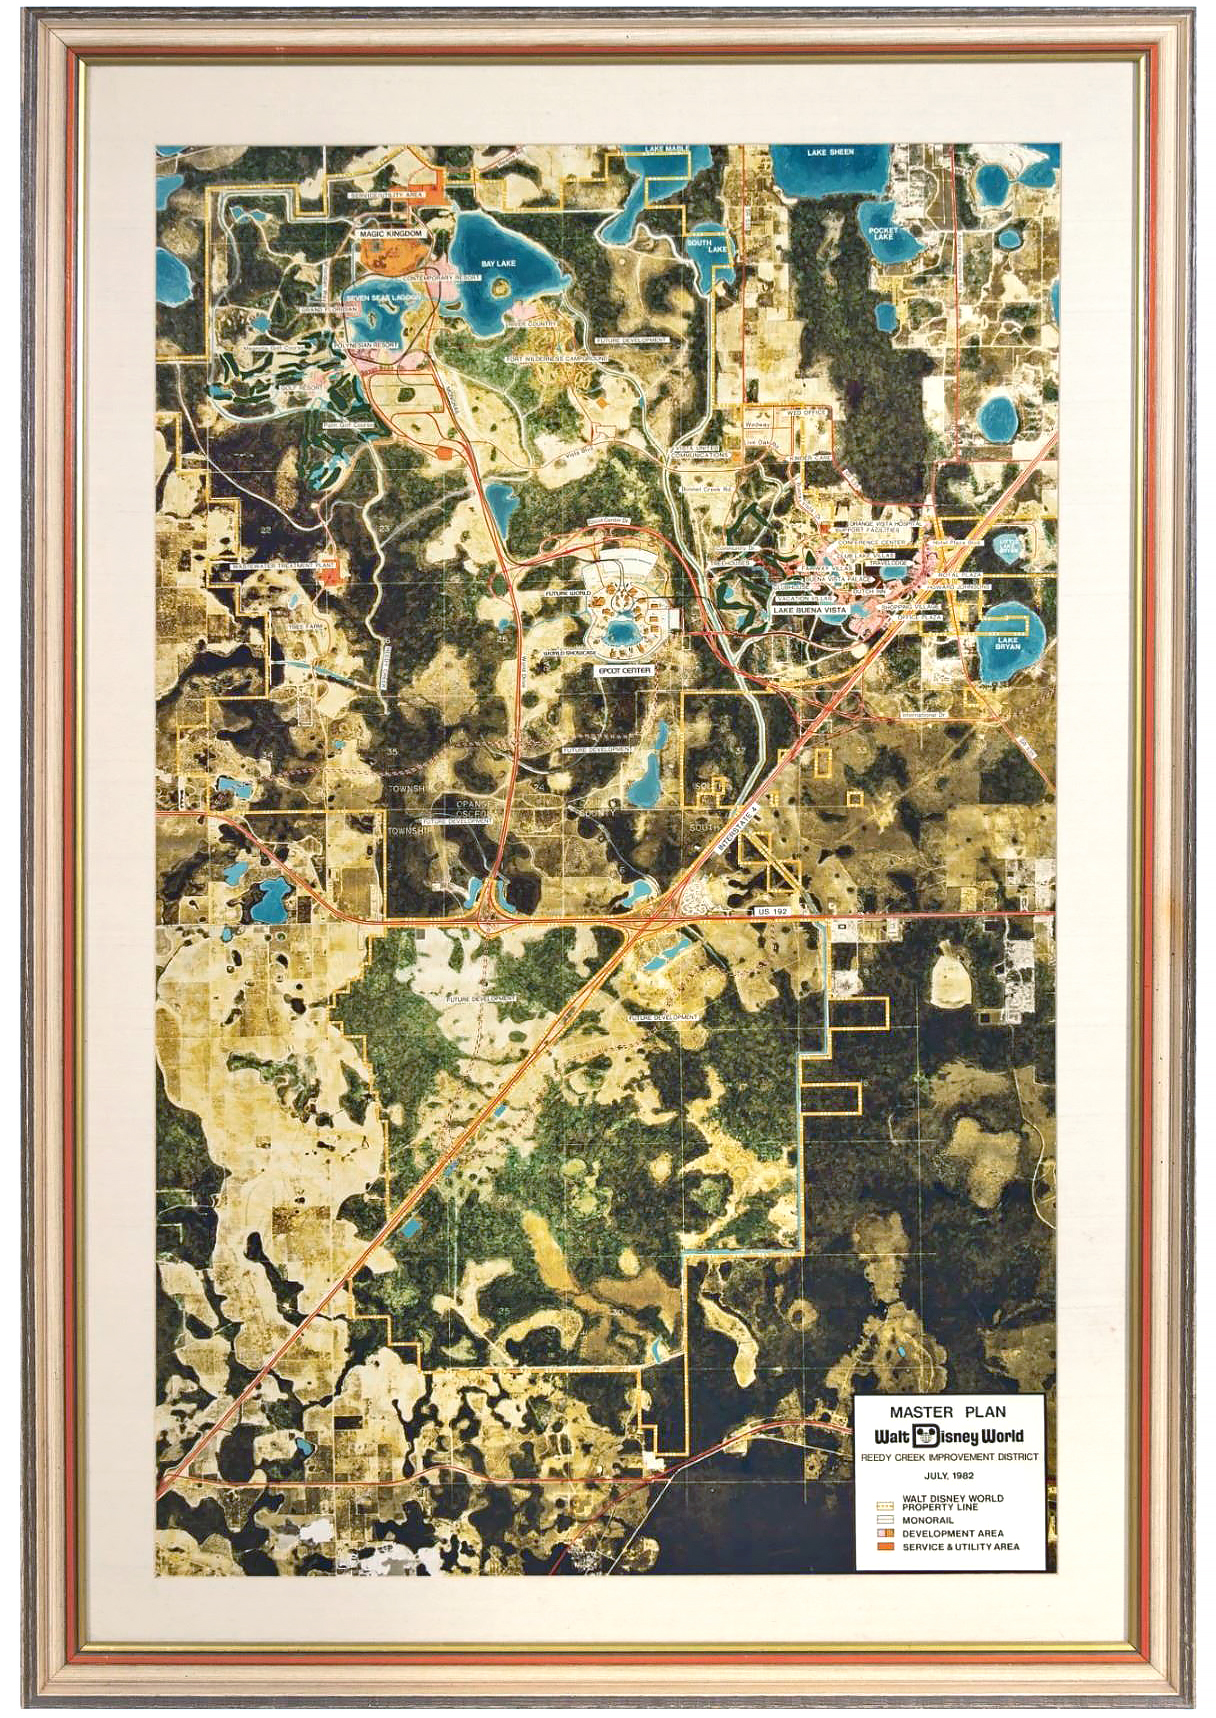
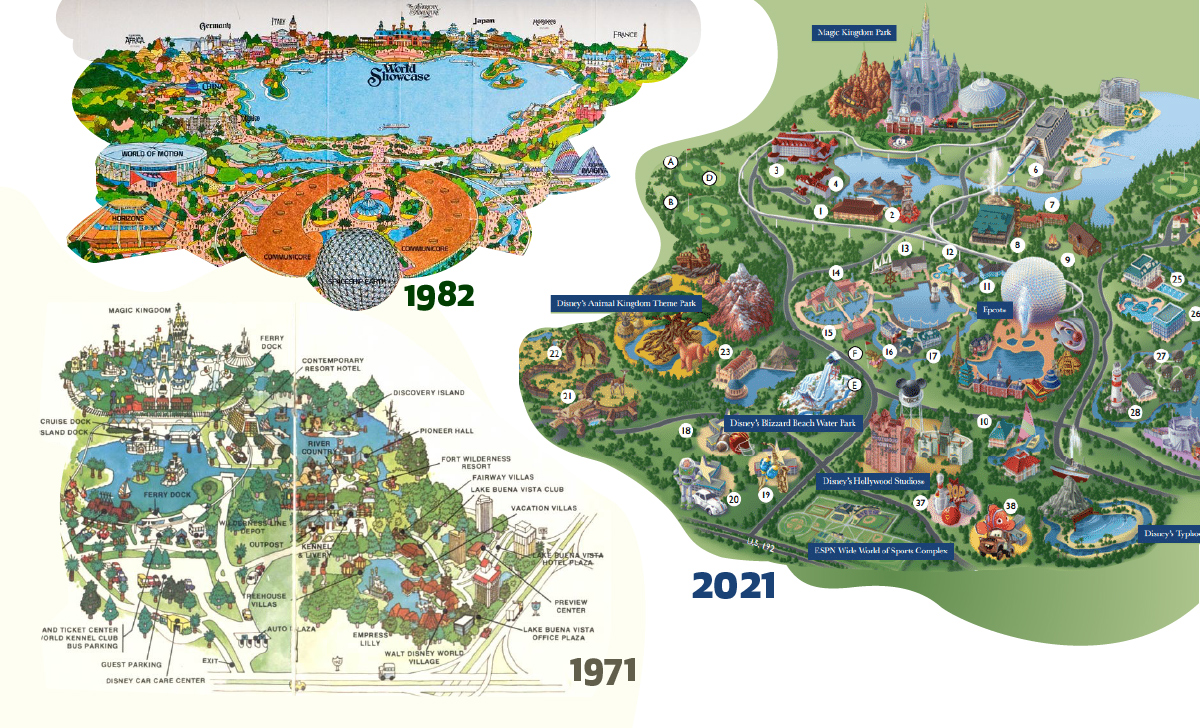
Walt Disney World Master Plan (circa 1982) with the Magic Kingdom in the top–left and Epcot under construction in the center.
The 50-Year Evolution of Walt Disney World in Maps
In the early 1960s, Walt Disney was riding high on the success of Disneyland in California.
Disneyland had a problem though. Only a small fraction of its guests were from the East Coast of the U.S., which meant Disney was missing out on a huge potential audience for his theme park. To expand the company’s reach and scope, he began looking for a location that would match his grand ambitions, and Florida, with its abundance of cheap land and warm climate was a natural choice.
On November 22, 1963—coincidentally the day JFK was assassinated—Walt flew over to the Orlando to do some location scouting. At the time, most of the area was swampland, though there was one area adjacent to an under-construction highway that caught his attention.
Using shell companies to preserve his anonymity (and to keep the price down), Disney began acquiring the sprawling properties that would become today’s Walt Disney World (WDW).
Walt Disney World: The First Iteration
When Walt Disney World finally opened in 1971, it included the main Magic Kingdom site, as well as two golf courses and two hotels—Contemporary Resort and the Polynesian Village Resort. These areas were all connected by a monorail system.
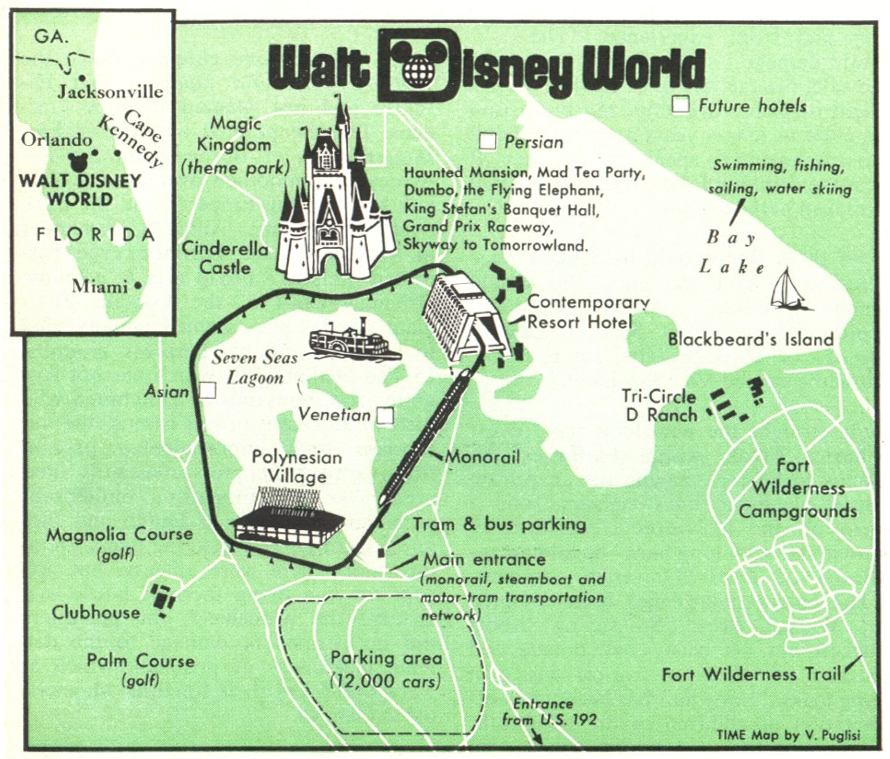
As these maps depict, there was a plan to develop three unique themed zones around the Seven Seas Lagoon: Persian, Asian, and Venetian.
However, these projects were scrapped after the 1973 oil crisis as tourism declined.
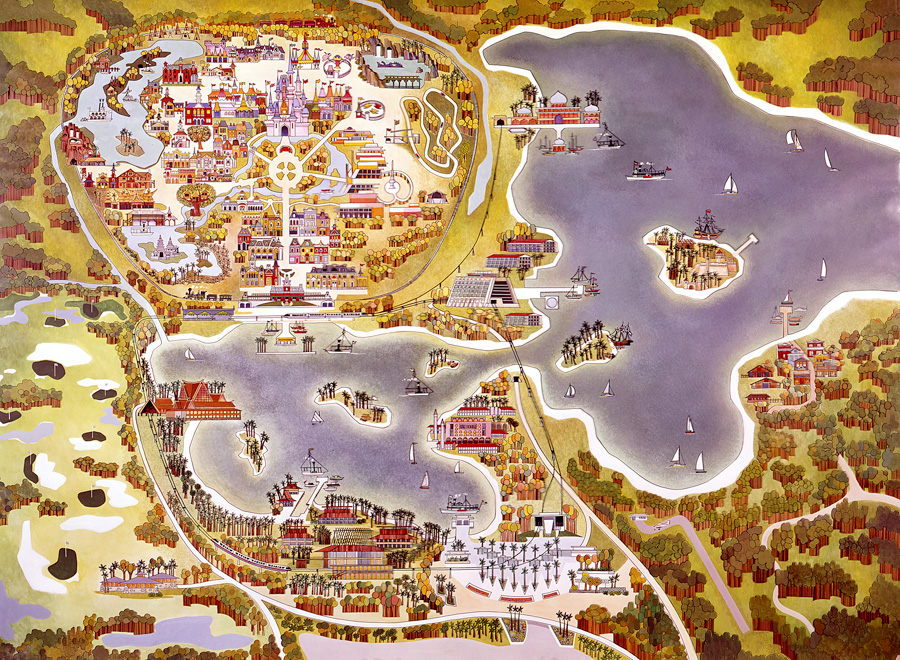
The original master plan for Walt Disney World did not include plans for the Seven Seas Lagoon, and it was likely added so that the displaced earth could be used to fortify swampy sections of the property to make them suitable for building.
Epcot Expansion
The first major Disney World expansion was Epcot Center, which opened in 1982. The site, which was twice as big as the Magic Kingdom, is best described as a permanent world’s fair.
The park was anchored by Future World and “Spaceship Earth”, the iconic geodesic sphere structure that sat at the entrance of the park.
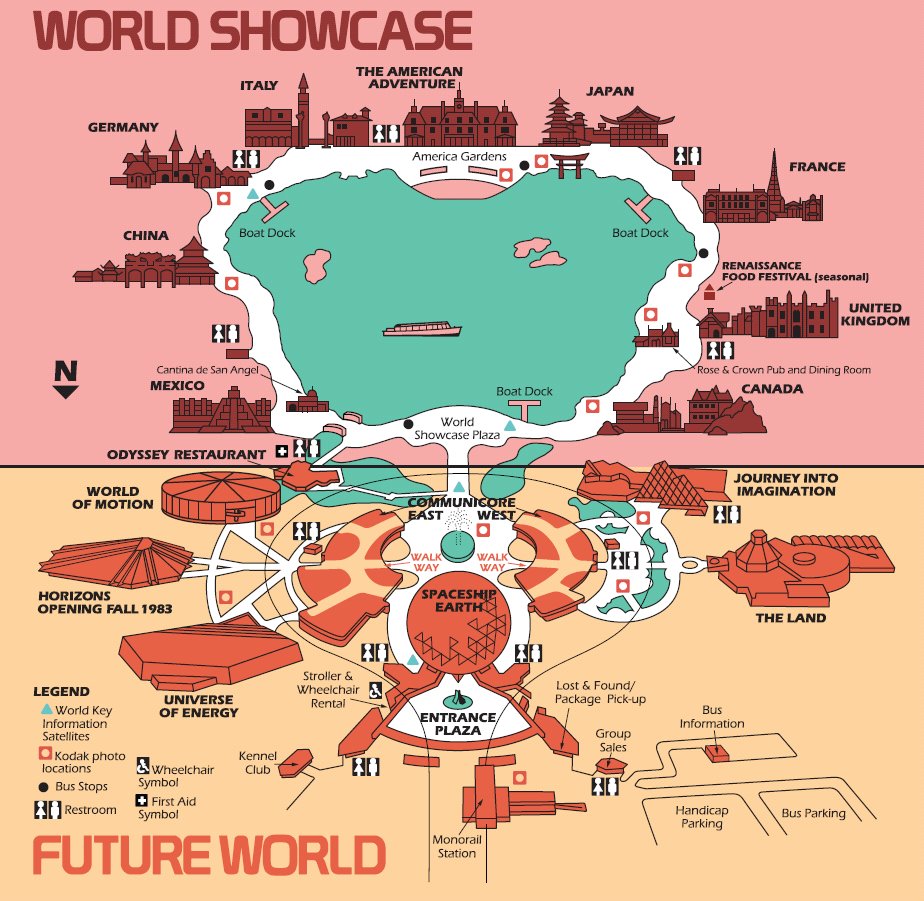
Surrounding the nearby lake were pavilions themed after various locations in the world.
Though the scope of Epcot was impressive at the time, it was still vastly scaled down from Walt Disney’s original vision for a fully functioning “city of the future”. Ultimately, the company was uncertain about the feasibility of operating a functional city, so the idea was scrapped in favor of the current iteration.
Hollywood Comes to Florida
Disney-MGM Studios opened in 1989, in a location just south of Epcot. The park featured “imagined worlds from film, television, music, and theater, drawing inspiration from the Golden Age of Hollywood”.
To make this happen, Disney entered into a licensing agreement with MGM to help increase the variety of film representation within the park.
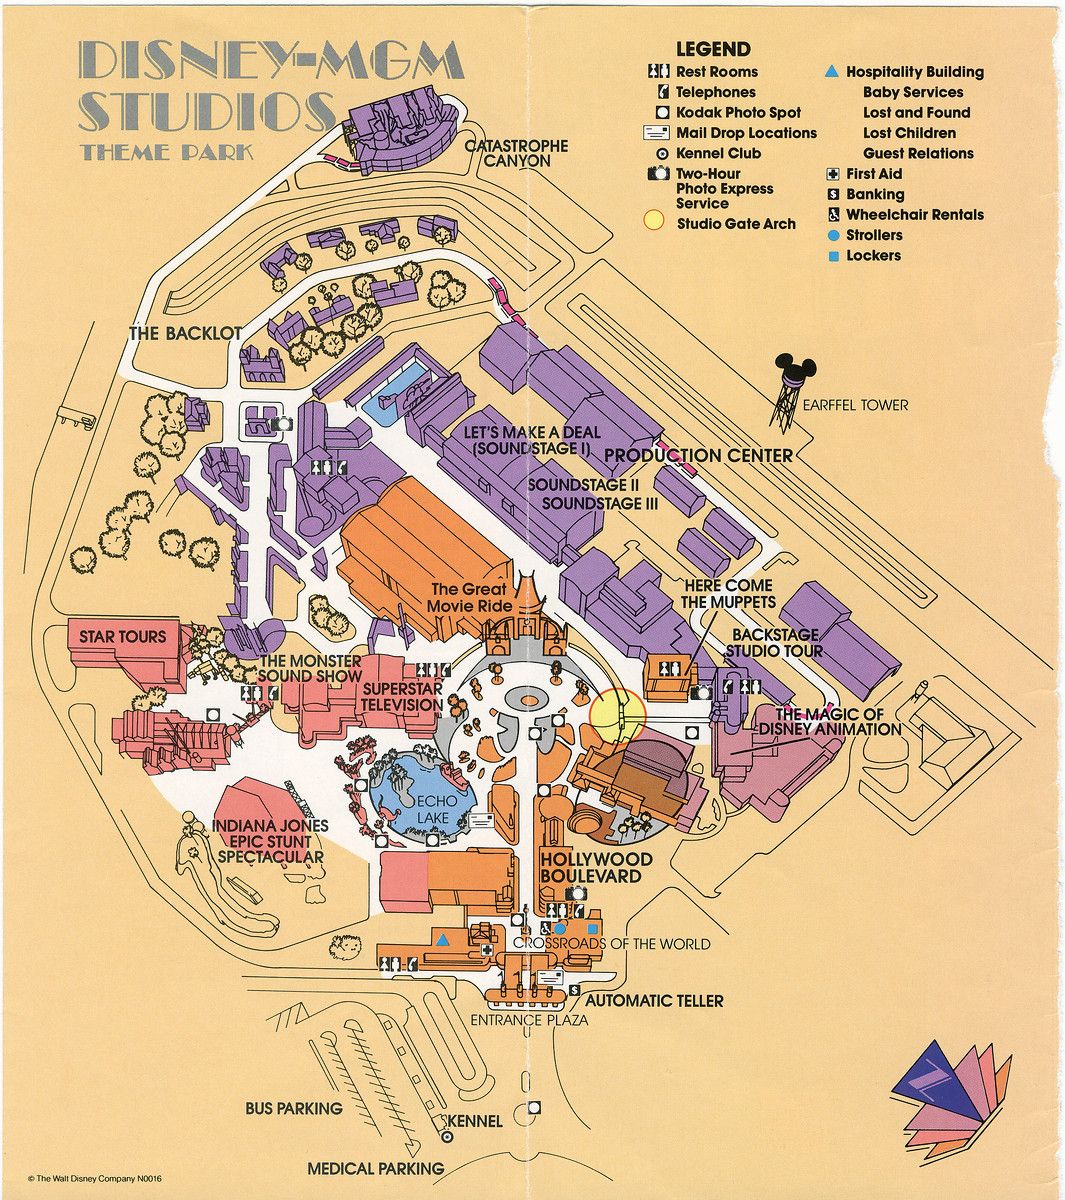
Approximately 11 million visitors pass through Hollywood Studios every year.
Animal Kingdom and Rapid Expansion
In 1998, WDW added a fourth theme park called Animal Kingdom. It’s the largest theme park in the world, covering 580 acres, and combines elements of both a zoo and theme park.
A central feature of Animal Kingdom is the massive Tree of Life. The 145 foot tall work of art contains 325 unique animal carvings and over 100,000 artificial leaves. The park itself features about 2,000 animals representing 300 species.
Around 13 million people visit the theme park each year.
Walt Disney World Today
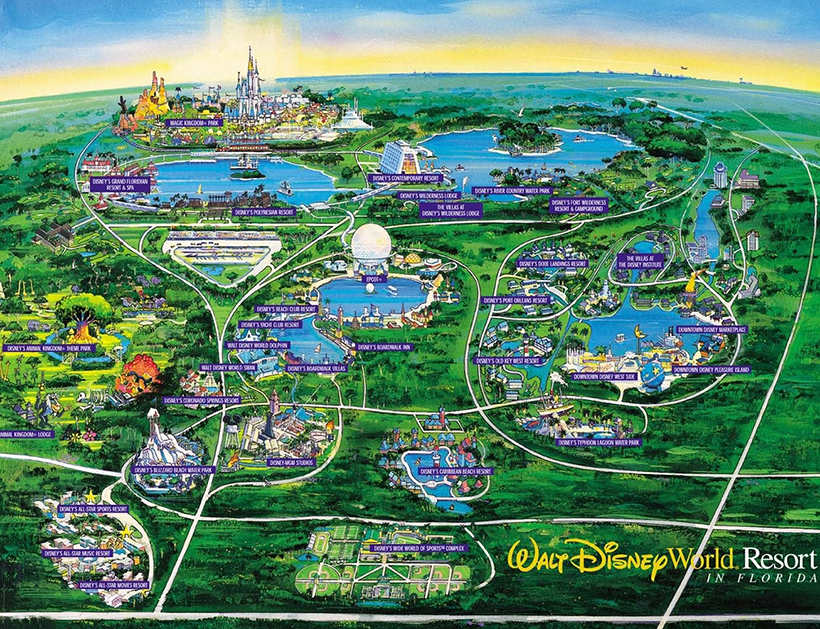
So, how big is Walt Disney World today? 43 square miles, which is about the same area as San Francisco and and twice the size of Manhattan.
The scale of today’s WDW has fully eclipsed the original version of the site. The resort, which featured two hotels in 1971, now has more than 20, with 30,000 hotel rooms. WDW is also the largest single site employer in the United States.
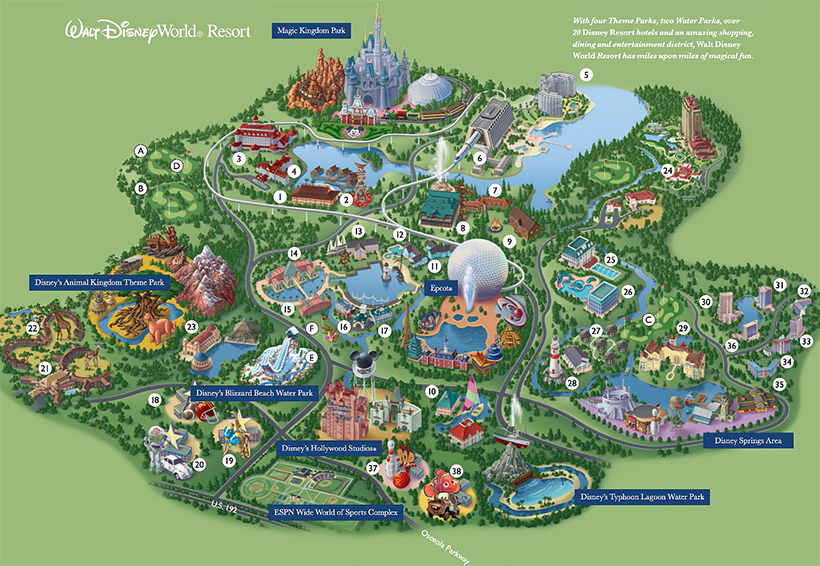
Looking at the map above, one might wonder whether this sprawling entertainment empire is bursting at the seams. Will WDW eventually build over its entire property? The answer is somewhat complicated.
What’s Missing from Walt Disney World Maps?
While the stylized maps above do a great job of highlighting WDW’s many attractions, they generally downplay an important fact. Much of the land owned by Disney is still undeveloped, and there is a lot of space between the various parks. Much of this space is earmarked as conservation areas, and only some of the remaining land is actually suitable for development. Despite the sheer size of the property occupied by WDW, space for expansion grows increasingly scarce with each new development.
The stylized maps also downplay the size of WDW’s parking lots, which are extensive. The Magic Kingdom parking lot, for example, is actually larger than the theme park itself.
The giant map below is an accurate representation of the park’s layout, and includes facts on some of the attributes of the park.
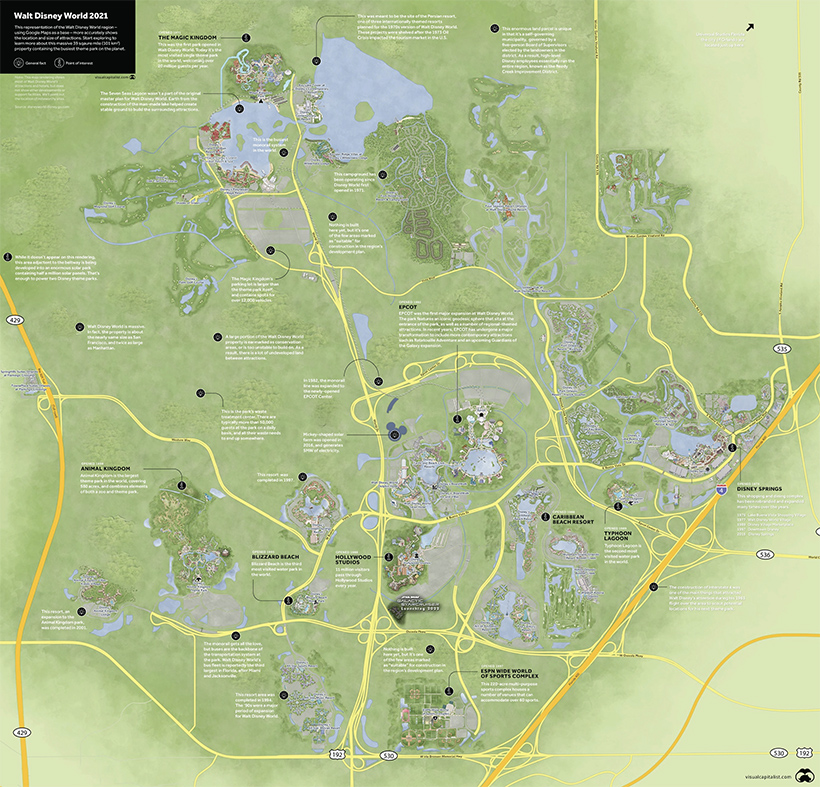
This enormous land parcel is also unique in that it’s a kind of self-governing municipality, with its own fire department and emergency services. The district—officially known as the Reedy Creek Improvement District—is governed by a five-person Board of Supervisors elected by the landowners in the district. As a result, high-level Disney employees essentially run the entire region encompassing WDW.
In the 50 years since the Magic Kingdom first opened its turnstiles, Disney’s own kingdom in Central Florida has transformed dramatically. With Disney’s continued financial success and the freedom to make large-scale moves within their property, the next 50 years will no doubt bring more dramatic changes to the world’s biggest theme park.


Misc
How Hard Is It to Get Into an Ivy League School?
We detail the admission rates and average annual cost for Ivy League schools, as well as the median SAT scores required to be accepted.


How Hard Is It to Get Into an Ivy League School?
This was originally posted on our Voronoi app. Download the app for free on iOS or Android and discover incredible data-driven charts from a variety of trusted sources.
Ivy League institutions are renowned worldwide for their academic excellence and long-standing traditions. But how hard is it to get into one of the top universities in the U.S.?
In this graphic, we detail the admission rates and average annual cost for Ivy League schools, as well as the median SAT scores required to be accepted. The data comes from the National Center for Education Statistics and was compiled by 24/7 Wall St.
Note that “average annual cost” represents the net price a student pays after subtracting the average value of grants and/or scholarships received.
Harvard is the Most Selective
The SAT is a standardized test commonly used for college admissions in the United States. It’s taken by high school juniors and seniors to assess their readiness for college-level academic work.
When comparing SAT scores, Harvard and Dartmouth are among the most challenging universities to gain admission to. The median SAT scores for their students are 760 for reading and writing and 790 for math. Still, Harvard has half the admission rate (3.2%) compared to Dartmouth (6.4%).
| School | Admission rate (%) | SAT Score: Reading & Writing | SAT Score: Math | Avg Annual Cost* |
|---|---|---|---|---|
| Harvard University | 3.2 | 760 | 790 | $13,259 |
| Columbia University | 3.9 | 750 | 780 | $12,836 |
| Yale University | 4.6 | 760 | 780 | $16,341 |
| Brown University | 5.1 | 760 | 780 | $26,308 |
| Princeton University | 5.7 | 760 | 780 | $11,080 |
| Dartmouth College | 6.4 | 760 | 790 | $33,023 |
| University of Pennsylvania | 6.5 | 750 | 790 | $14,851 |
| Cornell University | 7.5 | 750 | 780 | $29,011 |
*Costs after receiving federal financial aid.
Additionally, Dartmouth has the highest average annual cost at $33,000. Princeton has the lowest at $11,100.
While student debt has surged in the United States in recent years, hitting $1.73 trillion in 2023, the worth of obtaining a degree from any of the schools listed surpasses mere academics. This is evidenced by the substantial incomes earned by former students.
Harvard grads, for example, have the highest average starting salary in the country, at $91,700.

-

 Mining2 weeks ago
Charted: The Value Gap Between the Gold Price and Gold Miners
-

 Real Estate1 week ago
Ranked: The Most Valuable Housing Markets in America
-

 Business1 week ago
Charted: Big Four Market Share by S&P 500 Audits
-

 AI1 week ago
The Stock Performance of U.S. Chipmakers So Far in 2024
-

 Misc1 week ago
Almost Every EV Stock is Down After Q1 2024
-

 Money2 weeks ago
Where Does One U.S. Tax Dollar Go?
-

 Green2 weeks ago
Ranked: Top Countries by Total Forest Loss Since 2001
-

 Real Estate2 weeks ago
Visualizing America’s Shortage of Affordable Homes