Misc
50 Cognitive Biases in the Modern World
Cognitive biases are widely accepted as something that makes us human.
Every day, systematic errors in our thought process impact the way we live and work. But in a world where everything we do is changing rapidlyโfrom the way we store information to the way we watch TVโwhat really classifies as rational thinking?
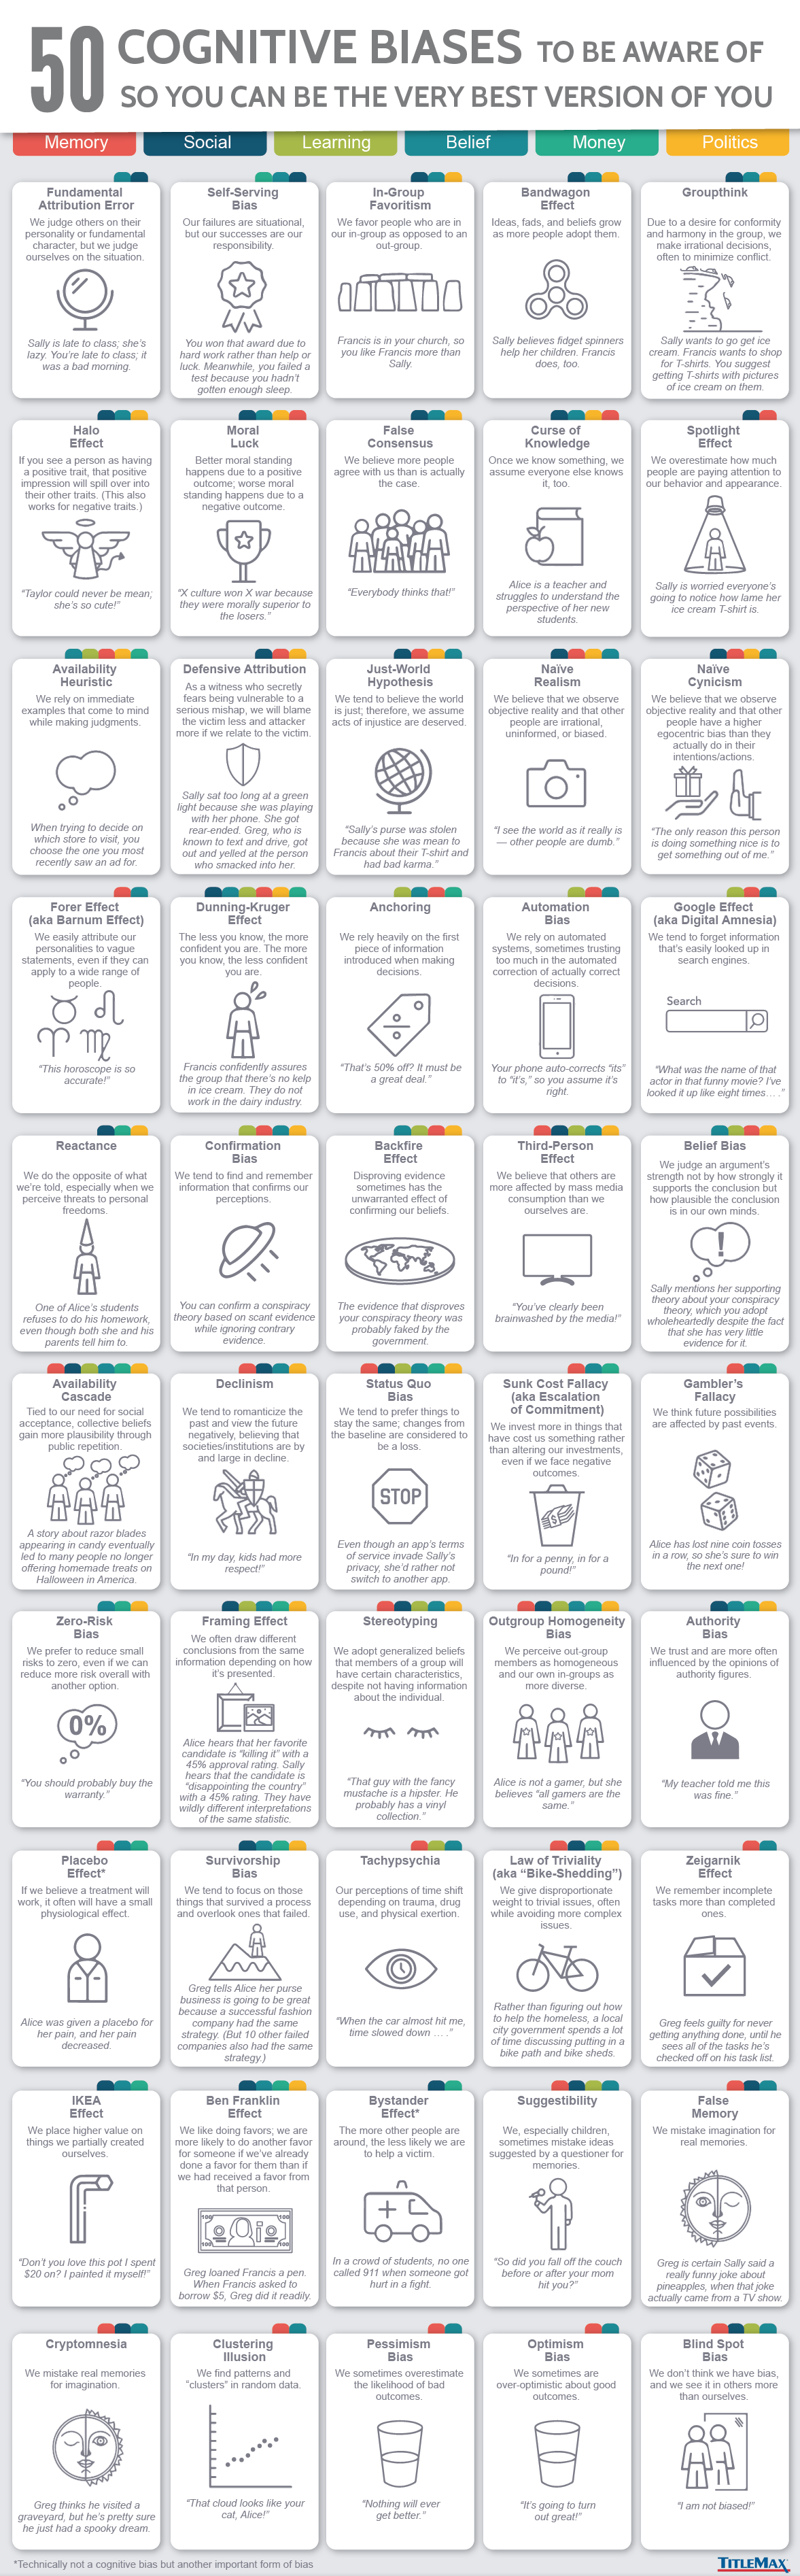
Itโs a question with no right or wrong answer, but to help us decide for ourselves, todayโs infographic from TitleMax lists 50 cognitive biases that we may want to become privy to.
In the name of self-awareness, hereโs a closer look at three recently discovered biases that we are most prone to exhibiting in the modern world.
Automation Bias
AI-infused applications are becoming incredibly good at โpersonalizingโ our content, but will there come a time when we let algorithms make all of our decisions?
Automation bias refers to the tendency to favor the suggestions of automated systems.
Take Netflix, for example. Everything we see on the platform is the result of algorithmsโeven the preview images that are generated. Then, to harness the power of data and machine learning, Netflix categorizes its content into tens of thousands of micro-genres. Pairing these genre tags with a viewerโs history allows them to assign several of over 2,000 โtaste profilesโ to each user.
And while thereโs nothing wrong with allowing Netflix to guide what we watch, thereโs an enormous sea of content standing by. Estimates from 2015 claimed it would take nearly four years to watch all of Netflixโs content. Thousands more hours of content have since been added.
If we want to counter this cognitive bias, finding a new favorite series on platforms like Netflix may require some good old-fashioned human curiosity.
The Google Effect
Also known as โdigital amnesiaโ, the aptly named Google Effect describes our tendency to forget information that can be easily accessed online.
First described in 2011 by Betsy Sparrow (Columbia University) and her colleagues, their paper described the results of several memory experiments involving technology.
In one experiment, participants typed trivia statements into a computer and were later asked to recall them. Half believed the statements were saved, and half believed the statements were erased. The results were significant: participants who assumed they could look up their statements did not make much effort to remember them.
Because search engines are continually available to us, we may often be in a state of not feeling we need to encode the information internally. When we need it, we will look it up.
– Sparrow B, et al. Science 333, 777 (2011)ย
Our modern brains appear to be re-prioritizing the information we hold onto. Notably, the study doesnโt suggest weโre becoming less intelligentโour ability to learn offline remains the same.
The IKEA Effect
Identified in 2011 by Michael Norton (Harvard Business School) and his colleagues, this cognitive bias refers to our tendency to attach a higher value to things we help create.
Combining the Ikea Effect with other related traits, such as our willingness to pay a premium for customization, is a strategy employed by companies seeking to increase the intrinsic value that we attach to their products.
For instance, American retailer Build-A-Bear Workshop is anchored around creating a highly interactive customer experience. With the help of staff, children (or adults) can assemble their stuffed animals from scratch, then add clothing and accessories at extra cost.
Nike also incorporates this bias into its offering. The footwear company offers a Nike By You line of customizable products, where customers pay a premium to design bespoke shoes with an extensive online configurator.
While thereโs nothing necessarily wrong with our susceptibility to the Ikea Effect, understanding its significance may help us make more appropriate decisions as consumers.
What Can We Do?
As we navigate an increasingly complex world, itโs natural for us to unconsciously adopt new patterns of behavior.
Becoming aware of our cognitive biases, and their implications, can help us stay on the right course.
War
Interactive: Comparing Military Spend Around the World
Which countries have the highest military spend relative to their economy? This visual breaks down the amount spent in each country by GDP.

Comparing Military Spend Around the World
One of the easiest ways to identify a nationโs priorities is by tracking its expenditures, and military spend is no different.
Usually spending is measured, and ranked, in absolute amounts. For example, countries around the world collectively spent $2.1 trillion on their militaries in 2021, with the most coming from the U.S. ($800 billion), China ($293 billion), and India ($77 billion).
But these eye-popping figures are best understood in the context of each country’s economy. Using data from the Stockholm International Peace Research Institute (SIPRI), Varun Jain has visualized 158 countries’ military expenditures, both as a percentage of their total GDP as well as in average per-capita spend.
Countriesโ Military Spend as a Percentage of their Economy
To begin, Jain identified three categories of military expenditure as a percent of GDP, using the five-year (2018โ2022) average for more consistent data:
Military Spend | % of GDP | Countries |
---|---|---|
High | Above 5% | 7 |
Medium | 2โ5% | 44 |
Low | Below 2% | 107 |
Under this categorization, the stand outs are the countries spending an outsized amount of their economic output on military, rather than the highest total spenders in absolute terms.
At the top of the table is Ukraine, which has earmarked a staggering average of 9.46% of its total economic output on defense over the past five years. That’s well ahead of second-place Saudi Arabia, which is slightly above 8%.
In Ukraine’s case, its high ranking shows how quickly priorities can change. From 2018 to 2021, the country spent 3.2-3.8% of its GDP on its military, but the outbreak of war with Russia saw its expenditures jump to one-third of economic output.
Other countries from the Middle East and North Africa follow in this tier, with Oman third at 8.11% and Qatar fourth with 5.88%. Rounding out the top seven high spenders are Algeria, Kuwait, and Israel.
Rank | Country | Military Spend | % of GDP |
---|---|---|---|
1 | ๐บ๐ฆ Ukraine | High | 9.46% |
2 | ๐ธ๐ฆ Saudi Arabia | High | 8.19% |
3 | ๐ด๐ฒ Oman | High | 8.11% |
4 | ๐ถ๐ฆ Qatar | High | 5.88% |
5 | ๐ฉ๐ฟ Algeria | High | 5.70% |
6 | ๐ฐ๐ผ Kuwait | High | 5.66% |
7 | ๐ฎ๐ฑ Israel | High | 5.09% |
8 | ๐ฏ๐ด Jordan | Medium | 4.81% |
9 | ๐ฆ๐ฒ Armenia | Medium | 4.53% |
10 | ๐ฆ๐ฟ Azerbaijan | Medium | 4.53% |
11 | ๐ฑ๐ง Lebanon | Medium | 4.01% |
12 | ๐ท๐บ Russia | Medium | 3.98% |
13 | ๐ง๐ญ Bahrain | Medium | 3.79% |
14 | ๐ต๐ฐ Pakistan | Medium | 3.75% |
15 | ๐ฒ๐ฆ Morocco | Medium | 3.72% |
16 | ๐บ๐ฟ Uzbekistan | Medium | 3.56% |
17 | ๐บ๐ธ U.S. | Medium | 3.48% |
18 | ๐จ๐ด Colombia | Medium | 3.24% |
19 | ๐ฌ๐ท Greece | Medium | 3.15% |
20 | ๐ณ๐ฆ Namibia | Medium | 3.09% |
21 | ๐ง๐ณ Brunei | Medium | 3.09% |
22 | ๐ธ๐ธ South Sudan | Medium | 3.05% |
23 | ๐น๐ฌ Togo | Medium | 3.03% |
24 | ๐ฒ๐ฑ Mali | Medium | 2.90% |
25 | ๐จ๐บ Cuba | Medium | 2.88% |
26 | ๐ธ๐ฌ Singapore | Medium | 2.86% |
27 | ๐ง๐ผ Botswana | Medium | 2.86% |
28 | ๐ฒ๐ฒ Myanmar | Medium | 2.76% |
29 | ๐ง๐ซ Burkina Faso | Medium | 2.70% |
30 | ๐ฎ๐ถ Iraq | Medium | 2.69% |
31 | ๐ฐ๐ท South Korea | Medium | 2.69% |
32 | ๐จ๐ฌ Republic of Congo | Medium | 2.68% |
33 | ๐น๐ฉ Chad | Medium | 2.66% |
34 | ๐ฎ๐ณ India | Medium | 2.58% |
35 | ๐น๐ณ Tunisia | Medium | 2.58% |
36 | ๐ช๐จ Ecuador | Medium | 2.34% |
37 | ๐ฎ๐ท Iran | Medium | 2.32% |
38 | ๐ป๐ณ Viet Nam | Medium | 2.28% |
39 | ๐ฐ๐ญ Cambodia | Medium | 2.26% |
40 | ๐ฒ๐ท Mauritania | Medium | 2.24% |
41 | ๐ณ๐ช Niger | Medium | 2.21% |
42 | ๐ง๐ฎ Burundi | Medium | 2.21% |
43 | ๐น๐ท Turkey | Medium | 2.19% |
44 | ๐ต๐ฑ Poland | Medium | 2.17% |
45 | ๐ฑ๐ป Latvia | Medium | 2.14% |
46 | ๐ฑ๐น Lithuania | Medium | 2.13% |
47 | ๐ช๐ช Estonia | Medium | 2.13% |
48 | ๐ฌ๐ง United Kingdom | Medium | 2.12% |
49 | ๐บ๐พ Uruguay | Medium | 2.11% |
50 | ๐ท๐ธ Serbia | Medium | 2.06% |
51 | ๐บ๐ฌ Uganda | Medium | 2.02% |
52 | ๐ญ๐ท Croatia | Low | 1.97% |
53 | ๐ฆ๐บ Australia | Low | 1.93% |
54 | ๐จ๐ฑ Chile | Low | 1.92% |
55 | ๐ซ๐ท France | Low | 1.91% |
56 | ๐จ๐พ Cyprus | Low | 1.90% |
57 | ๐ท๐ด Romania | Low | 1.87% |
58 | ๐ง๐ฌ Bulgaria | Low | 1.85% |
59 | ๐ธ๐ฟ Eswatini | Low | 1.82% |
60 | ๐ณ๐ด Norway | Low | 1.81% |
61 | ๐จ๐ซ Central African Republic | Low | 1.78% |
62 | ๐ฑ๐ฐ Sri Lanka | Low | 1.77% |
63 | ๐ต๐น Portugal | Low | 1.77% |
64 | ๐น๐ผ Taiwan | Low | 1.76% |
65 | ๐จ๐ณ China | Low | 1.72% |
66 | ๐ฌ๐ช Georgia | Low | 1.71% |
67 | ๐ธ๐ฐ Slovakia | Low | 1.67% |
68 | ๐ฌ๐ผ Guinea-Bissau | Low | 1.65% |
69 | ๐ฐ๐ฌ Kyrgyzstan | Low | 1.62% |
70 | ๐ฌ๐ณ Guinea | Low | 1.61% |
71 | ๐ซ๐ฎ Finland | Low | 1.60% |
72 | ๐ธ๐ณ Senegal | Low | 1.58% |
73 | ๐ญ๐ณ Honduras | Low | 1.56% |
74 | ๐ฌ๐ฆ Gabon | Low | 1.56% |
75 | ๐ฒ๐ฟ Mozambique | Low | 1.56% |
76 | ๐ฑ๐ธ Lesotho | Low | 1.56% |
77 | ๐ฒ๐ช Montenegro | Low | 1.54% |
78 | ๐ซ๐ฏ Fiji | Low | 1.54% |
79 | ๐ฏ๐ฒ Jamaica | Low | 1.49% |
80 | ๐ฆ๐ด Angola | Low | 1.48% |
81 | ๐ฎ๐น Italy | Low | 1.48% |
82 | ๐ญ๐บ Hungary | Low | 1.48% |
83 | ๐ง๐ด Bolivia | Low | 1.46% |
84 | ๐ธ๐จ Seychelles | Low | 1.43% |
85 | ๐ณ๐ฑ Netherlands | Low | 1.41% |
86 | ๐ธ๐ฉ Sudan | Low | 1.39% |
87 | ๐ท๐ผ Rwanda | Low | 1.39% |
88 | ๐ณ๐ต Nepal | Low | 1.36% |
89 | ๐ฉ๐ฐ Denmark | Low | 1.36% |
90 | ๐ฆ๐ฑ Albania | Low | 1.34% |
91 | ๐ช๐ธ Spain | Low | 1.34% |
92 | ๐น๐ญ Thailand | Low | 1.33% |
93 | ๐ฆ๐ซ Afghanistan | Low | 1.33% |
94 | ๐ณ๐ฟ New Zealand | Low | 1.32% |
95 | ๐จ๐ฆ Canada | Low | 1.32% |
96 | ๐ฉ๐ช Germany | Low | 1.31% |
97 | ๐ฒ๐ฐ North Macedonia | Low | 1.30% |
98 | ๐ง๐ท Brazil | Low | 1.29% |
99 | ๐ง๐ฟ Belize | Low | 1.28% |
100 | ๐ธ๐ป El Salvador | Low | 1.28% |
101 | ๐ง๐ฉ Bangladesh | Low | 1.26% |
102 | ๐ฟ๐ฒ Zambia | Low | 1.25% |
103 | ๐ฌ๐ถ Equatorial Guinea | Low | 1.24% |
104 | ๐ฌ๐พ Guyana | Low | 1.22% |
105 | ๐จ๐ฎ Cote d'Ivoire | Low | 1.22% |
106 | ๐ช๐ฌ Egypt | Low | 1.20% |
107 | ๐ต๐ช Peru | Low | 1.20% |
108 | ๐ง๐พ Belarus | Low | 1.18% |
109 | ๐ธ๐ช Sweden | Low | 1.17% |
110 | ๐ฐ๐ช Kenya | Low | 1.13% |
111 | ๐ธ๐ฎ Slovenia | Low | 1.10% |
112 | ๐น๐ฑ Timor Leste | Low | 1.08% |
113 | ๐น๐ฟ Tanzania | Low | 1.05% |
114 | ๐จ๐ฒ Cameroon | Low | 1.04% |
115 | ๐น๐ฏ Tajikistan | Low | 1.03% |
116 | ๐ฏ๐ต Japan | Low | 1.03% |
117 | ๐ง๐ช Belgium | Low | 1.02% |
118 | ๐ฑ๐ท Liberia | Low | 1.00% |
119 | ๐ฒ๐พ Malaysia | Low | 0.98% |
120 | ๐ต๐ญ Philippines | Low | 0.96% |
121 | ๐ต๐พ Paraguay | Low | 0.95% |
122 | ๐ฝ๐ฐ Kosovo | Low | 0.95% |
123 | ๐ฟ๐ฆ South Africa | Low | 0.94% |
124 | ๐ฒ๐ผ Malawi | Low | 0.92% |
125 | ๐ง๐ฆ Bosnia and Herzegovina | Low | 0.84% |
126 | ๐ฐ๐ฟ Kazakhstan | Low | 0.83% |
127 | ๐ฆ๐น Austria | Low | 0.78% |
128 | ๐ฌ๐ฒ Gambia | Low | 0.76% |
129 | ๐น๐น Trinidad & Tobago | Low | 0.75% |
130 | ๐ฎ๐ฉ Indonesia | Low | 0.74% |
131 | ๐จ๐ญ Switzerland | Low | 0.73% |
132 | ๐จ๐ฟ Czech Republic | Low | 0.71% |
133 | ๐ฉ๐ด Dominican Republic | Low | 0.70% |
134 | ๐ฒ๐ณ Mongolia | Low | 0.69% |
135 | ๐ฒ๐ฌ Madagascar | Low | 0.68% |
136 | ๐จ๐ฉ Dem. Rep. of Congo | Low | 0.64% |
137 | ๐ณ๐ฌ Nigeria | Low | 0.64% |
138 | ๐ช๐น Ethiopia | Low | 0.64% |
139 | ๐ธ๐ฑ Sierra Leone | Low | 0.64% |
140 | ๐ฆ๐ท Argentina | Low | 0.63% |
141 | ๐ฑ๐บ Luxembourg | Low | 0.61% |
142 | ๐ฒ๐ฝ Mexico | Low | 0.61% |
143 | ๐ณ๐ฎ Nicaragua | Low | 0.60% |
144 | ๐จ๐ป Cape Verde | Low | 0.54% |
145 | ๐ง๐ฏ Benin | Low | 0.54% |
146 | ๐ฒ๐น Malta | Low | 0.48% |
147 | ๐ฌ๐น Guatemala | Low | 0.45% |
148 | ๐ฌ๐ญ Ghana | Low | 0.43% |
149 | ๐ต๐ฌ Papua New Guinea | Low | 0.38% |
150 | ๐ฒ๐ฉ Moldova | Low | 0.36% |
151 | ๐ฎ๐ช Ireland | Low | 0.27% |
152 | ๐ฟ๐ผ Zimbabwe | Low | 0.26% |
153 | ๐ป๐ช Venezuela | Low | 0.20% |
154 | ๐ญ๐น Haiti | Low | 0.17% |
155 | ๐ฒ๐บ Mauritius | Low | 0.16% |
156 | ๐จ๐ท Costa Rica | Low | 0.00% |
157 | ๐ฎ๐ธ Iceland | Low | 0.00% |
158 | ๐ต๐ฆ Panama | Low | 0.00% |
The medium group consists of 44 countries and is led by four nations (Jordan, Armenia, Azerbaijan, and Lebanon) that all spend more than 4% of their GDP on their militaries. Other familiar countries known to have large military budgets, like Russia, Pakistan, the U.S., India and the UK, are also in this category.
The low spend group has a total of 107 countries, but also contains some surprises. For example, China, France, and Germanyโall in the top 10 countries by absolute military spendโactually have similar amounts of military spend as a percent of GDP as Georgia, Cyprus, and North Macedonia respectively.
At the bottom of the table are countries with either low military importance, or strange technicalities. For example, Mauritius is one of the countries with the lowest military budgets because it doesn’t officially have a standing military, instead relying on two paramilitary forces (a special mobile force and a Coast Guard).
Similarly, Iceland allocates 0% of its GDP towards military spending. In place of a standing army, the country maintains a specialized peacekeeping force, a substantial Coast Guard, and relies on security alliances within NATO, of which it is a member and provides financial support to.
Ranking Defense Spending Per Capita
While the measure above equalizes military spend on economic strength, per-capita military spending shows how much countries allocate while accounting for population size.
On a per-capita basis (again using a five-year average), Qatar leads the ranks with a per-capita spend of $4,564, well-ahead of Israel at $2,535, and Saudi Arabia at $1,928.
Rank | Country | Per Capita Spend ($) |
---|---|---|
1 | ๐ถ๐ฆ Qatar | $4,564 |
2 | ๐ฎ๐ฑ Israel | $2,535 |
3 | ๐ธ๐ฆ Saudi Arabia | $1,928 |
4 | ๐ธ๐ฌ Singapore | $1,837 |
5 | ๐ฐ๐ผ Kuwait | $1,815 |
6 | ๐บ๐ธ U.S. | $1,815 |
7 | ๐ณ๐ด Norway | $1,438 |
8 | ๐ด๐ฒ Oman | $1,254 |
9 | ๐ฆ๐บ Australia | $1,131 |
10 | ๐ง๐ณ Brunei | $959 |
11 | ๐ฌ๐ง UK | $913 |
12 | ๐ฐ๐ท South Korea | $894 |
13 | ๐ง๐ญ Bahrain | $863 |
14 | ๐ฉ๐ฐ Denmark | $861 |
15 | ๐ซ๐ท France | $811 |
16 | ๐ซ๐ฎ Finland | $801 |
17 | ๐ณ๐ฑ Netherlands | $765 |
18 | ๐ฑ๐บ Luxembourg | $694 |
19 | ๐ธ๐ช Sweden | $662 |
20 | ๐จ๐ญ Switzerland | $647 |
21 | ๐จ๐ฆ Canada | $645 |
22 | ๐ฌ๐ท Greece | $629 |
23 | ๐ฉ๐ช Germany | $623 |
24 | ๐ณ๐ฟ New Zealand | $610 |
25 | ๐ช๐ช Estonia | $535 |
26 | ๐น๐ผ Taiwan | $495 |
27 | ๐ฎ๐น Italy | $494 |
28 | ๐ง๐ช Belgium | $487 |
29 | ๐ท๐บ Russia | $467 |
30 | ๐ฑ๐น Lithuania | $463 |
31 | ๐ต๐น Portugal | $417 |
32 | ๐ฑ๐ป Latvia | $405 |
33 | ๐จ๐พ Cyprus | $399 |
34 | ๐ฏ๐ต Japan | $398 |
35 | ๐ช๐ธ Spain | $395 |
36 | ๐ฆ๐น Austria | $393 |
37 | ๐ต๐ฑ Poland | $359 |
38 | ๐บ๐พ Uruguay | $354 |
39 | ๐ธ๐ฐ Slovakia | $334 |
40 | ๐ฑ๐ง Lebanon | $334 |
41 | ๐ธ๐ฎ Slovenia | $302 |
42 | ๐บ๐ฆ Ukraine | $302 |
43 | ๐ญ๐ท Croatia | $294 |
44 | ๐จ๐ฑ Chile | $292 |
45 | ๐ท๐ด Romania | $258 |
46 | ๐ญ๐บ Hungary | $248 |
47 | ๐ฎ๐ช Ireland | $235 |
48 | ๐ธ๐จ Seychelles | $230 |
49 | ๐ฆ๐ฟ Azerbaijan | $226 |
50 | ๐ฉ๐ฟ Algeria | $219 |
51 | ๐ฆ๐ฒ Armenia | $217 |
52 | ๐ง๐ผ Botswana | $215 |
53 | ๐ฏ๐ด Jordan | $207 |
54 | ๐น๐ท Turkey | $199 |
55 | ๐จ๐ด Colombia | $197 |
56 | ๐ง๐ฌ Bulgaria | $194 |
57 | ๐จ๐ณ China | $183 |
58 | ๐ฒ๐น Malta | $175 |
59 | ๐จ๐ฟ Czech Republic | $175 |
60 | ๐ฎ๐ท Iran | $169 |
61 | ๐ณ๐ฆ Namibia | $159 |
62 | ๐ฎ๐ถ Iraq | $145 |
63 | ๐ช๐จ Ecuador | $138 |
64 | ๐ฒ๐ช Montenegro | $137 |
65 | ๐ท๐ธ Serbia | $133 |
66 | ๐น๐น Trinidad & Tobago | $131 |
67 | ๐ฌ๐ฆ Gabon | $124 |
68 | ๐ฒ๐ฆ Morocco | $122 |
69 | ๐ฌ๐ถ Equatorial Guinea | $112 |
70 | ๐ฒ๐พ Malaysia | $109 |
71 | ๐ง๐ท Brazil | $107 |
72 | ๐น๐ญ Thailand | $97 |
73 | ๐ฌ๐พ Guyana | $92 |
74 | ๐น๐ณ Tunisia | $91 |
75 | ๐ซ๐ฏ Fiji | $83 |
76 | ๐ฒ๐ฐ North Macedonia | $83 |
77 | ๐ฐ๐ฟ Kazakhstan | $82 |
78 | ๐ต๐ช Peru | $81 |
79 | ๐ฌ๐ช Georgia | $80 |
80 | ๐ง๐พ Belarus | $80 |
81 | ๐ฏ๐ฒ Jamaica | $77 |
82 | ๐ฆ๐ฑ Albania | $76 |
83 | ๐ธ๐ฟ Eswatini | $72 |
84 | ๐ฑ๐ฐ Sri Lanka | $69 |
85 | ๐ฆ๐ท Argentina | $66 |
86 | ๐ง๐ฟ Belize | $60 |
87 | ๐ฒ๐ฝ Mexico | $59 |
88 | ๐ฉ๐ด Dominican Republic | $58 |
89 | ๐ป๐ณ Viet Nam | $58 |
90 | ๐ฟ๐ฆ South Africa | $56 |
91 | ๐ธ๐ป El Salvador | $54 |
92 | ๐ง๐ฆ Bosnia and Herzegovina | $54 |
93 | ๐ฎ๐ณ India | $53 |
94 | ๐จ๐ฌ Republic of Congo | $53 |
95 | ๐ต๐พ Paraguay | $52 |
96 | ๐ง๐ด Bolivia | $51 |
97 | ๐ต๐ฐ Pakistan | $49 |
98 | ๐บ๐ฟ Uzbekistan | $44 |
99 | ๐ฆ๐ด Angola | $43 |
100 | ๐ฝ๐ฐ Kosovo | $42 |
101 | ๐ฒ๐ท Mauritania | $42 |
102 | ๐ญ๐ณ Honduras | $42 |
103 | ๐ช๐ฌ Egypt | $41 |
104 | ๐ฐ๐ญ Cambodia | $36 |
105 | ๐ฒ๐ฒ Myanmar | $35 |
106 | ๐ต๐ญ Philippines | $33 |
107 | ๐ฒ๐ณ Mongolia | $33 |
108 | ๐ฎ๐ฉ Indonesia | $31 |
109 | ๐ง๐ฉ Bangladesh | $27 |
110 | ๐น๐ฑ Timor Leste | $27 |
111 | ๐ฒ๐ฑ Mali | $26 |
112 | ๐ธ๐ณ Senegal | $24 |
113 | ๐จ๐ฎ Cote d'Ivoire | $23 |
114 | ๐น๐ฌ Togo | $21 |
115 | ๐ฐ๐ช Kenya | $21 |
116 | ๐ฐ๐ฌ Kyrgyzstan | $20 |
117 | ๐ง๐ซ Burkina Faso | $20 |
118 | ๐ฌ๐ณ Guinea | $19 |
119 | ๐ฑ๐ธ Lesotho | $19 |
120 | ๐จ๐ป Cape Verde | $19 |
121 | ๐ฌ๐น Guatemala | $19 |
122 | ๐น๐ฉ Chad | $18 |
123 | ๐ธ๐ธ South Sudan | $18 |
124 | ๐ธ๐ฉ Sudan | $18 |
125 | ๐บ๐ฌ Uganda | $18 |
126 | ๐ฟ๐ผ Zimbabwe | $17 |
127 | ๐ฟ๐ฒ Zambia | $16 |
128 | ๐ฒ๐บ Mauritius | $16 |
129 | ๐จ๐ฒ Cameroon | $16 |
130 | ๐ณ๐ต Nepal | $15 |
131 | ๐ณ๐ฌ Nigeria | $14 |
132 | ๐ณ๐ฎ Nicaragua | $12 |
133 | ๐ฌ๐ผ Guinea-Bissau | $12 |
134 | ๐น๐ฟ Tanzania | $12 |
135 | ๐จ๐บ Cuba | $11 |
136 | ๐ท๐ผ Rwanda | $11 |
137 | ๐ฒ๐ฉ Moldova | $11 |
138 | ๐ต๐ฌ Papua New Guinea | $10 |
139 | ๐ณ๐ช Niger | $10 |
140 | ๐น๐ฏ Tajikistan | $9 |
141 | ๐จ๐ซ Central African Republic | $8 |
142 | ๐ฒ๐ฟ Mozambique | $8 |
143 | ๐ฌ๐ญ Ghana | $8 |
144 | ๐ง๐ฏ Benin | $7 |
145 | ๐ง๐ฎ Burundi | $7 |
146 | ๐ฆ๐ซ Afghanistan | $6 |
147 | ๐ฌ๐ฒ Gambia | $6 |
148 | ๐ช๐น Ethiopia | $5 |
149 | ๐ป๐ช Venezuela | $5 |
150 | ๐ฒ๐ผ Malawi | $4 |
151 | ๐ธ๐ฑ Sierra Leone | $3 |
152 | ๐ฒ๐ฌ Madagascar | $3 |
153 | ๐จ๐ฉ Dem. Rep. of Congo | $3 |
154 | ๐ฑ๐ท Liberia | $3 |
155 | ๐ญ๐น Haiti | $2 |
156 | ๐จ๐ท Costa Rica | $0 |
157 | ๐ฎ๐ธ Iceland | $0 |
158 | ๐ต๐ฆ Panama | $0 |
Measured this way, we get a perspective of how small defense budgets can be per person, even if the total expenditure is large.
For example, India has the fourth-highest total defense expenditure in 2022, but because of its massive population only sets aside $53 per resident for its military, putting it solidly at the bottom third of the per-capita rankings.
Patterns Revealed By Measuring Military Spend
Changing how we look at a countryโs military budget can reveal a lot more than just looking at absolute numbers.
For example, the Middle East is the region with the highest spenders on defense as a percentage of their GDP, giving us insight into regional security concerns.
Countries from the medium group of military spendingโincluding parts of Eastern Europe, sub-Saharan Africa, and South Asiaโhighlight past or recent conflict zones between neighbors, countries with internal strife, or countries wary of a regional aggressor. Ukraine’s average per capita military spend, for example, was just $122.4 from 2018 to 2021. The next year, it jumped nearly 10 times to $1,018.66 per person after Russia’s invasion.
In fact, European military spending saw its sharpest one-year jump in 30 years as a direct result of the war.
Alongside European anxieties, ongoing tension between China and Taiwan has also contributed to increased military spending in Asia and Oceania. Will these budgets continue their dramatic ascent or will they rise evenly alongside their relative economies in 2023?
Data note: For these comparisons, the creator is calculating five-year averages (using data from 2018-2022) for military spending as a percentage of GDP and per-capita military spending for each country. The military expenditure data is pulled from Stockholm International Peace Research Institute.
Data for some countries is missing or may vary significantly from official figures. Countries with up to
two years of missing data had averages calculated on the years available, while countries with three or more years of missing data have been removed from this dataset, including: Djibouti, Eritrea, North Korea, Laos, Libya, Somalia, Syria, Turkmenistan, UAE, and Yemen.
Please see SIPRI’s methodologies page for more details on how they collect their data and create estimates.
-
United States3 weeks ago
Ranked: The Cities with the Most Skyscrapers in 2023
-
Markets2 days ago
The Fastest Rising Asset Classes in 2023
-
Urbanization3 weeks ago
Ranked: The World’s Biggest Steel Producers, by Country
-
Markets1 day ago
Mapped: The State of Economic Freedom in 2023
-
Visual Capitalist2 weeks ago
Join Us For Data Creator Con 2023
-
Datastream3 hours ago
The 10 Longest Range EVs for 2023
-
Technology4 weeks ago
Visualizing Global Attitudes Towards AI
-
Economy2 weeks ago
Charted: Public Trust in the Federal Reserve