Maps
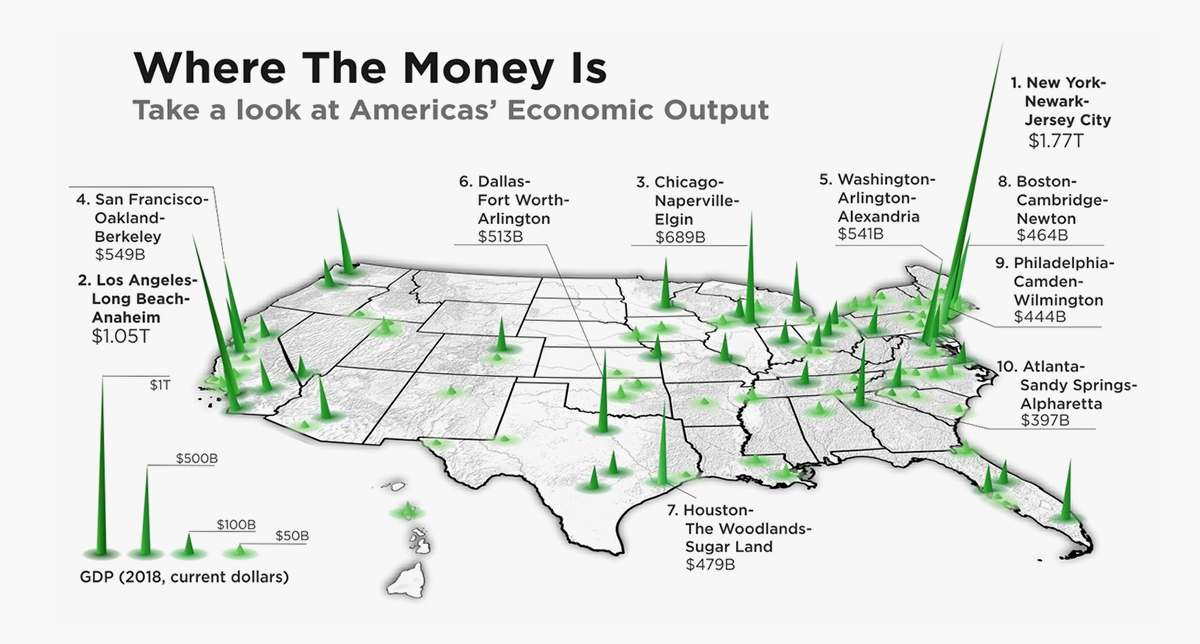
3D Map: The U.S. Cities With the Highest Economic Output
3D Map: The U.S. Cities With the Highest Economic Output
At over $21 trillion, the U.S. holds the title of the world’s largest economy—accounting for almost a quarter of the global GDP total. However, the fact is that a few select cities are responsible for a large share of the country’s total economic output.
This unique 3D map from HowMuch puts into perspective the city corridors which contribute the most to the American economy at large.
Top 10 Metros by Economic Output
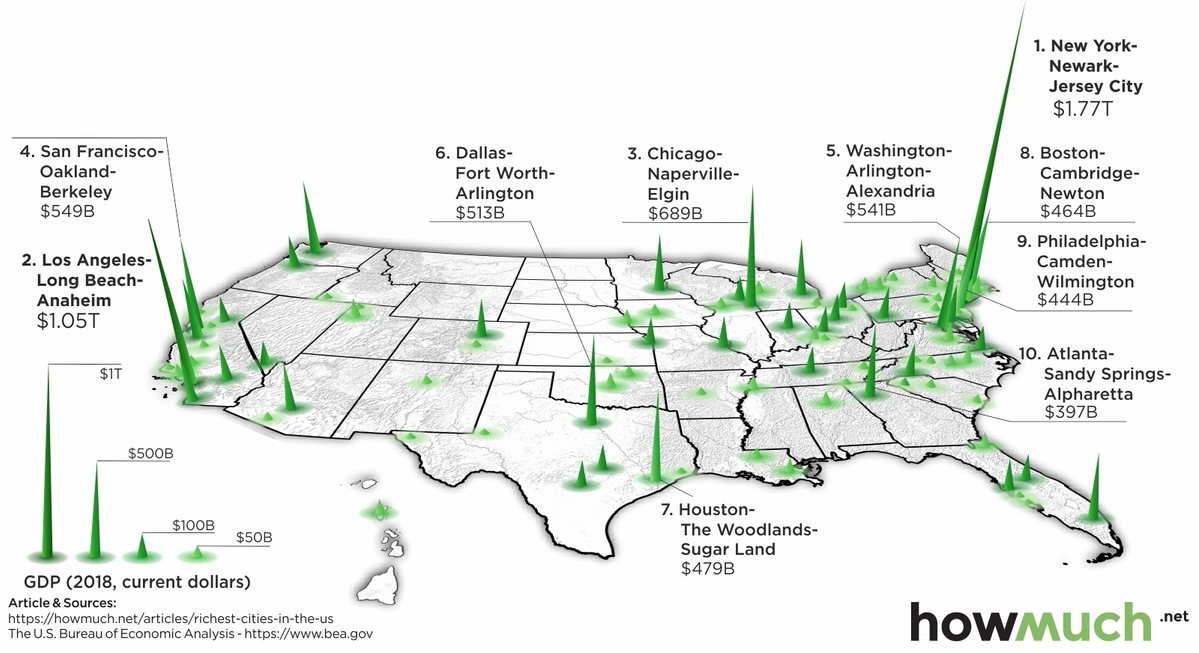
The visualization pulls the latest data from the U.S. Bureau of Economic Analysis (BEA, 2018), and ranks the top 10 metro area economies in the country.
One thing is immediately clear—the New York metro area dwarfs all other metro area by a large margin. This cluster, which includes Newark and Jersey City, is bigger than the metro areas surrounding Los Angeles and Chicago combined.
| Rank | Metro Area | State codes | GDP (2018) |
|---|---|---|---|
| #1 | New York-Newark-Jersey City | NY-NJ-PA | $1.77T |
| #2 | Los Angeles-Long Beach-Anaheim | CA | $1.05T |
| #3 | Chicago-Naperville-Elgin | IL-IN-WI | $0.69T |
| #4 | San Francisco-Oakland-Berkeley | CA | $0.55T |
| #5 | Washington-Arlington-Alexandria | DC-VA-MD-WV | $0.54T |
| #6 | Dallas-Fort Worth-Arlington | TX | $0.51T |
| #7 | Houston-The Woodlands-Sugar Land | TX | $0.48T |
| #8 | Boston-Cambridge-Newton | MA-NH | $0.46T |
| #9 | Philadelphia-Camden-Wilmington | PA-NJ-DE-MD | $0.44T |
| #10 | Atlanta-Sandy Springs-Alpharetta | GA | $0.40T |
| Total GDP | $6.90T |
Coming in fourth place is San Francisco on the West Coast, with $549 billion in total economic output each year. Meanwhile in the South, the Dallas metroplex brings in $478 billion, placing it sixth in the ranks.
It’s worth noting that using individual metro areas is one way to view things, but geographers also think of urban life in broader terms as well. Given the proximity of cities in the Northeast, places like Boston, NYC, and Washington, D.C. are sometimes grouped into a single megaregion. When viewed this way, the corridor is actually the world’s largest in economic terms.
U.S. States: Sum of Its Parts
Zooming out beyond just these massive cities demonstrates the combined might of the U.S. in another unique way. Tallying all the urban and rural areas, every state economy can be compared to the size of entire countries.

According to the American Enterprise Institute, the state of California brings in a GDP that rivals the United Kingdom in its entirety.
By this same measure, Texas competes with Canada in terms of pure economic output, despite a total land area that’s 15 times less that of the Great White North.
With COVID-19 continuing to impact parts of the global economy disproportionately, how will these kinds of economic comparisons hold up in the future?


Maps
The Largest Earthquakes in the New York Area (1970-2024)
The earthquake that shook buildings across New York in April 2024 was the third-largest quake in the Northeast U.S. over the past 50 years.


The Largest Earthquakes in the New York Area
This was originally posted on our Voronoi app. Download the app for free on Apple or Android and discover incredible data-driven charts from a variety of trusted sources.
The 4.8 magnitude earthquake that shook buildings across New York on Friday, April 5th, 2024 was the third-largest quake in the U.S. Northeast area over the past 50 years.
In this map, we illustrate earthquakes with a magnitude of 4.0 or greater recorded in the Northeastern U.S. since 1970, according to the United States Geological Survey (USGS).
Shallow Quakes and Older Buildings
The earthquake that struck the U.S. Northeast in April 2024 was felt by millions of people from Washington, D.C., to north of Boston. It even caused a full ground stop at Newark Airport.
The quake, occurring just 5 km beneath the Earth’s surface, was considered shallow, which is what contributed to more intense shaking at the surface.
According to the USGS, rocks in the eastern U.S. are significantly older, denser, and harder than those on the western side, compressed by time. This makes them more efficient conduits for seismic energy. Additionally, buildings in the Northeast tend to be older and may not adhere to the latest earthquake codes.
Despite disrupting work and school life, the earthquake was considered minor, according to the Michigan Technological University magnitude scale:
| Magnitude | Earthquake Effects | Estimated Number Each Year |
|---|---|---|
| 2.5 or less | Usually not felt, but can be recorded by seismograph. | Millions |
| 2.5 to 5.4 | Often felt, but only causes minor damage. | 500,000 |
| 5.5 to 6.0 | Slight damage to buildings and other structures. | 350 |
| 6.1 to 6.9 | May cause a lot of damage in very populated areas. | 100 |
| 7.0 to 7.9 | Major earthquake. Serious damage. | 10-15 |
| 8.0 or greater | Great earthquake. Can totally destroy communities near the epicenter. | One every year or two |
The largest earthquake felt in the area over the past 50 years was a 5.3 magnitude quake that occurred in Au Sable Forks, New York, in 2002. It damaged houses and cracked roads in a remote corner of the Adirondack Mountains, but caused no injuries.
| Date | Magnitude | Location | State |
|---|---|---|---|
| April 20, 2002 | 5.3 | Au Sable Forks | New York |
| October 7, 1983 | 5.1 | Newcomb | New York |
| April 5, 2024 | 4.8 | Whitehouse Station | New Jersey |
| October 16, 2012 | 4.7 | Hollis Center | Maine |
| January 16, 1994 | 4.6 | Sinking Spring | Pennsylvania |
| January 19, 1982 | 4.5 | Sanbornton | New Hampshire |
| September 25, 1998 | 4.5 | Adamsville | Pennsylvania |
| June 9, 1975 | 4.2 | Altona | New York |
| May 29, 1983 | 4.2 | Peru | Maine |
| April 23, 1984 | 4.2 | Conestoga | Pennsylvania |
| January 16, 1994 | 4.2 | Sinking Spring | Pennsylvania |
| November 3, 1975 | 4 | Long Lake | New York |
| June 17, 1991 | 4 | Worcester | New York |
The largest earthquake in U.S. history, however, was the 1964 Good Friday quake in Alaska, measuring 9.2 magnitude and killing 131 people.

-

 Markets1 week ago
Ranked: The Largest U.S. Corporations by Number of Employees
-

 Green3 weeks ago
Ranked: Top Countries by Total Forest Loss Since 2001
-

 Money2 weeks ago
Where Does One U.S. Tax Dollar Go?
-

 Automotive2 weeks ago
Almost Every EV Stock is Down After Q1 2024
-

 AI2 weeks ago
The Stock Performance of U.S. Chipmakers So Far in 2024
-

 Markets2 weeks ago
Charted: Big Four Market Share by S&P 500 Audits
-

 Real Estate2 weeks ago
Ranked: The Most Valuable Housing Markets in America
-

 Money2 weeks ago
Which States Have the Highest Minimum Wage in America?