Markets
35 Chinese Cities With Economies as Big as Countries
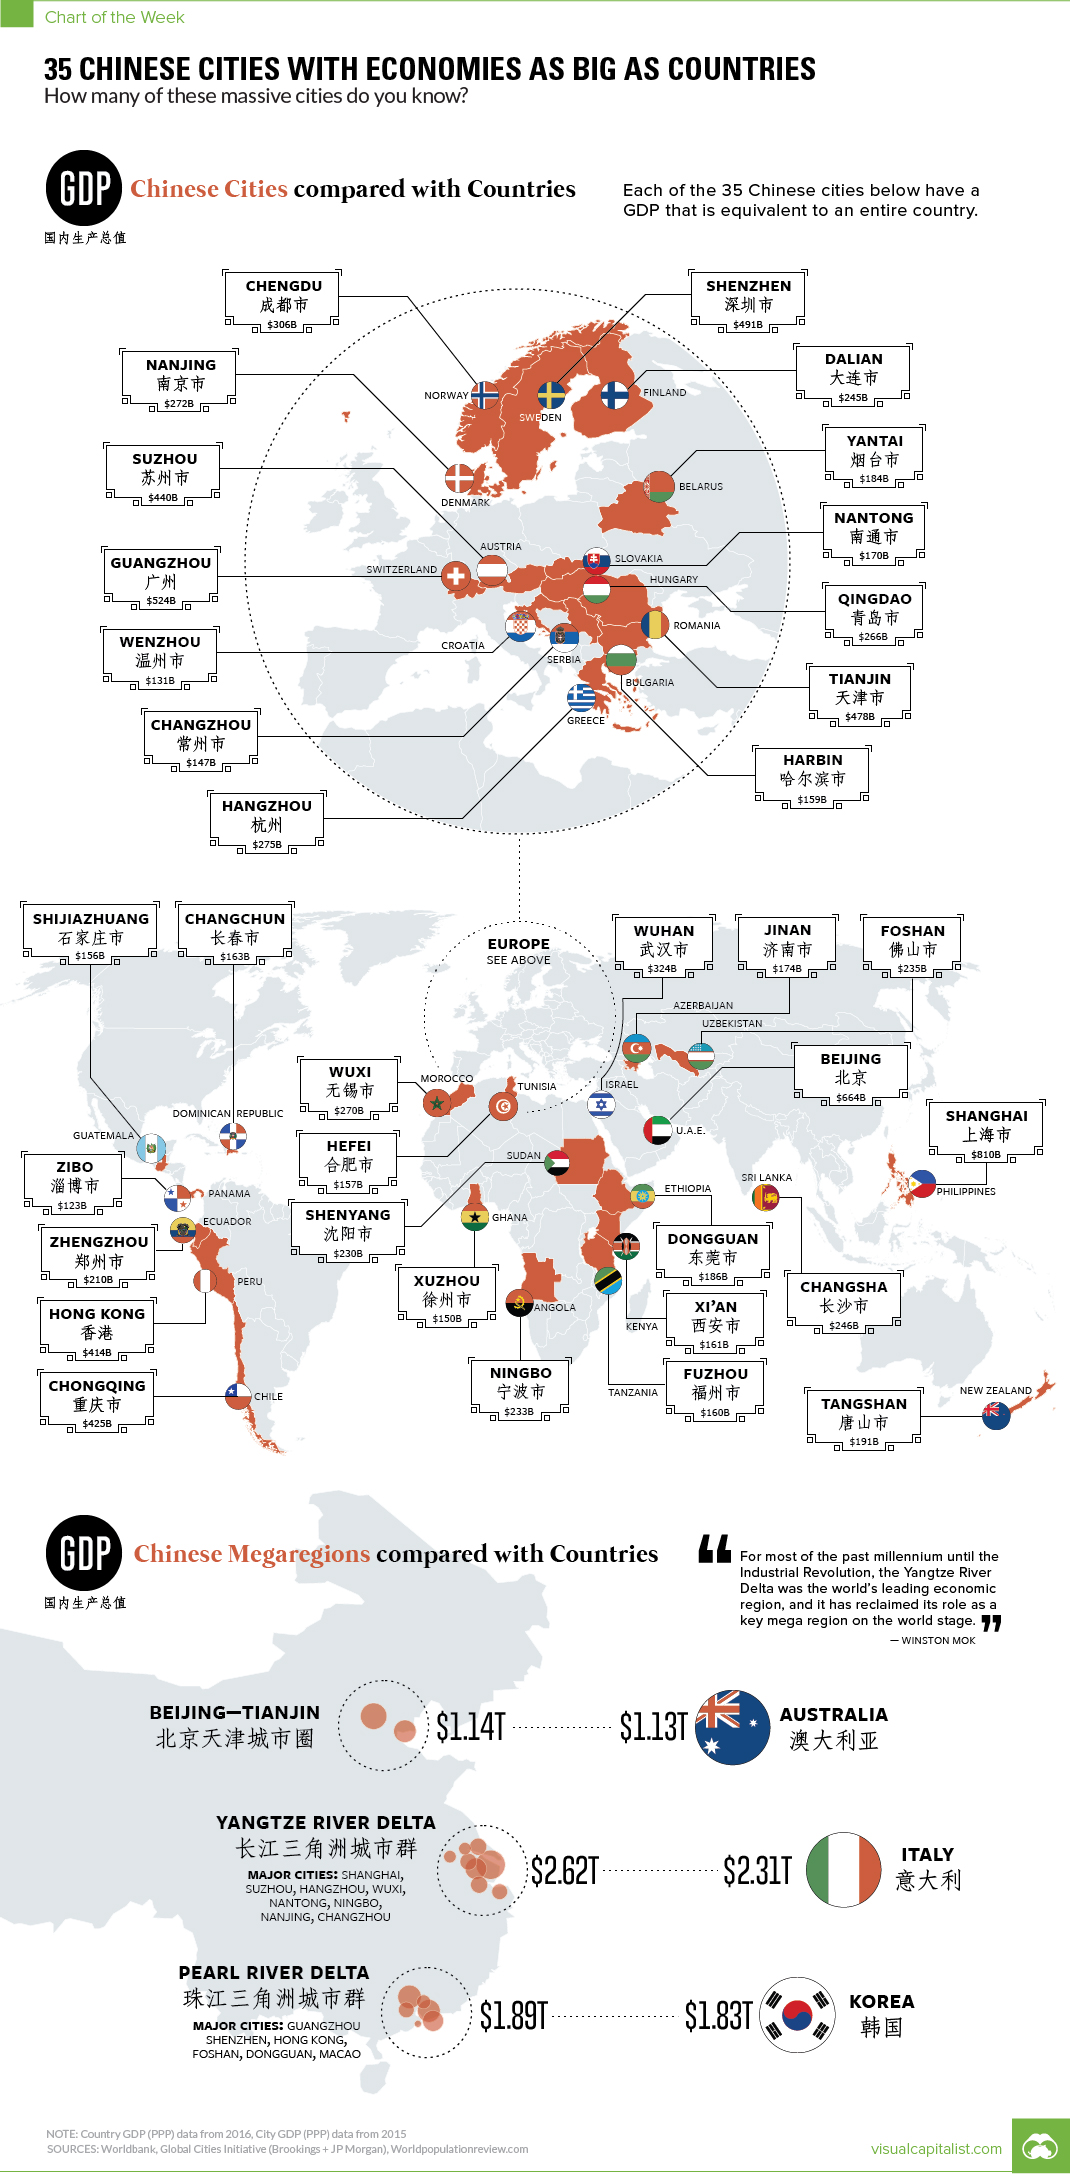
35 Chinese Cities With Economies As Big as Countries
The Chart of the Week is a weekly Visual Capitalist feature on Fridays.
Gaining perspective on China’s monstrous economy isn’t always the easiest thing to do.
With 1.4 billion people and the third-largest geographical area, the country is a vast place to begin with. Add in explosive economic growth, a market-oriented but Communist government, a longstanding and complex cultural history, and self-inflicted demographic challenges – and understanding China can be even more of a puzzle.
City by City
To truly grasp the emergence of China, one approach is to look at the impressive economic footprint made by the country’s cities.
Of course, cities like Shanghai, Beijing, and Hong Kong are the metro economic powerhouses that most people are familiar with. But have you heard of cities like Shijiazhuang, Wuxi, Changsha, Suzhou, Ningbo, Foshan, or Yantai?
There are literally dozens of Chinese cities that most people in Western countries have never heard of – yet they each hold millions of people and have an economic output comparable to nations.
Here’s a list of 35 of them, the size of their local economy, and a comparably sized national economy:
| Rank | Chinese City | City GDP (2015, PPP, in billions) | Comparable Country |
|---|---|---|---|
| #1 | Shanghai | $810 | Philippines |
| #2 | Beijing | $664 | U.A.E. |
| #3 | Guangzhou | $524 | Switzerland |
| #4 | Shenzhen | $491 | Sweden |
| #5 | Tianjin | $478 | Romania |
| #6 | Suzhou | $440 | Austria |
| #7 | Chongqing | $425 | Chile |
| #8 | Hong Kong | $414 | Peru |
| #9 | Wuhan | $324 | Israel |
| #10 | Chengdu | $306 | Norway |
| #11 | Hangzhou | $275 | Greece |
| #12 | Nanjing | $272 | Denmark |
| #13 | Wuxi | $270 | Morocco |
| #14 | Qingdao | $266 | Hungary |
| #15 | Changsha | $246 | Sri Lanka |
| #16 | Dalian | $245 | Finland |
| #17 | Foshan | $235 | Uzbekistan |
| #18 | Ningbo | $233 | Angola |
| #19 | Shenyang | $230 | Sudan |
| #20 | Zhengzhou | $210 | Ecuador |
| #21 | Tangshan | $191 | New Zealand |
| #22 | Dongguan | $186 | Ethiopia |
| #23 | Yantai | $184 | Belarus |
| #24 | Jinan | $174 | Azerbaijan |
| #25 | Nantong | $170 | Slovakia |
| #26 | Changchun | $163 | Dominican Republic |
| #27 | Xi'an | $161 | Kenya |
| #28 | Fuzhou | $160 | Tanzania |
| #29 | Harbin | $159 | Bulgaria |
| #30 | Hefei | $157 | Tunisia |
| #31 | Shijiazhuang | $156 | Guatemala |
| #32 | Xuzhou | $150 | Ghana |
| #33 | Changzhou | $147 | Serbia |
| #34 | Wenzhou | $131 | Croatia |
| #35 | Zibo | $123 | Panama |
Megaregions
It’s also important to remember that these cities don’t exist in isolation, and are instead cogs in the wheels of larger megaregions. Such areas would be comparable to the Northeast U.S., in which New York City, Philadelphia, Boston, Baltimore, and Washington, D.C. are all hours apart and remain largely integrated as a regional economy.
In China, there are three main megaregions worth noting:
Yangtze River Delta
With a combined GDP of $2.17 trillion, which is comparable to Italy, the Yangtze River Delta contains cities like Shanghai, Suzhou, Hangzhou, Wuxi, Ningbo, and Changzhou.
Pearl River Delta
With a combined GDP of $1.89 trillion, which is comparable to South Korea, the Pearl River Delta has cities like Hong Kong, Guangzhou, Shenzhen, Foshan, Dongguan, and Macao.
Beijing-Tianjin
With a combined GDP of $1.14 trillion, which is comparable to Australia, this megaregion holds the two largest cities in northern China, Beijing and Tianjin. The two cities are a 30-minute bullet train ride apart.
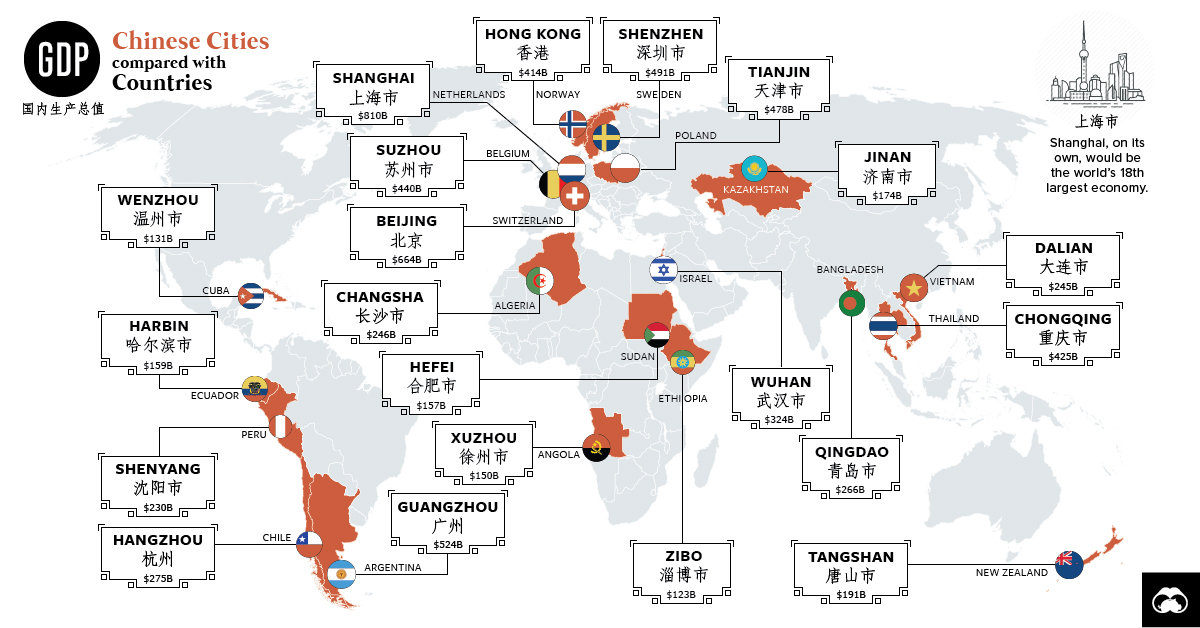
Note: After publication, it was pointed out that GDP figures for the Chinese cities seemed to be adjusted for PPP and that our source (Brookings Institution) incorrectly had labeled them as nominal in the tables of this document. We have since updated the infographic so that everything is based on PPP, and added four new cities as well.


Economy
Economic Growth Forecasts for G7 and BRICS Countries in 2024
The IMF has released its economic growth forecasts for 2024. How do the G7 and BRICS countries compare?


G7 & BRICS Real GDP Growth Forecasts for 2024
The International Monetary Fund’s (IMF) has released its real gross domestic product (GDP) growth forecasts for 2024, and while global growth is projected to stay steady at 3.2%, various major nations are seeing declining forecasts.
This chart visualizes the 2024 real GDP growth forecasts using data from the IMF’s 2024 World Economic Outlook for G7 and BRICS member nations along with Saudi Arabia, which is still considering an invitation to join the bloc.
Get the Key Insights of the IMF’s World Economic Outlook
Want a visual breakdown of the insights from the IMF’s 2024 World Economic Outlook report?
This visual is part of a special dispatch of the key takeaways exclusively for VC+ members.
Get the full dispatch of charts by signing up to VC+.
Mixed Economic Growth Prospects for Major Nations in 2024
Economic growth projections by the IMF for major nations are mixed, with the majority of G7 and BRICS countries forecasted to have slower growth in 2024 compared to 2023.
Only three BRICS-invited or member countries, Saudi Arabia, the UAE, and South Africa, have higher projected real GDP growth rates in 2024 than last year.
| Group | Country | Real GDP Growth (2023) | Real GDP Growth (2024P) |
|---|---|---|---|
| G7 | 🇺🇸 U.S. | 2.5% | 2.7% |
| G7 | 🇨🇦 Canada | 1.1% | 1.2% |
| G7 | 🇯🇵 Japan | 1.9% | 0.9% |
| G7 | 🇫🇷 France | 0.9% | 0.7% |
| G7 | 🇮🇹 Italy | 0.9% | 0.7% |
| G7 | 🇬🇧 UK | 0.1% | 0.5% |
| G7 | 🇩🇪 Germany | -0.3% | 0.2% |
| BRICS | 🇮🇳 India | 7.8% | 6.8% |
| BRICS | 🇨🇳 China | 5.2% | 4.6% |
| BRICS | 🇦🇪 UAE | 3.4% | 3.5% |
| BRICS | 🇮🇷 Iran | 4.7% | 3.3% |
| BRICS | 🇷🇺 Russia | 3.6% | 3.2% |
| BRICS | 🇪🇬 Egypt | 3.8% | 3.0% |
| BRICS-invited | 🇸🇦 Saudi Arabia | -0.8% | 2.6% |
| BRICS | 🇧🇷 Brazil | 2.9% | 2.2% |
| BRICS | 🇿🇦 South Africa | 0.6% | 0.9% |
| BRICS | 🇪🇹 Ethiopia | 7.2% | 6.2% |
| 🌍 World | 3.2% | 3.2% |
China and India are forecasted to maintain relatively high growth rates in 2024 at 4.6% and 6.8% respectively, but compared to the previous year, China is growing 0.6 percentage points slower while India is an entire percentage point slower.
On the other hand, four G7 nations are set to grow faster than last year, which includes Germany making its comeback from its negative real GDP growth of -0.3% in 2023.
Faster Growth for BRICS than G7 Nations
Despite mostly lower growth forecasts in 2024 compared to 2023, BRICS nations still have a significantly higher average growth forecast at 3.6% compared to the G7 average of 1%.
While the G7 countries’ combined GDP is around $15 trillion greater than the BRICS nations, with continued higher growth rates and the potential to add more members, BRICS looks likely to overtake the G7 in economic size within two decades.
BRICS Expansion Stutters Before October 2024 Summit
BRICS’ recent expansion has stuttered slightly, as Argentina’s newly-elected president Javier Milei declined its invitation and Saudi Arabia clarified that the country is still considering its invitation and has not joined BRICS yet.
Even with these initial growing pains, South Africa’s Foreign Minister Naledi Pandor told reporters in February that 34 different countries have submitted applications to join the growing BRICS bloc.
Any changes to the group are likely to be announced leading up to or at the 2024 BRICS summit which takes place October 22-24 in Kazan, Russia.
Get the Full Analysis of the IMF’s Outlook on VC+
This visual is part of an exclusive special dispatch for VC+ members which breaks down the key takeaways from the IMF’s 2024 World Economic Outlook.
For the full set of charts and analysis, sign up for VC+.

-

 Markets1 week ago
U.S. Debt Interest Payments Reach $1 Trillion
-

 Business2 weeks ago
Charted: Big Four Market Share by S&P 500 Audits
-

 Real Estate2 weeks ago
Ranked: The Most Valuable Housing Markets in America
-

 Money2 weeks ago
Which States Have the Highest Minimum Wage in America?
-

 AI2 weeks ago
Ranked: Semiconductor Companies by Industry Revenue Share
-

 Markets2 weeks ago
Ranked: The World’s Top Flight Routes, by Revenue
-

 Demographics2 weeks ago
Population Projections: The World’s 6 Largest Countries in 2075
-

 Markets2 weeks ago
The Top 10 States by Real GDP Growth in 2023