Misc
Animation: How the European Map Has Changed Over 2,400 Years
How the European Map Has Changed Over 2,400 Years
The history of Europe is breathtakingly complex. While there are rare exceptions like Andorra and Portugal, which have had remarkably static borders for hundreds of years, jurisdiction over portions of the continent’s landmass have changed hands innumerable times.
Today’s video comes to us from YouTube channel Cottereau, and it shows the evolution of European map borders starting from 400 BC. Empires rise and fall, invasions sweep across the continent, and modern countries slowly begin to take shape (with the added bonus of an extremely dramatic instrumental).
Below are nine highlights and catalysts that shifted the dividing lines of the European map:
146 BC – A Year of Conquest
146 BC was a year of conquest and expansion for the Roman Republic. The fall of Carthage left the Romans in control of territory in North Africa, and the ransack and destruction of the Greek city-state of Corinth also kickstarted an era of Roman influence in that region. These decisive victories paved the way for the Roman Empire’s eventual domination of the Mediterranean.
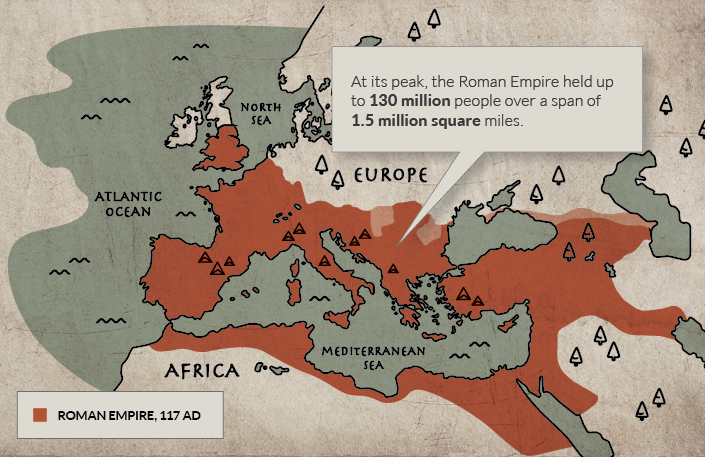
117 AD – Peak Roman Empire
The peak of the Roman Empire is one of the more dramatic moments shown on this animated European map. At its height, under Trajan, the Roman Empire was a colossal 1.7 million square miles (quite a feat in an era without motorized vehicles and modern communication tools). This enormous empire remained mostly intact until 395, when it was irreparably split into Eastern and Western regions.
370 AD – The Arrival of the Huns
Spurred on by severe drought conditions in Central Asia, the Huns reached Europe and found a Roman Empire weakened by currency debasement, economic instability, overspending, and increasing incursions from rivals along its borders.
The Huns waged their first attack on the Eastern Roman Empire in 395, but it was not until half a century later—under the leadership of Attila the Hun—that hordes pushed deeper into Europe, sacking and razing cities along the way. The Romans would later get their revenge when they attacked the quarreling Goths and Huns, bouncing the latter out of Central Europe.
1241 – The Mongol Invasion of Europe
In the mid-13th century, the “Golden Horde” led by grandsons of Genghis Khan, roared into Russia and Eastern Europe sacking cities along the way. Facing invasion from formidable Mongol forces, central European princes temporarily placed their regional conflicts aside to defend their territory. Though the Mongols were slowly pushed eastward, they loomed large on the fringes of Europe until almost the 16th century.
1362 – Lithuania
Today, Lithuania is one of Europe’s smallest countries, but at its peak in the middle ages, it was one of the largest states on the continent. A pivotal moment for Lithuania came after a decisive win at the Battle of Blue Waters. This victory stifled the expansion of the Golden Horde, and brought present-day Ukraine into its sphere of influence.
1648 – Kleinstaaterei
The end of the Holy Roman Empire highlights the extreme territorial fragmentation in Germany and neighboring regions, in an era referred to as Kleinstaaterei.
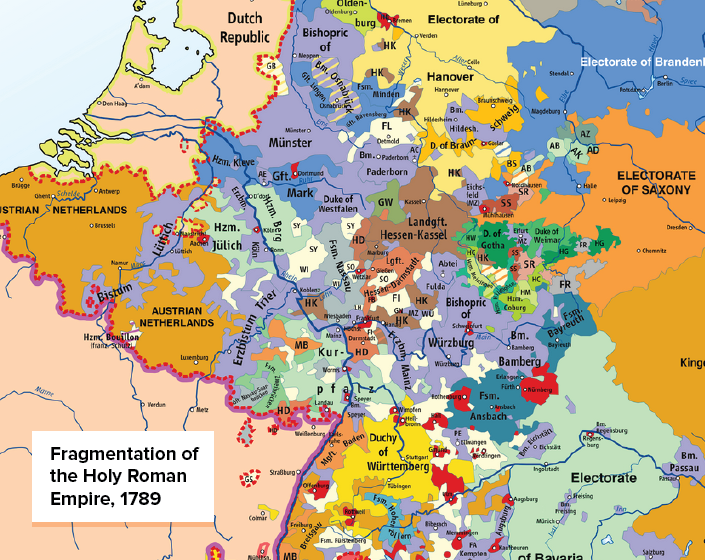
Even as coherent nation states formed around it, the Holy Roman Empire and its remnants wouldn’t coalesce until Germany rose from the wreckage of the Franco-Prussian War in 1871. Unification helped position Germany as a major power, and by 1900 the country had the largest economy in Europe.
1919 – The Ottoman Empire
The Ottoman Empire—a fixture in Eastern Europe for hundreds of years—was in its waning years by the beginning of the 20th century. The empire had ceded territory in two costly wars with Italy and Balkan states, and by the time the dust cleared on WWI, the borders of the newly minted nation of Turkey began at the furthest edge of continental Europe.
1942 – Expanding and Contracting Germany
At the furthest extent of Axis territory in World War II, Germany and Italy controlled a vast portion of continental Europe. The map below shows occupied land and areas of influence at the height of Germany’s territorial expansion.
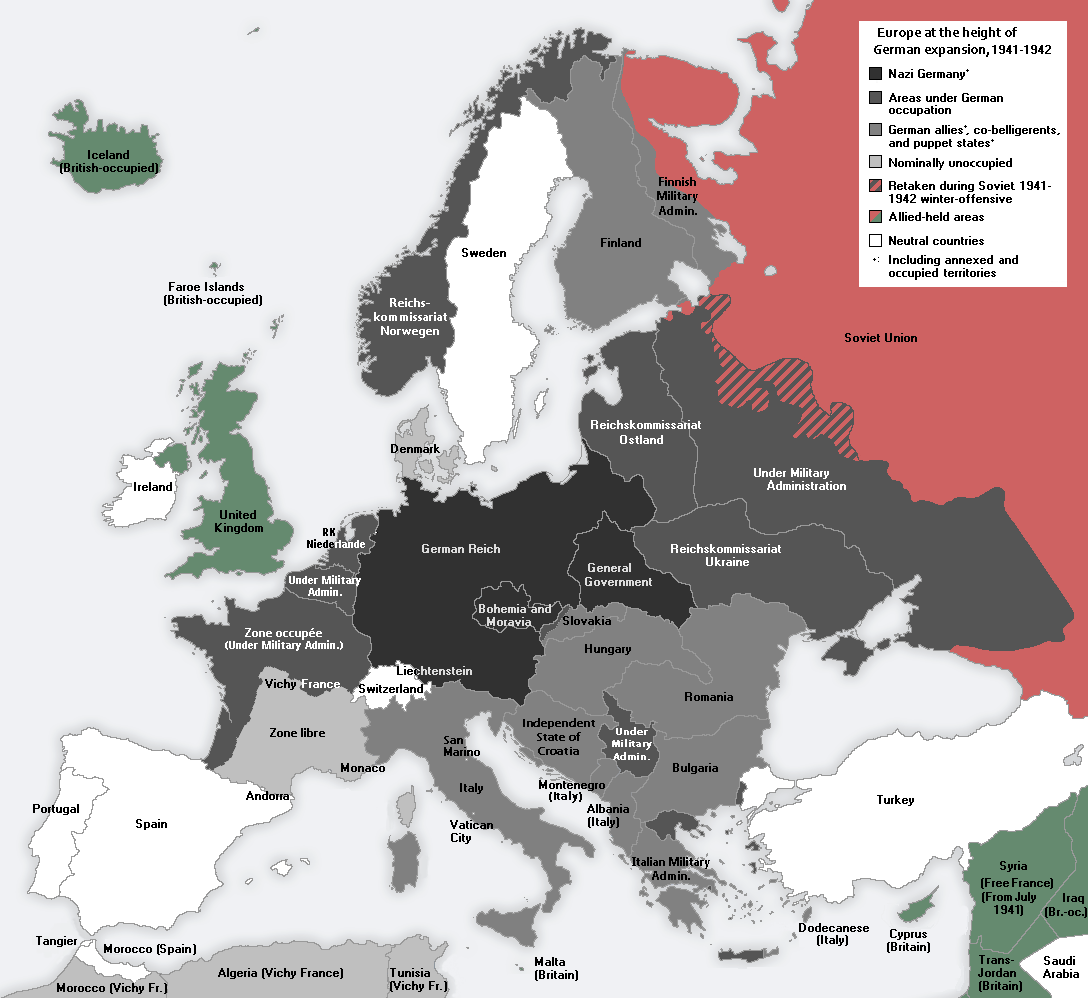
After the war, Germany again became fragmented into occupation zones—this time, overseen by the United States, France, Great Britain, and the Soviet Union. Germany would not be made whole again until 1990, when a weakening Soviet Union loosened its grip on East Germany.
1991 – Soviet Dissolution
In the decades following WWII, the political boundaries of the European map remained relatively stable—that is, until the dissolution of the Soviet Union in 1991. Almost overnight, the country’s entire western border splintered into independent nations. When the dust settled, there were 15 breakaway republics, six of which were in Europe.
Bonus: If you liked the video above, be sure to watch this year-by-year account of who ruled territories across Europe.


Misc
How Hard Is It to Get Into an Ivy League School?
We detail the admission rates and average annual cost for Ivy League schools, as well as the median SAT scores required to be accepted.


How Hard Is It to Get Into an Ivy League School?
This was originally posted on our Voronoi app. Download the app for free on iOS or Android and discover incredible data-driven charts from a variety of trusted sources.
Ivy League institutions are renowned worldwide for their academic excellence and long-standing traditions. But how hard is it to get into one of the top universities in the U.S.?
In this graphic, we detail the admission rates and average annual cost for Ivy League schools, as well as the median SAT scores required to be accepted. The data comes from the National Center for Education Statistics and was compiled by 24/7 Wall St.
Note that “average annual cost” represents the net price a student pays after subtracting the average value of grants and/or scholarships received.
Harvard is the Most Selective
The SAT is a standardized test commonly used for college admissions in the United States. It’s taken by high school juniors and seniors to assess their readiness for college-level academic work.
When comparing SAT scores, Harvard and Dartmouth are among the most challenging universities to gain admission to. The median SAT scores for their students are 760 for reading and writing and 790 for math. Still, Harvard has half the admission rate (3.2%) compared to Dartmouth (6.4%).
| School | Admission rate (%) | SAT Score: Reading & Writing | SAT Score: Math | Avg Annual Cost* |
|---|---|---|---|---|
| Harvard University | 3.2 | 760 | 790 | $13,259 |
| Columbia University | 3.9 | 750 | 780 | $12,836 |
| Yale University | 4.6 | 760 | 780 | $16,341 |
| Brown University | 5.1 | 760 | 780 | $26,308 |
| Princeton University | 5.7 | 760 | 780 | $11,080 |
| Dartmouth College | 6.4 | 760 | 790 | $33,023 |
| University of Pennsylvania | 6.5 | 750 | 790 | $14,851 |
| Cornell University | 7.5 | 750 | 780 | $29,011 |
*Costs after receiving federal financial aid.
Additionally, Dartmouth has the highest average annual cost at $33,000. Princeton has the lowest at $11,100.
While student debt has surged in the United States in recent years, hitting $1.73 trillion in 2023, the worth of obtaining a degree from any of the schools listed surpasses mere academics. This is evidenced by the substantial incomes earned by former students.
Harvard grads, for example, have the highest average starting salary in the country, at $91,700.

-

 Real Estate2 weeks ago
Visualizing America’s Shortage of Affordable Homes
-

 Technology1 week ago
Ranked: Semiconductor Companies by Industry Revenue Share
-

 Money1 week ago
Which States Have the Highest Minimum Wage in America?
-

 Real Estate1 week ago
Ranked: The Most Valuable Housing Markets in America
-

 Business2 weeks ago
Charted: Big Four Market Share by S&P 500 Audits
-

 AI2 weeks ago
The Stock Performance of U.S. Chipmakers So Far in 2024
-

 Misc2 weeks ago
Almost Every EV Stock is Down After Q1 2024
-

 Money2 weeks ago
Where Does One U.S. Tax Dollar Go?