Economy
The $16 Trillion European Union Economy


The $16 Trillion European Union Economy
The European Union has the third-largest economy in the world, accounting for one-sixth of global trade. All together, 27 member countries make up one internal market allowing free movement of goods, services, capital and people.
But how did this sui generis (a class by itself) political entity come into being?
A Brief History of the EU
After the devastating aftermath of the World War II, Western Europe saw a concerted move towards regional peace and security by promoting democracy and protecting human rights.
Crucially, the Schuman Declaration was presented in 1950. The coal and steel industries of Western Europe were integrated under common management, preventing countries from turning on each other and creating weapons of war. Six countries signed on — the eventual founders of the EU.
Here’s a list of all 27 members of the EU and the year they joined.
| Country | Year of entry |
|---|---|
| 🇧🇪 Belgium | 1958 |
| 🇫🇷 France | 1958 |
| 🇩🇪 Germany | 1958 |
| 🇮🇹 Italy | 1958 |
| 🇱🇺 Luxembourg | 1958 |
| 🇳🇱 Netherlands | 1958 |
| 🇩🇰 Denmark | 1973 |
| 🇮🇪 Ireland | 1973 |
| 🇬🇷 Greece | 1981 |
| 🇵🇹 Portugal | 1986 |
| 🇪🇸 Spain | 1986 |
| 🇦🇹 Austria | 1995 |
| 🇫🇮 Finland | 1995 |
| 🇸🇪 Sweden | 1995 |
| 🇨🇾 Cyprus | 2004 |
| 🇨🇿 Czechia | 2004 |
| 🇪🇪 Estonia | 2004 |
| 🇭🇺 Hungary | 2004 |
| 🇱🇻 Latvia | 2004 |
| 🇱🇹 Lithuania | 2004 |
| 🇲🇹 Malta | 2004 |
| 🇵🇱 Poland | 2004 |
| 🇸🇰 Slovakia | 2004 |
| 🇸🇮 Slovenia | 2004 |
| 🇧🇬 Bulgaria | 2007 |
| 🇷🇴 Romania | 2007 |
| 🇭🇷 Croatia | 2013 |
Greater economic and security cooperation followed over the next four decades, along with the addition of new members. These tighter relationships disincentivized conflict, and Western Europe—after centuries of constant war—has seen unprecedented peace for the last 80 years.
The modern version of the EU can trace its origin to 1993, with the adoption of the name, ‘the European Union,’ the birth of a single market, and the promise to use a single currency—the euro.
Since then the EU has become an economic and political force to reckon with. Its combined gross domestic product (GDP) stood at $16.6 trillion in 2022, after the U.S. ($26 trillion) and China ($19 trillion.)
Front Loading the EU Economy
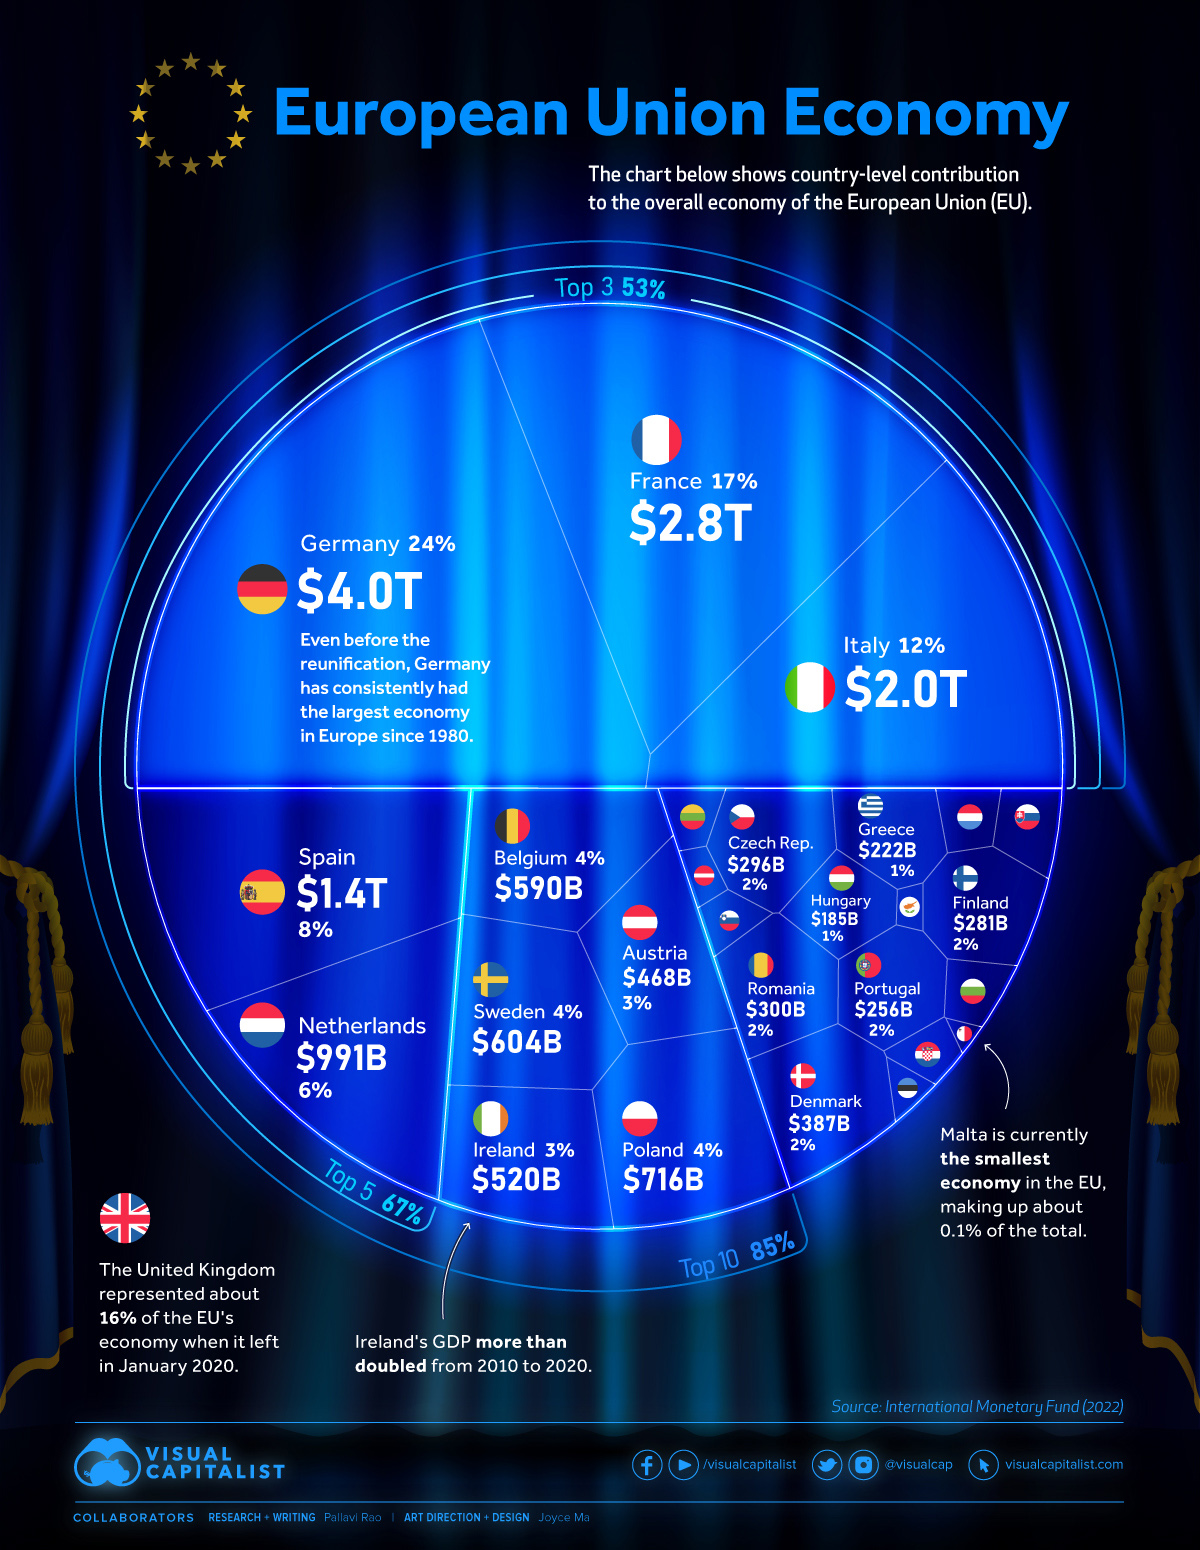
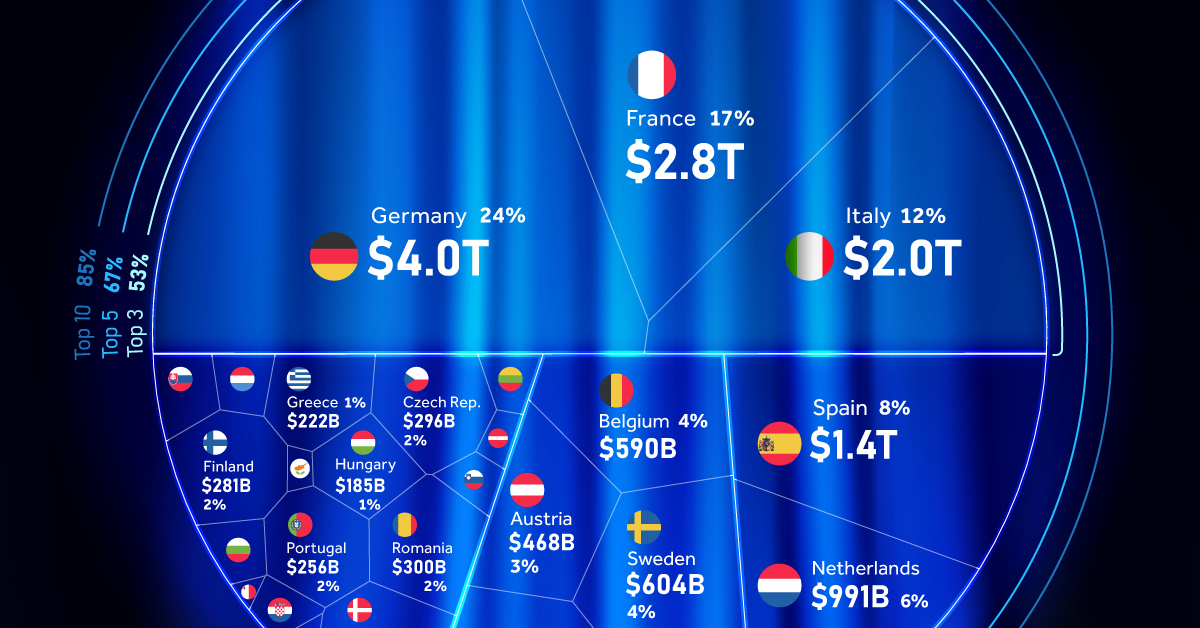
For the impressive numbers it shows however, the European Union’s economic might is held up by three economic giants, per data from the International Monetary Fund. Put together, the GDPs of Germany ($4 trillion), France ($2.7 trillion) and Italy ($1.9 trillion) make up more than half of the EU’s entire economic output.
These three countries are also the most populous in the EU, and together with Spain and Poland, account for 66% of the total population of the EU.
Here’s a table of all 27 member states and the percentage they contribute to the EU’s gross domestic product.
| Rank | Country | GDP (Billion USD) | % of the EU Economy |
|---|---|---|---|
| 1. | 🇩🇪 Germany | 4,031.1 | 24.26% |
| 2. | 🇫🇷 France | 2,778.1 | 16.72% |
| 3. | 🇮🇹 Italy | 1,997.0 | 12.02% |
| 4. | 🇪🇸 Spain | 1,390.0 | 8.37% |
| 5. | 🇳🇱 Netherlands | 990.6 | 5.96% |
| 6. | 🇵🇱 Poland | 716.3 | 4.31% |
| 7. | 🇸🇪 Sweden | 603.9 | 3.64% |
| 8. | 🇧🇪 Belgium | 589.5 | 3.55% |
| 9. | 🇮🇪 Ireland | 519.8 | 3.13% |
| 10. | 🇦🇹 Austria | 468.0 | 2.82% |
| 11. | 🇩🇰 Denmark | 386.7 | 2.33% |
| 12. | 🇷🇴 Romania | 299.9 | 1.81% |
| 13. | 🇨🇿 Czechia | 295.6 | 1.78% |
| 14. | 🇫🇮 Finland | 281.4 | 1.69% |
| 15. | 🇵🇹 Portugal | 255.9 | 1.54% |
| 16. | 🇬🇷 Greece | 222.0 | 1.34% |
| 17. | 🇭🇺 Hungary | 184.7 | 1.11% |
| 18. | 🇸🇰 Slovakia | 112.4 | 0.68% |
| 19. | 🇧🇬 Bulgaria | 85.0 | 0.51% |
| 20. | 🇱🇺 Luxembourg | 82.2 | 0.49% |
| 21. | 🇭🇷 Croatia | 69.4 | 0.42% |
| 22. | 🇱🇹 Lithuania | 68.0 | 0.41% |
| 23. | 🇸🇮 Slovenia | 62.2 | 0.37% |
| 24. | 🇱🇻 Latvia | 40.6 | 0.24% |
| 25. | 🇪🇪 Estonia | 39.1 | 0.24% |
| 26. | 🇨🇾 Cyprus | 26.7 | 0.16% |
| 27. | 🇲🇹 Malta | 17.2 | 0.10% |
| Total | 16,613.1 | 100% |
The top-heaviness continues. By adding Spain ($1.3 trillion) and the Netherlands ($990 billion), the top five make up nearly 70% of the EU’s GDP. That goes up to 85% when the top 10 countries are included.
That means less than half of the 27 member states make up $14 trillion of the $16 trillion EU economy.
Older Members, Larger Share
Aside from the most populous members having bigger economies, another pattern emerges, with the time the country has spent in the EU.
Five of the six founders of the EU—Germany, France, Italy, the Netherlands, Belgium—are in the top 10 biggest economies of the EU. Ireland and Denmark, the next entrants into the union (1973) are ranked 9th and 11th respectively. The bottom 10 countries all joined the EU post-2004.
The UK—which joined the bloc in 1973 and formally left in 2020—would have been the second-largest economy in the region at $3.4 trillion.
Sectoral Analysis of the EU
The EU has four primary sectors of economic output: services, industry, construction, and agriculture (including fishing and forestry.) Below is an analysis of some of these sectors and the countries which contribute the most to it. All figures are from Eurostat.
Services and Tourism
The EU economy relies heavily on the services sector, accounting for more than 70% of the value added to the economy in 2020. It also is the sector with the highest share of employment in the EU, at 73%.
In Luxembourg, which has a large financial services sector, 87% of the country’s gross domestic product came from the services sector.
Tourism economies like Malta and Cyprus also had an above 80% share of services in their GDP.
Industry
Meanwhile 20% of the EU’s gross domestic product came from industry, with Ireland’s economy having the most share (40%) in its GDP. Czechia, Slovenia and Poland also had a significant share of industry output.
Mining coal and lignite in the EU saw a brief rebound in output in 2021, though levels continued to be subdued.
| Rank | Sector | % of the EU Economy |
|---|---|---|
| 1. | Services | 72.4% |
| 2. | Industry | 20.1% |
| 3. | Construction | 5.6% |
| 4. | Agriculture, forestry and fishing | 1.8% |
Agriculture
Less than 2% of the EU’s economy relies on agriculture, forestry and fishing. Romania, Latvia, and Greece feature as contributors to this sector, however the share in total output in each country is less than 5%. Bulgaria has the highest employment (16%) in this sector compared to other EU members.
Energy
The EU imports nearly 60% of its energy requirements. Until the end of 2021, Russia was the biggest exporter of petroleum and natural gas to the region. After the war in Ukraine that share has steadily decreased from nearly 25% to 15% for petroleum liquids and from nearly 40% to 15% for natural gas, per Eurostat.
Headwinds, High Seas
The IMF has a gloomy outlook for Europe heading into 2023. War in Ukraine, spiraling energy costs, high inflation, and stagnant wage growth means that EU leaders are facing “severe trade-offs and tough policy decisions.”
Reforms—to relieve supply constraints in the labor and energy markets—are key to increasing growth and relieving price pressures, according to the international body. The IMF projects that the EU will grow 0.7% in 2023.


Economy
Economic Growth Forecasts for G7 and BRICS Countries in 2024
The IMF has released its economic growth forecasts for 2024. How do the G7 and BRICS countries compare?


G7 & BRICS Real GDP Growth Forecasts for 2024
The International Monetary Fund’s (IMF) has released its real gross domestic product (GDP) growth forecasts for 2024, and while global growth is projected to stay steady at 3.2%, various major nations are seeing declining forecasts.
This chart visualizes the 2024 real GDP growth forecasts using data from the IMF’s 2024 World Economic Outlook for G7 and BRICS member nations along with Saudi Arabia, which is still considering an invitation to join the bloc.
Get the Key Insights of the IMF’s World Economic Outlook
Want a visual breakdown of the insights from the IMF’s 2024 World Economic Outlook report?
This visual is part of a special dispatch of the key takeaways exclusively for VC+ members.
Get the full dispatch of charts by signing up to VC+.
Mixed Economic Growth Prospects for Major Nations in 2024
Economic growth projections by the IMF for major nations are mixed, with the majority of G7 and BRICS countries forecasted to have slower growth in 2024 compared to 2023.
Only three BRICS-invited or member countries, Saudi Arabia, the UAE, and South Africa, have higher projected real GDP growth rates in 2024 than last year.
| Group | Country | Real GDP Growth (2023) | Real GDP Growth (2024P) |
|---|---|---|---|
| G7 | 🇺🇸 U.S. | 2.5% | 2.7% |
| G7 | 🇨🇦 Canada | 1.1% | 1.2% |
| G7 | 🇯🇵 Japan | 1.9% | 0.9% |
| G7 | 🇫🇷 France | 0.9% | 0.7% |
| G7 | 🇮🇹 Italy | 0.9% | 0.7% |
| G7 | 🇬🇧 UK | 0.1% | 0.5% |
| G7 | 🇩🇪 Germany | -0.3% | 0.2% |
| BRICS | 🇮🇳 India | 7.8% | 6.8% |
| BRICS | 🇨🇳 China | 5.2% | 4.6% |
| BRICS | 🇦🇪 UAE | 3.4% | 3.5% |
| BRICS | 🇮🇷 Iran | 4.7% | 3.3% |
| BRICS | 🇷🇺 Russia | 3.6% | 3.2% |
| BRICS | 🇪🇬 Egypt | 3.8% | 3.0% |
| BRICS-invited | 🇸🇦 Saudi Arabia | -0.8% | 2.6% |
| BRICS | 🇧🇷 Brazil | 2.9% | 2.2% |
| BRICS | 🇿🇦 South Africa | 0.6% | 0.9% |
| BRICS | 🇪🇹 Ethiopia | 7.2% | 6.2% |
| 🌍 World | 3.2% | 3.2% |
China and India are forecasted to maintain relatively high growth rates in 2024 at 4.6% and 6.8% respectively, but compared to the previous year, China is growing 0.6 percentage points slower while India is an entire percentage point slower.
On the other hand, four G7 nations are set to grow faster than last year, which includes Germany making its comeback from its negative real GDP growth of -0.3% in 2023.
Faster Growth for BRICS than G7 Nations
Despite mostly lower growth forecasts in 2024 compared to 2023, BRICS nations still have a significantly higher average growth forecast at 3.6% compared to the G7 average of 1%.
While the G7 countries’ combined GDP is around $15 trillion greater than the BRICS nations, with continued higher growth rates and the potential to add more members, BRICS looks likely to overtake the G7 in economic size within two decades.
BRICS Expansion Stutters Before October 2024 Summit
BRICS’ recent expansion has stuttered slightly, as Argentina’s newly-elected president Javier Milei declined its invitation and Saudi Arabia clarified that the country is still considering its invitation and has not joined BRICS yet.
Even with these initial growing pains, South Africa’s Foreign Minister Naledi Pandor told reporters in February that 34 different countries have submitted applications to join the growing BRICS bloc.
Any changes to the group are likely to be announced leading up to or at the 2024 BRICS summit which takes place October 22-24 in Kazan, Russia.
Get the Full Analysis of the IMF’s Outlook on VC+
This visual is part of an exclusive special dispatch for VC+ members which breaks down the key takeaways from the IMF’s 2024 World Economic Outlook.
For the full set of charts and analysis, sign up for VC+.

-

 Markets1 week ago
U.S. Debt Interest Payments Reach $1 Trillion
-

 Business2 weeks ago
Charted: Big Four Market Share by S&P 500 Audits
-

 Real Estate2 weeks ago
Ranked: The Most Valuable Housing Markets in America
-

 Money2 weeks ago
Which States Have the Highest Minimum Wage in America?
-

 AI2 weeks ago
Ranked: Semiconductor Companies by Industry Revenue Share
-

 Markets2 weeks ago
Ranked: The World’s Top Flight Routes, by Revenue
-

 Demographics2 weeks ago
Population Projections: The World’s 6 Largest Countries in 2075
-

 Markets2 weeks ago
The Top 10 States by Real GDP Growth in 2023