Markets
The 15 Corporations That Make the Most Cars
View the high resolution version of today’s graphic by clicking here.
The auto industry is notoriously capital intensive.
As a company like Tesla has discovered over its relatively short history, the manufacturing processes required to make thousands of cars at scale are extremely costly and ridden with unexpected setbacks. To make matters worse the vehicle market is ultra competitive, with very little room for error.
Unless you have a game-changing innovation, powerful brand loyalty, or strong cost leadership, it’s easy to have your lunch eaten by competitors – or to get gobbled up in the industry’s next M&A transaction.
The Auto Landscape
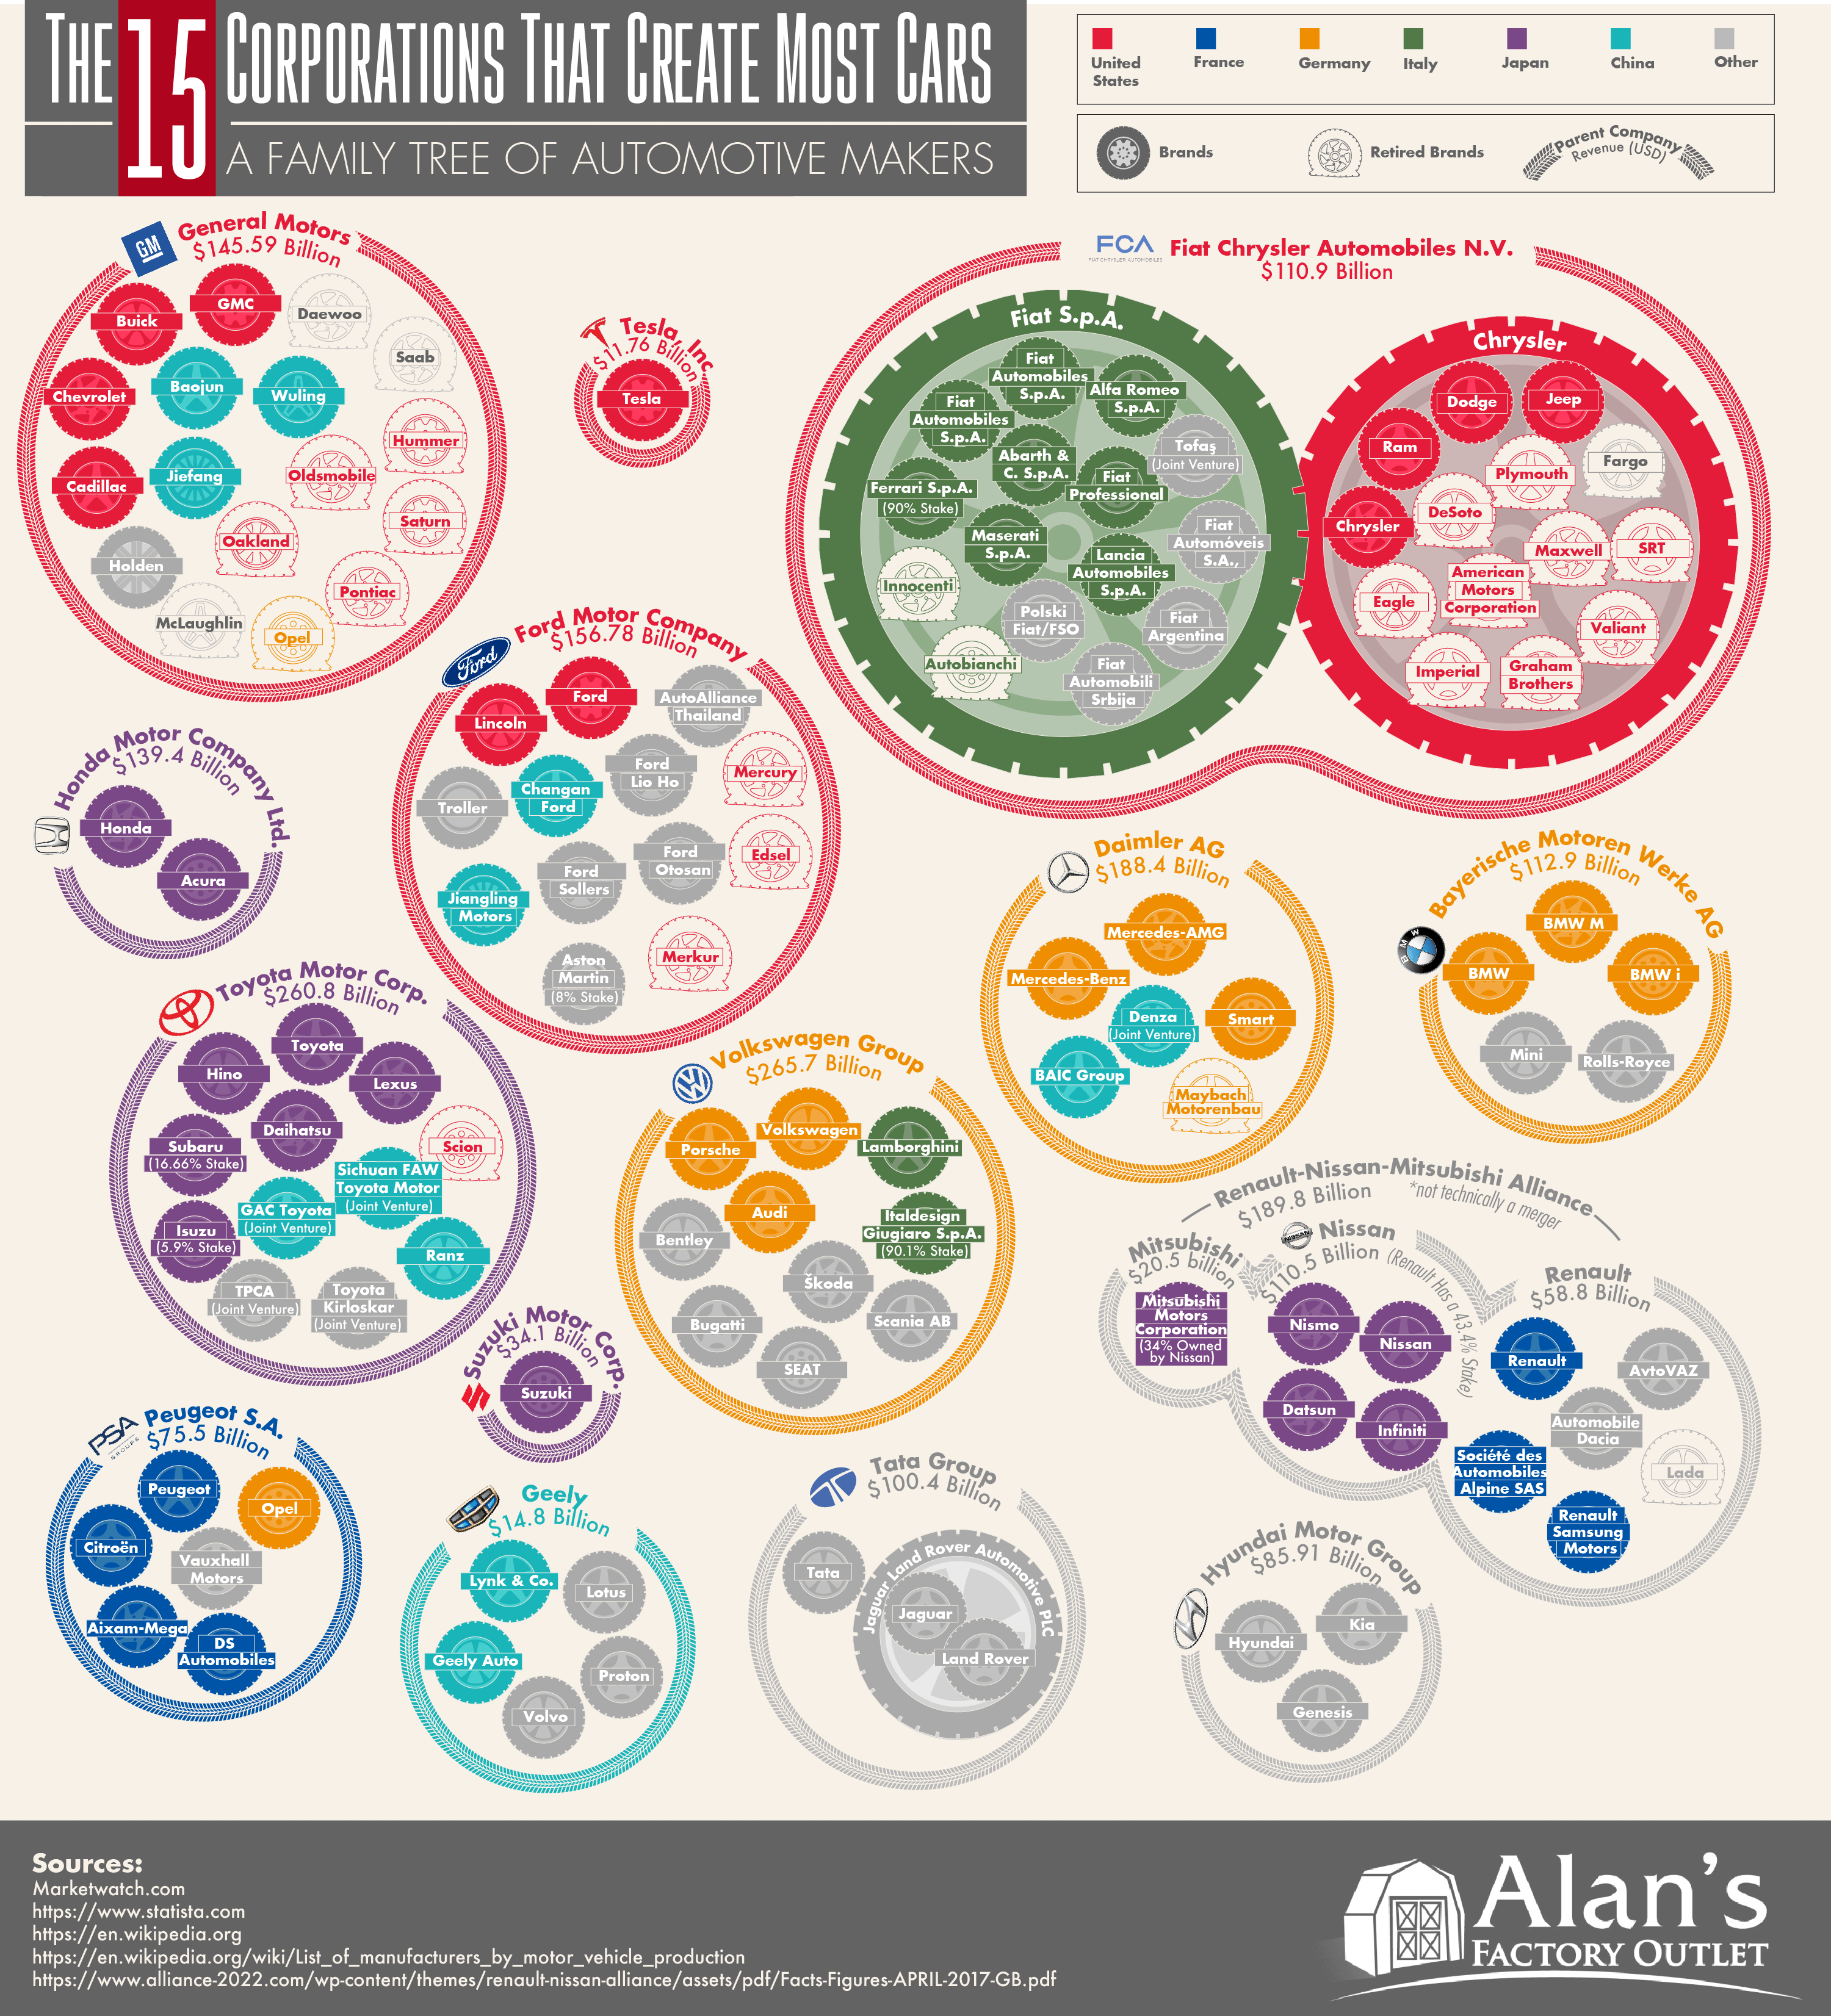
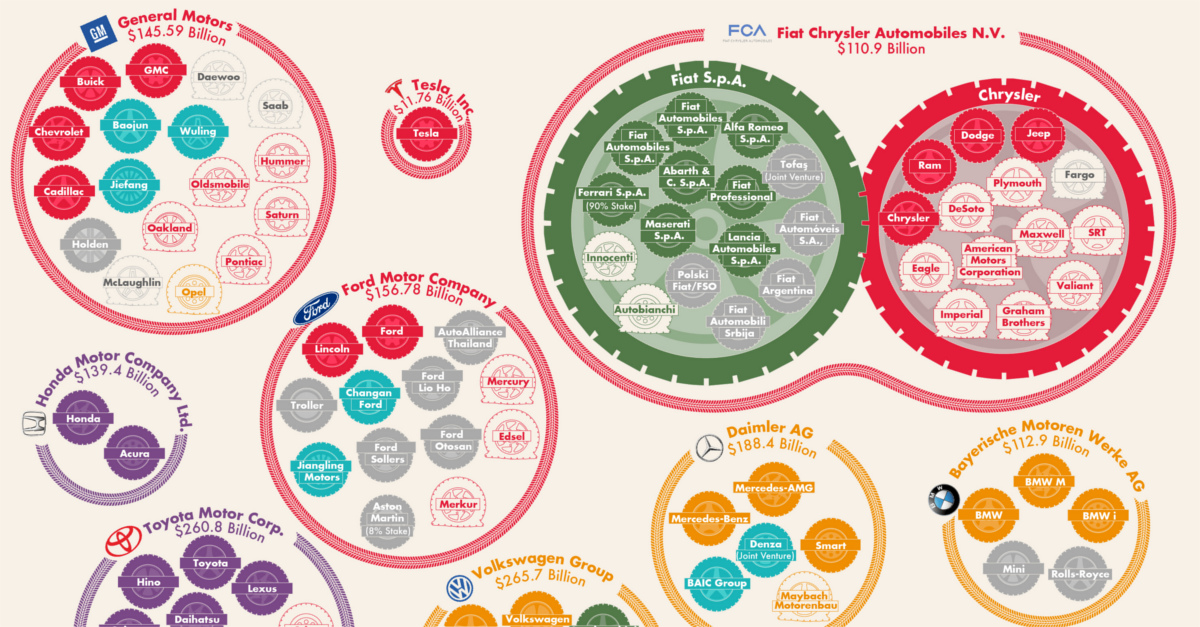
Today’s infographic comes to us from Alan’s Factory Outlet, and it shows the 15 corporations that make the majority of the world’s cars.
Here are those corporations, sorted by annual revenue in U.S. dollars:
| Rank | Corporation | Revenue ($USD) |
|---|---|---|
| #1 | Volkswagen Group | $265.7 billion |
| #2 | Toyota Motor Corp. | $260.8 billion |
| #3 | Renault-Nissan-Mitsubishi* | $189.8 billion |
| #4 | Daimler AG | $188.4 billion |
| #5 | Ford Motor Company | $156.8 billion |
| #6 | General Motors | $145.6 billion |
| #7 | Honda Motor Company Ltd. | $139.4 billion |
| #8 | Bayerische Motoren Werke AG | $112.9 billion |
| #9 | Fiat Chrysler Automobiles N.V. | $110.9 billion |
| #10 | Tata Group | $100.4 billion |
| #11 | Hyundai Motor Group | $85.9 billion |
| #12 | Peugeot S.A. | $75.5 billion |
| #13 | Suzuki Motor Corp. | $34.1 billion |
| #14 | Geely | $14.8 billion |
| #15 | Tesla Inc. | $11.8 billion |
*Renault-Nissan-Mitsubishi is not technically one company, but an alliance
A select few of these companies, such as Tesla or Suzuki, make only one brand of car.
As seen in the graphic, however, the majority of these corporations are actually conglomerates with multiple brands falling under one parent company. These brands are either created strategically by the parent company to target new markets, or they are the result of mergers and acquisitions.
Corporate Family Trees
Here are how these additional brands get added or adopted into each corporate family tree:
1. Filling a Strategic Need
In the 1960s and 1970s, Japanese autos started flooding the North American market – and by 1975, Toyota was the top imported brand in the United States. While Japanese automakers like Toyota, Honda, and Nissan were able to capture market share, at this time they still did not have the reputation they had today.
That’s why, almost simultaneously, these same major Japanese automakers launched separate luxury brands to tap into new market segments. In a short span, Acura (1986), Infiniti (1989) and Lexus (1989) were all founded to gain a foothold in the growing luxury market, with large amounts of success.
2. Changing Hands
Rather than start a brand from scratch, big automakers can also dip into their financial resources to acquire a brand that suits their strategic needs. A good example of this is India’s Tata Motors, a company that was expanding rather aggressively in the 2000s.
Tata Motors purchased the Jaguar Land Rover subsidiary from Ford in 2008, and now owns these well-known British luxury brands.
3. A Good Old-Fashioned Merger
In the last 20 years, Chrysler has been a part of two massive mergers. The first one with Germany’s Daimler Benz happened in 1998, and fell apart because of cultural differences between the companies.
The second merger was a little more one-sided: in 2009, Italian company Fiat moved in to take control of Chrysler after the latter’s bankruptcy. The union is still together today.
4. Staying Alive
After Kia Motors filed for bankruptcy in 1997 during the Asian financial crisis, a fellow South Korean automaker came to the rescue. Hyundai outbid Ford to grab a 51% stake in the company – and while that stake is less now for various reasons, the two brands are still tied at the hip today.


Markets
U.S. Debt Interest Payments Reach $1 Trillion
U.S. debt interest payments have surged past the $1 trillion dollar mark, amid high interest rates and an ever-expanding debt burden.


U.S. Debt Interest Payments Reach $1 Trillion
This was originally posted on our Voronoi app. Download the app for free on iOS or Android and discover incredible data-driven charts from a variety of trusted sources.
The cost of paying for America’s national debt crossed the $1 trillion dollar mark in 2023, driven by high interest rates and a record $34 trillion mountain of debt.
Over the last decade, U.S. debt interest payments have more than doubled amid vast government spending during the pandemic crisis. As debt payments continue to soar, the Congressional Budget Office (CBO) reported that debt servicing costs surpassed defense spending for the first time ever this year.
This graphic shows the sharp rise in U.S. debt payments, based on data from the Federal Reserve.
A $1 Trillion Interest Bill, and Growing
Below, we show how U.S. debt interest payments have risen at a faster pace than at another time in modern history:
| Date | Interest Payments | U.S. National Debt |
|---|---|---|
| 2023 | $1.0T | $34.0T |
| 2022 | $830B | $31.4T |
| 2021 | $612B | $29.6T |
| 2020 | $518B | $27.7T |
| 2019 | $564B | $23.2T |
| 2018 | $571B | $22.0T |
| 2017 | $493B | $20.5T |
| 2016 | $460B | $20.0T |
| 2015 | $435B | $18.9T |
| 2014 | $442B | $18.1T |
| 2013 | $425B | $17.2T |
| 2012 | $417B | $16.4T |
| 2011 | $433B | $15.2T |
| 2010 | $400B | $14.0T |
| 2009 | $354B | $12.3T |
| 2008 | $380B | $10.7T |
| 2007 | $414B | $9.2T |
| 2006 | $387B | $8.7T |
| 2005 | $355B | $8.2T |
| 2004 | $318B | $7.6T |
| 2003 | $294B | $7.0T |
| 2002 | $298B | $6.4T |
| 2001 | $318B | $5.9T |
| 2000 | $353B | $5.7T |
| 1999 | $353B | $5.8T |
| 1998 | $360B | $5.6T |
| 1997 | $368B | $5.5T |
| 1996 | $362B | $5.3T |
| 1995 | $357B | $5.0T |
| 1994 | $334B | $4.8T |
| 1993 | $311B | $4.5T |
| 1992 | $306B | $4.2T |
| 1991 | $308B | $3.8T |
| 1990 | $298B | $3.4T |
| 1989 | $275B | $3.0T |
| 1988 | $254B | $2.7T |
| 1987 | $240B | $2.4T |
| 1986 | $225B | $2.2T |
| 1985 | $219B | $1.9T |
| 1984 | $205B | $1.7T |
| 1983 | $176B | $1.4T |
| 1982 | $157B | $1.2T |
| 1981 | $142B | $1.0T |
| 1980 | $113B | $930.2B |
| 1979 | $96B | $845.1B |
| 1978 | $84B | $789.2B |
| 1977 | $69B | $718.9B |
| 1976 | $61B | $653.5B |
| 1975 | $55B | $576.6B |
| 1974 | $50B | $492.7B |
| 1973 | $45B | $469.1B |
| 1972 | $39B | $448.5B |
| 1971 | $36B | $424.1B |
| 1970 | $35B | $389.2B |
| 1969 | $30B | $368.2B |
| 1968 | $25B | $358.0B |
| 1967 | $23B | $344.7B |
| 1966 | $21B | $329.3B |
Interest payments represent seasonally adjusted annual rate at the end of Q4.
At current rates, the U.S. national debt is growing by a remarkable $1 trillion about every 100 days, equal to roughly $3.6 trillion per year.
As the national debt has ballooned, debt payments even exceeded Medicaid outlays in 2023—one of the government’s largest expenditures. On average, the U.S. spent more than $2 billion per day on interest costs last year. Going further, the U.S. government is projected to spend a historic $12.4 trillion on interest payments over the next decade, averaging about $37,100 per American.
Exacerbating matters is that the U.S. is running a steep deficit, which stood at $1.1 trillion for the first six months of fiscal 2024. This has accelerated due to the 43% increase in debt servicing costs along with a $31 billion dollar increase in defense spending from a year earlier. Additionally, a $30 billion increase in funding for the Federal Deposit Insurance Corporation in light of the regional banking crisis last year was a major contributor to the deficit increase.
Overall, the CBO forecasts that roughly 75% of the federal deficit’s increase will be due to interest costs by 2034.

-

 Maps2 weeks ago
Mapped: Average Wages Across Europe
-

 Money1 week ago
Which States Have the Highest Minimum Wage in America?
-

 Real Estate1 week ago
Ranked: The Most Valuable Housing Markets in America
-

 Markets1 week ago
Charted: Big Four Market Share by S&P 500 Audits
-

 AI1 week ago
The Stock Performance of U.S. Chipmakers So Far in 2024
-

 Automotive2 weeks ago
Almost Every EV Stock is Down After Q1 2024
-

 Money2 weeks ago
Where Does One U.S. Tax Dollar Go?
-

 Green2 weeks ago
Ranked: Top Countries by Total Forest Loss Since 2001