Money
This 1-Minute Animation Puts $110 Billion of Wealth in Perspective
Just over a week ago, Bill Gates reclaimed the familiar title of the world’s richest person after seeing his net worth jump to the $110 billion mark.
The recent gains can be attributed to a surge in Microsoft’s stock price, after the tech company surprised the market by winning a $10 billion cloud contract from the Pentagon. This also pushed Gates past fellow Seattle billionaire Jeff Bezos, who currently holds a $108.7 billion fortune.
With these numbers topping a hundred billion dollars, they can be difficult to comprehend. Luckily for us, Twitter user @betty__cam put together a short animation that simplifies things.
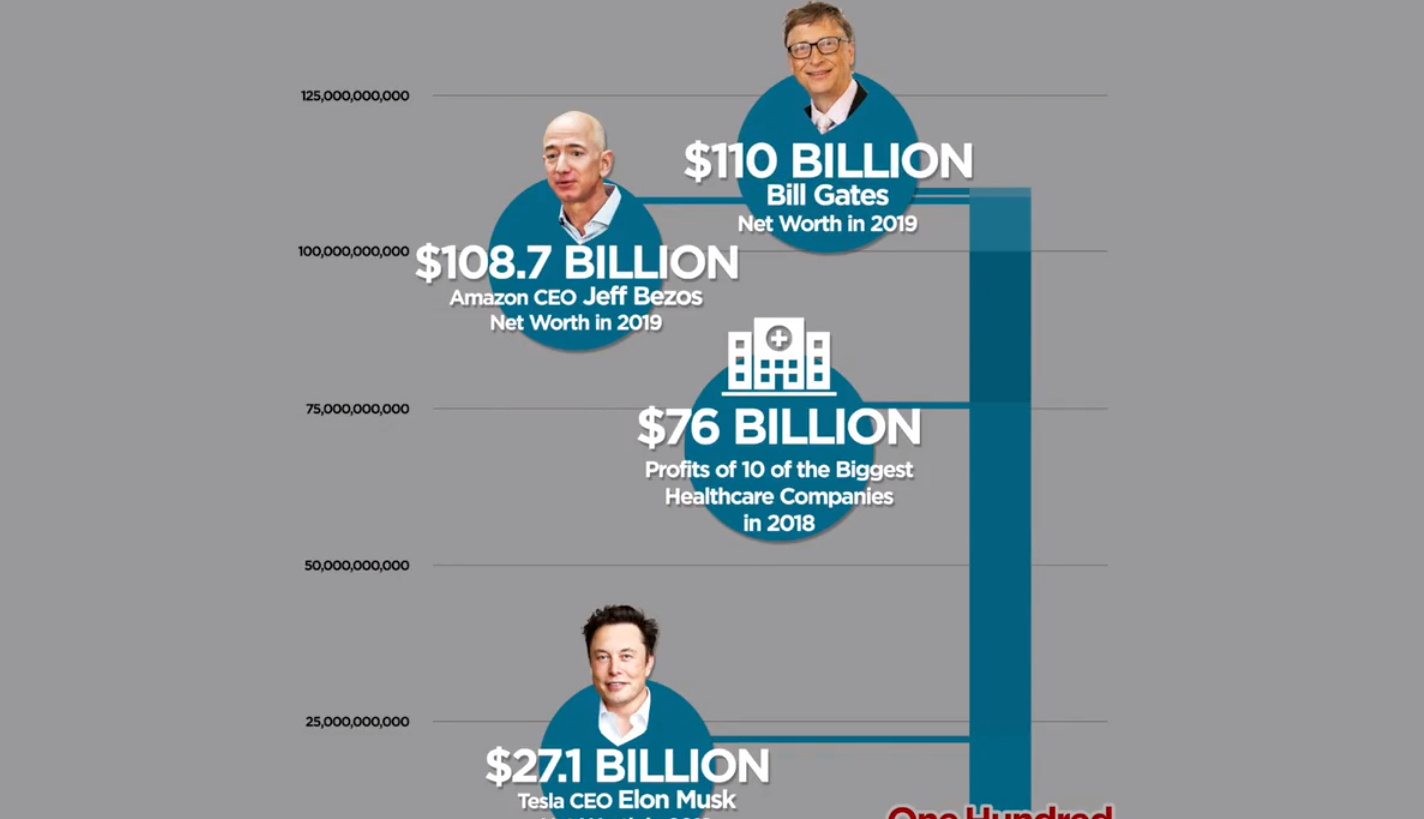
$110 Billion, Visualized
The following one minute animation starts with the median household wealth in the United States of $61,937, working its way up to the Bill Gates fortune of $110 billion:
Along the way, the animation points out comparable dollar amounts to put things in perspective.
This includes the amount that people should save for retirement ($1.33 million), Katy Perry’s mansion in Beverly Hills ($19 million), settlements paid by the NYPD in a year ($230 million), and even the wealth of Elon Musk ($27.1 billion).
Millions vs. Billions
Part of the impact of the animation comes as it flips from millions to billions of dollars.
For example, the retirement figure of $1.33 million is clearly a solid chunk of money — but when that turns into a tiny speck in contrast to $1 billion, it’s evident that we’re talking about very different scales.
This is also illustrated when we look at seconds:
- 1 million seconds = 11.5 days
- 1 billion seconds = 31.71 years
- 110 billion seconds = 3,488.1 years
Go back a million seconds in time, and we’re talking about last week — go back Bill Gates’ wealth in seconds, and you’ll be hanging out with the Ancient Babylonians.
The Equities Effect
The short animation helps put this immense amount of wealth in perspective, but it also has raises a fair question: why is Bill Gates’ net worth growing if he signed The Giving Pledge, a commitment to give away at least half of his net worth to philanthropic causes?
The disconnect lies in the fact that fluctuations in Gates’ net worth are largely connected to the movement of Microsoft’s stock price, as well as the stock market in general.
Even though he’s no longer an active officer of the tech giant, Gates still owns close to 1% of outstanding shares — and with Satya Nadella at the helm, Microsoft’s market capitalization has soared to a record-setting $1.15 trillion. Gates also has over 60% of his assets invested in the stock market, which sits at all-time highs as well.
For the above reasons, Bill Gates gave away $35 billion in wealth in 2019, but still ended up gaining $16 billion in overall net worth.


Money
Charted: Who Has Savings in This Economy?
Older, better-educated adults are winning the savings game, reveals a January survey by the National Opinion Research Center at the University of Chicago.


Who Has Savings in This Economy?
This was originally posted on our Voronoi app. Download the app for free on iOS or Android and discover incredible data-driven charts from a variety of trusted sources.
Two full years of inflation have taken their toll on American households. In 2023, the country’s collective credit card debt crossed $1 trillion for the first time. So who is managing to save money in the current economic environment?
We visualize the percentage of respondents to the statement “I have money leftover at the end of the month” categorized by age and education qualifications. Data is sourced from a National Endowment for Financial Education (NEFE) report, published last month.
The survey for NEFE was conducted from January 12-14, 2024, by the National Opinion Research Center at the University of Chicago. It involved 1,222 adults aged 18+ and aimed to be representative of the U.S. population.
Older Americans Save More Than Their Younger Counterparts
General trends from this dataset indicate that as respondents get older, a higher percentage of them are able to save.
| Age | Always/Often | Sometimes | Rarely/Never |
|---|---|---|---|
| 18–29 | 29% | 33% | 38% |
| 30–44 | 36% | 27% | 37% |
| 45–59 | 39% | 23% | 38% |
| Above 60 | 49% | 28% | 23% |
| All Adults | 39% | 33% | 27% |
Note: Percentages are rounded and may not sum to 100.
Perhaps not surprisingly, those aged 60+ are the age group with the highest percentage saying they have leftover money at the end of the month. This age group spent the most time making peak earnings in their careers, are more likely to have investments, and are more likely to have paid off major expenses like a mortgage or raising a family.
The Impact of Higher Education on Earnings and Savings
Based on this survey, higher education dramatically improves one’s ability to save. Shown in the table below, those with a bachelor’s degree or higher are three times more likely to have leftover money than those without a high school diploma.
| Education | Always/Often | Sometimes | Rarely/Never |
|---|---|---|---|
| No HS Diploma | 18% | 26% | 56% |
| HS Diploma | 28% | 33% | 39% |
| Associate Degree | 33% | 31% | 36% |
| Bachelor/Higher Degree | 59% | 21% | 20% |
| All Adults | 39% | 33% | 27% |
Note: Percentages are rounded and may not sum to 100.
As the Bureau of Labor Statistics notes, earnings improve with every level of education completed.
For example, those with a high school diploma made 25% more than those without in 2022. And as the qualifications increase, the effects keep stacking.
Meanwhile, a Federal Reserve study also found that those with more education tended to make financial decisions that contributed to building wealth, of which the first step is to save.

-

 Green1 week ago
Ranked: The Countries With the Most Air Pollution in 2023
-

 Automotive2 weeks ago
Almost Every EV Stock is Down After Q1 2024
-

 AI2 weeks ago
The Stock Performance of U.S. Chipmakers So Far in 2024
-

 Markets2 weeks ago
Charted: Big Four Market Share by S&P 500 Audits
-

 Real Estate2 weeks ago
Ranked: The Most Valuable Housing Markets in America
-

 Money2 weeks ago
Which States Have the Highest Minimum Wage in America?
-

 AI2 weeks ago
Ranked: Semiconductor Companies by Industry Revenue Share
-

 Travel2 weeks ago
Ranked: The World’s Top Flight Routes, by Revenue