Markets
The $100 Trillion Global Economy in One Chart
Check out the latest 2023 update of the global economy in one chart.


Visualizing the $100 Trillion Global Economy in One Chart
Check out the latest 2023 update of the global economy in one chart.
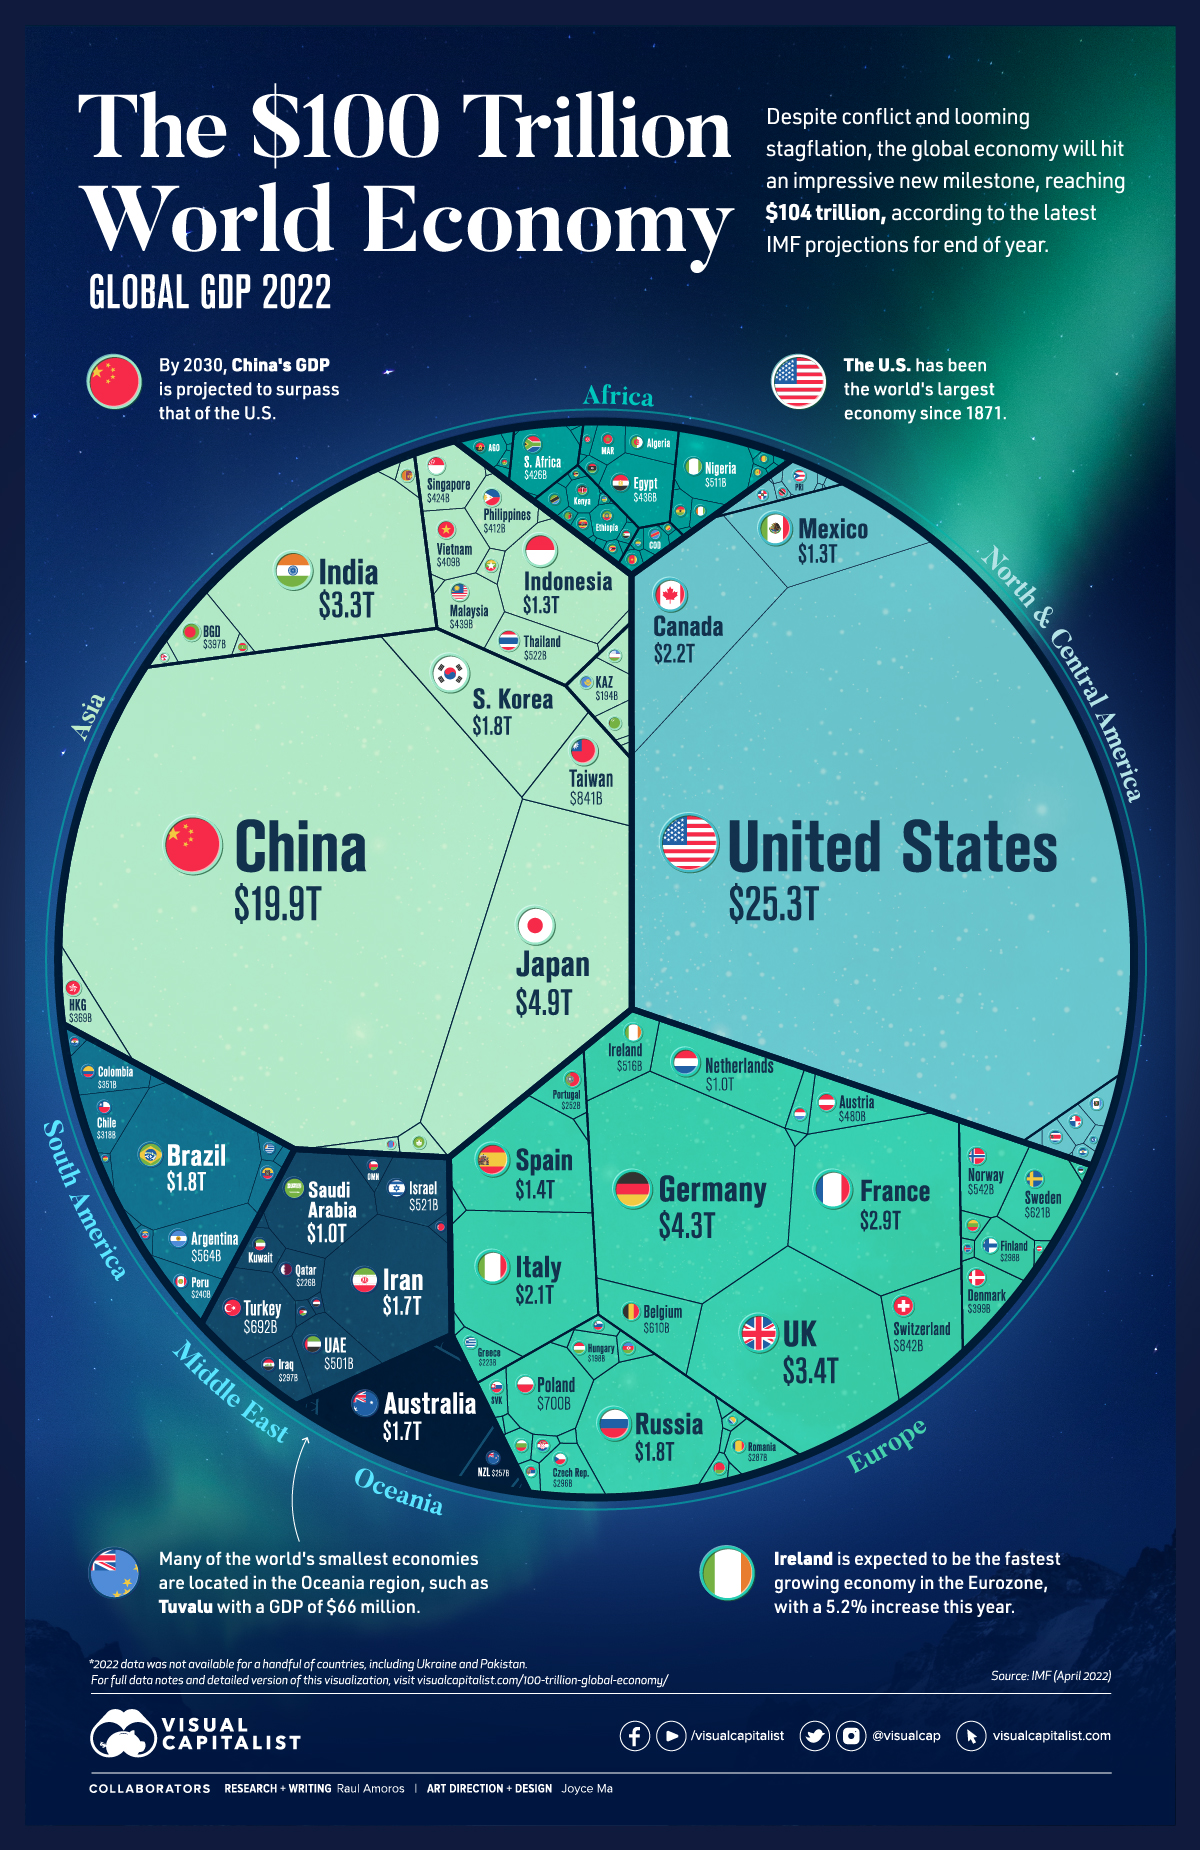
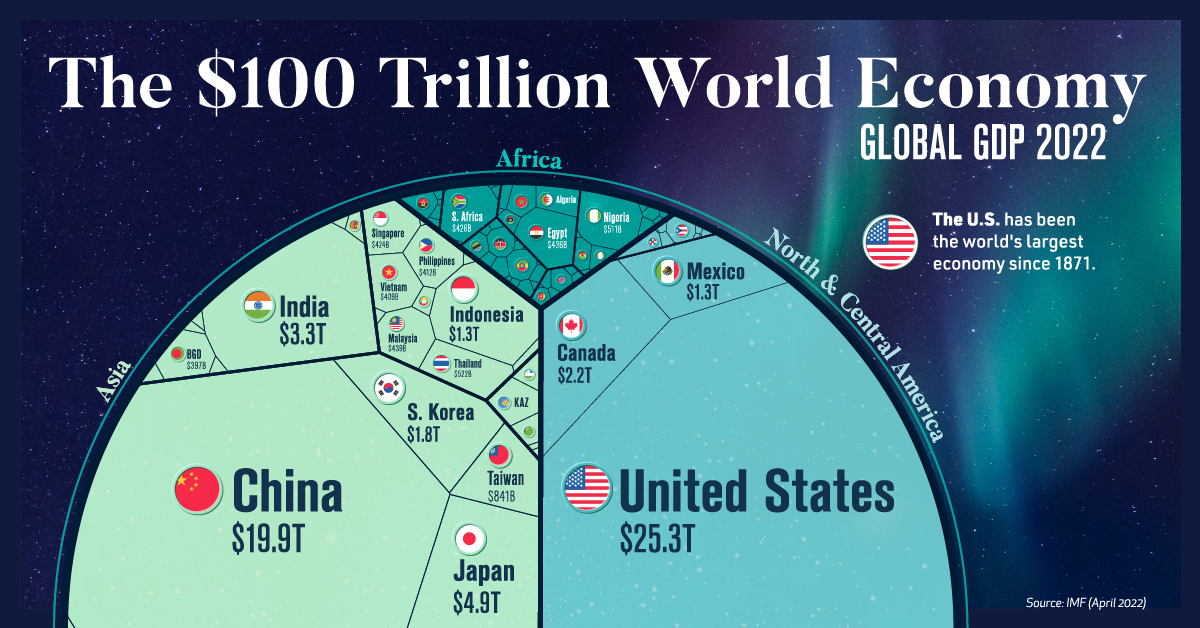
Surpassing the $100 trillion mark is a new milestone for global economic output.
We’ve covered this topic in the past when the world’s GDP was $88 trillion (2020) and then $94 trillion (2021), and now according to the latest projections, the IMF expects the global economy to reach nearly $104 trillion in nominal value by the end of 2022.
Although growth keeps trending upwards, the recovery that was expected in the post-pandemic period is looking strained. Because of recent conflicts, supply chain bottlenecks, and subsequent inflation, global economic projections are getting revised downwards.
Global annual GDP growth for 2022 was initially projected to be 4.4% as of January, but this has since been adjusted to 3.6%.
Note: This data from the IMF represents the most recent nominal projections for end of year as of April 2022.
The 50 Largest Economies in the World
The United States is still the economic leader worldwide, with a GDP of $25.3 trillion—making up nearly one quarter of the global economy. China follows close behind at $19.9 trillion. Here’s a look at the top 50 countries in terms of GDP:
| Rank | Country | GDP (current prices, USD) |
|---|---|---|
| #1 | 🇺🇸 United States | $25.3 trillion |
| #2 | 🇨🇳 China | $19.9 trillion |
| #3 | 🇯🇵 Japan | $4.9 trillion |
| #4 | 🇩🇪 Germany | $4.3 trillion |
| #5 | 🇬🇧 United Kingdom | $3.4 trillion |
| #6 | 🇮🇳 India | $3.3 trillion |
| #7 | 🇫🇷 France | $2.9 trillion |
| #8 | 🇨🇦 Canada | $2.2 trillion |
| #9 | 🇮🇹 Italy | $2.1 trillion |
| #10 | 🇧🇷 Brazil | $1.8 trillion |
| #11 | 🇷🇺 Russia | $1.8 trillion |
| #12 | 🇰🇷 South Korea | $1.8 trillion |
| #13 | 🇦🇺 Australia | $1.7 trillion |
| #14 | 🇮🇷 Iran | $1.7 trillion |
| #15 | 🇪🇸 Spain | $1.4 trillion |
| #16 | 🇲🇽 Mexico | $1.3 trillion |
| #17 | 🇮🇩 Indonesia | $1.3 trillion |
| #18 | 🇸🇦 Saudi Arabia | $1.0 trillion |
| #19 | 🇳🇱 Netherlands | $1.0 trillion |
| #20 | 🇨🇭 Switzerland | $842 billion |
| #21 | 🇹🇼 Taiwan | $841 billion |
| #22 | 🇵🇱 Poland | $700 billion |
| #23 | 🇹🇷 Turkey | $692 billion |
| #24 | 🇸🇪 Sweden | $621 billion |
| #25 | 🇧🇪 Belgium | $610 billion |
| #26 | 🇦🇷 Argentina | $564 billion |
| #27 | 🇳🇴 Norway | $542 billion |
| #28 | 🇹🇭 Thailand | $522 billion |
| #29 | 🇮🇱 Israel | $521 billion |
| #30 | 🇮🇪 Ireland | $516 billion |
| #31 | 🇳🇬 Nigeria | $511 billion |
| #32 | 🇦🇪 United Arab Emirates | $501 billion |
| #33 | 🇦🇹 Austria | $480 billion |
| #34 | 🇲🇾 Malaysia | $439 billion |
| #35 | 🇪🇬 Egypt | $436 billion |
| #36 | 🇿🇦 South Africa | $426 billion |
| #37 | 🇸🇬 Singapore | $424 billion |
| #38 | 🇵🇭 Philippines | $412 billion |
| #39 | 🇻🇳 Vietnam | $409 billion |
| #40 | 🇩🇰 Denmark | $399 billion |
| #41 | 🇧🇩 Bangladesh | $397 billion |
| #42 | 🇭🇰 Hong Kong SAR | $369 billion |
| #43 | 🇨🇴 Colombia | $351 billion |
| #44 | 🇨🇱 Chile | $318 billion |
| #45 | 🇫🇮 Finland | $298 billion |
| #46 | 🇮🇶 Iraq | $297 billion |
| #47 | 🇨🇿 Czechia | $296 billion |
| #48 | 🇷🇴 Romania | $287 billion |
| #49 | 🇳🇿 New Zealand | $257 billion |
| #50 | 🇵🇹 Portugal | $252 billion |
The frontrunner in Europe is Germany at $4.3 trillion, with the UK coming in second place. One significant change since the last reported figures is that Brazil now cracks the top 10, having surpassed South Korea. Russia falls just outside, in 11th place, with a GDP of $1.8 trillion.
While China’s GDP growth has slowed in recent years, projections still indicate that the country will overtake the U.S. by 2030, dethroning the world’s economic leader.
One region also expected to experience growth in the near future is the Middle East and North Africa, thanks to higher oil prices—Iraq and Saudi Arabia in particular are leading this charge. Regional GDP growth in the area is expected to be around 5% in 2022.
The 50 Smallest Economies in the World
Some of the world’s smallest economies were hit particularly hard by the pandemic, and have subsequently been the most affected by the inflation and food supply shortages resulting from the war in Ukraine.
Here’s a look at the countries worldwide with the lowest GDP in 2022:
| Rank | Country | GDP (current prices, USD) |
|---|---|---|
| #191 | 🇹🇻 Tuvalu | $66 million |
| #190 | 🇳🇷 Nauru | $134 million |
| #189 | 🇰🇮 Kiribati | $216 million |
| #188 | 🇵🇼 Palau | $244 million |
| #187 | 🇲🇭 Marshall Islands | $267 million |
| #186 | 🇫🇲 Micronesia | $427 million |
| #185 | 🇸🇹 São Tomé and Príncipe | $1 billion |
| #184 | 🇹🇴 Tonga | $1 billion |
| #183 | 🇩🇲 Dominica | $1 billion |
| #182 | 🇼🇸 Samoa | $1 billion |
| #181 | 🇻🇨 Saint Vincent and the Grenadines | $1 billion |
| #180 | 🇻🇺 Vanuatu | $1 billion |
| #179 | 🇰🇳 Saint Kitts and Nevis | $1 billion |
| #178 | 🇬🇩 Grenada | $1 billion |
| #177 | 🇰🇲 Comoros | $1 billion |
| #176 | 🇦🇬 Antigua and Barbuda | $2 billion |
| #175 | 🇬🇼 Guinea-Bissau | $2 billion |
| #174 | 🇸🇧 Solomon Islands | $2 billion |
| #173 | 🇸🇲 San Marino | $2 billion |
| #172 | 🇸🇨 Seychelles | $2 billion |
| #171 | 🇹🇱 Timor-Leste | $2 billion |
| #170 | 🇧🇿 Belize | $2 billion |
| #169 | 🇨🇻 Cabo Verde | $2 billion |
| #168 | 🇱🇨 Saint Lucia | $2 billion |
| #167 | 🇬🇲 The Gambia | $2 billion |
| #166 | 🇱🇸 Lesotho | $3 billion |
| #165 | 🇪🇷 Eritrea | $3 billion |
| #164 | 🇨🇫 Central African Republic | $3 billion |
| #163 | 🇧🇹 Bhutan | $3 billion |
| #162 | 🇸🇷 Suriname | $3 billion |
| #161 | 🇦🇼 Aruba | $3 billion |
| #160 | 🇦🇩 Andorra | $3 billion |
| #159 | 🇧🇮 Burundi | $3 billion |
| #158 | 🇱🇷 Liberia | $4 billion |
| #157 | 🇩🇯 Djibouti | $4 billion |
| #156 | 🇸🇱 Sierra Leone | $4 billion |
| #155 | 🇸🇿 Eswatini | $5 billion |
| #154 | 🇫🇯 Fiji | $5 billion |
| #153 | 🇲🇻 Maldives | $6 billion |
| #152 | 🇧🇧 Barbados | $6 billion |
| #151 | 🇸🇸 South Sudan | $6 billion |
| #150 | 🇲🇪 Montenegro | $6 billion |
| #149 | 🇹🇯 Tajikistan | $8 billion |
| #148 | 🇸🇴 Somalia | $8 billion |
| #147 | 🇹🇬 Togo | $9 billion |
| #146 | 🇰🇬 Kyrgyzstan | $9 billion |
| #145 | 🇲🇷 Mauritania | $9 billion |
| #144 | 🇽🇰 Kosovo | $10 billion |
| #143 | 🇲🇺 Mauritius | $11 billion |
| #142 | 🇲🇼 Malawi | $12 billion |
The smallest economy in the world measured in the IMF rankings is Tuvalu at $66 million. Most of the bottom 50 are considered low- to middle-income and emerging/developing countries. According to the World Bank, in developing countries, the level of per capita income in 2022 will be about 5% below the pre-pandemic trends.
Some countries are actually projected to experience negative GDP growth this year, particularly emerging and developing economies in Europe.
For example, Russia is expected to experience a GDP growth rate of -8.5% in 2022, though it still remains to be seen how the cost of war and increasingly harsh global sanctions impact the country’s economic prospects.
Inflation, Stagflation, Recession – How Bad is it?
While global economic growth has already been revised downwards, it’s possible the situation could be even more serious. Organizations like the World Bank say that risks of stagflation are rising. Stagflation, which hasn’t occurred since the 1970s, is defined as an economy that’s experiencing rising inflation combined with a stagnant economic output.
Currently, global consumer inflation is currently pegged at 7%. Daily goods are becoming increasingly difficult to purchase and interest rates are on the rise as central banks worldwide try to control the situation. As recent events in Sri Lanka demonstrate, low-income countries are particularly at risk to economic volatility.


Economy
Economic Growth Forecasts for G7 and BRICS Countries in 2024
The IMF has released its economic growth forecasts for 2024. How do the G7 and BRICS countries compare?


G7 & BRICS Real GDP Growth Forecasts for 2024
The International Monetary Fund’s (IMF) has released its real gross domestic product (GDP) growth forecasts for 2024, and while global growth is projected to stay steady at 3.2%, various major nations are seeing declining forecasts.
This chart visualizes the 2024 real GDP growth forecasts using data from the IMF’s 2024 World Economic Outlook for G7 and BRICS member nations along with Saudi Arabia, which is still considering an invitation to join the bloc.
Get the Key Insights of the IMF’s World Economic Outlook
Want a visual breakdown of the insights from the IMF’s 2024 World Economic Outlook report?
This visual is part of a special dispatch of the key takeaways exclusively for VC+ members.
Get the full dispatch of charts by signing up to VC+.
Mixed Economic Growth Prospects for Major Nations in 2024
Economic growth projections by the IMF for major nations are mixed, with the majority of G7 and BRICS countries forecasted to have slower growth in 2024 compared to 2023.
Only three BRICS-invited or member countries, Saudi Arabia, the UAE, and South Africa, have higher projected real GDP growth rates in 2024 than last year.
| Group | Country | Real GDP Growth (2023) | Real GDP Growth (2024P) |
|---|---|---|---|
| G7 | 🇺🇸 U.S. | 2.5% | 2.7% |
| G7 | 🇨🇦 Canada | 1.1% | 1.2% |
| G7 | 🇯🇵 Japan | 1.9% | 0.9% |
| G7 | 🇫🇷 France | 0.9% | 0.7% |
| G7 | 🇮🇹 Italy | 0.9% | 0.7% |
| G7 | 🇬🇧 UK | 0.1% | 0.5% |
| G7 | 🇩🇪 Germany | -0.3% | 0.2% |
| BRICS | 🇮🇳 India | 7.8% | 6.8% |
| BRICS | 🇨🇳 China | 5.2% | 4.6% |
| BRICS | 🇦🇪 UAE | 3.4% | 3.5% |
| BRICS | 🇮🇷 Iran | 4.7% | 3.3% |
| BRICS | 🇷🇺 Russia | 3.6% | 3.2% |
| BRICS | 🇪🇬 Egypt | 3.8% | 3.0% |
| BRICS-invited | 🇸🇦 Saudi Arabia | -0.8% | 2.6% |
| BRICS | 🇧🇷 Brazil | 2.9% | 2.2% |
| BRICS | 🇿🇦 South Africa | 0.6% | 0.9% |
| BRICS | 🇪🇹 Ethiopia | 7.2% | 6.2% |
| 🌍 World | 3.2% | 3.2% |
China and India are forecasted to maintain relatively high growth rates in 2024 at 4.6% and 6.8% respectively, but compared to the previous year, China is growing 0.6 percentage points slower while India is an entire percentage point slower.
On the other hand, four G7 nations are set to grow faster than last year, which includes Germany making its comeback from its negative real GDP growth of -0.3% in 2023.
Faster Growth for BRICS than G7 Nations
Despite mostly lower growth forecasts in 2024 compared to 2023, BRICS nations still have a significantly higher average growth forecast at 3.6% compared to the G7 average of 1%.
While the G7 countries’ combined GDP is around $15 trillion greater than the BRICS nations, with continued higher growth rates and the potential to add more members, BRICS looks likely to overtake the G7 in economic size within two decades.
BRICS Expansion Stutters Before October 2024 Summit
BRICS’ recent expansion has stuttered slightly, as Argentina’s newly-elected president Javier Milei declined its invitation and Saudi Arabia clarified that the country is still considering its invitation and has not joined BRICS yet.
Even with these initial growing pains, South Africa’s Foreign Minister Naledi Pandor told reporters in February that 34 different countries have submitted applications to join the growing BRICS bloc.
Any changes to the group are likely to be announced leading up to or at the 2024 BRICS summit which takes place October 22-24 in Kazan, Russia.
Get the Full Analysis of the IMF’s Outlook on VC+
This visual is part of an exclusive special dispatch for VC+ members which breaks down the key takeaways from the IMF’s 2024 World Economic Outlook.
For the full set of charts and analysis, sign up for VC+.

-

 Markets1 week ago
U.S. Debt Interest Payments Reach $1 Trillion
-

 Markets2 weeks ago
Ranked: The Most Valuable Housing Markets in America
-

 Money2 weeks ago
Which States Have the Highest Minimum Wage in America?
-

 AI2 weeks ago
Ranked: Semiconductor Companies by Industry Revenue Share
-

 Markets2 weeks ago
Ranked: The World’s Top Flight Routes, by Revenue
-

 Countries2 weeks ago
Population Projections: The World’s 6 Largest Countries in 2075
-

 Markets2 weeks ago
The Top 10 States by Real GDP Growth in 2023
-

 Money2 weeks ago
The Smallest Gender Wage Gaps in OECD Countries