Misc
Ranked: The 100 Most Spoken Languages Around the World
Ranked: The 100 Most Spoken Languages Worldwide
Even though you’re reading this article in English, there’s a good chance it might not be your mother tongue. Of the billion-strong English speakers in the world, only 33% consider it their native language.
The popularity of a language depends greatly on utility and geographic location. Additionally, how we measure the spread of world languages can vary greatly depending on whether you look at total speakers or native speakers.
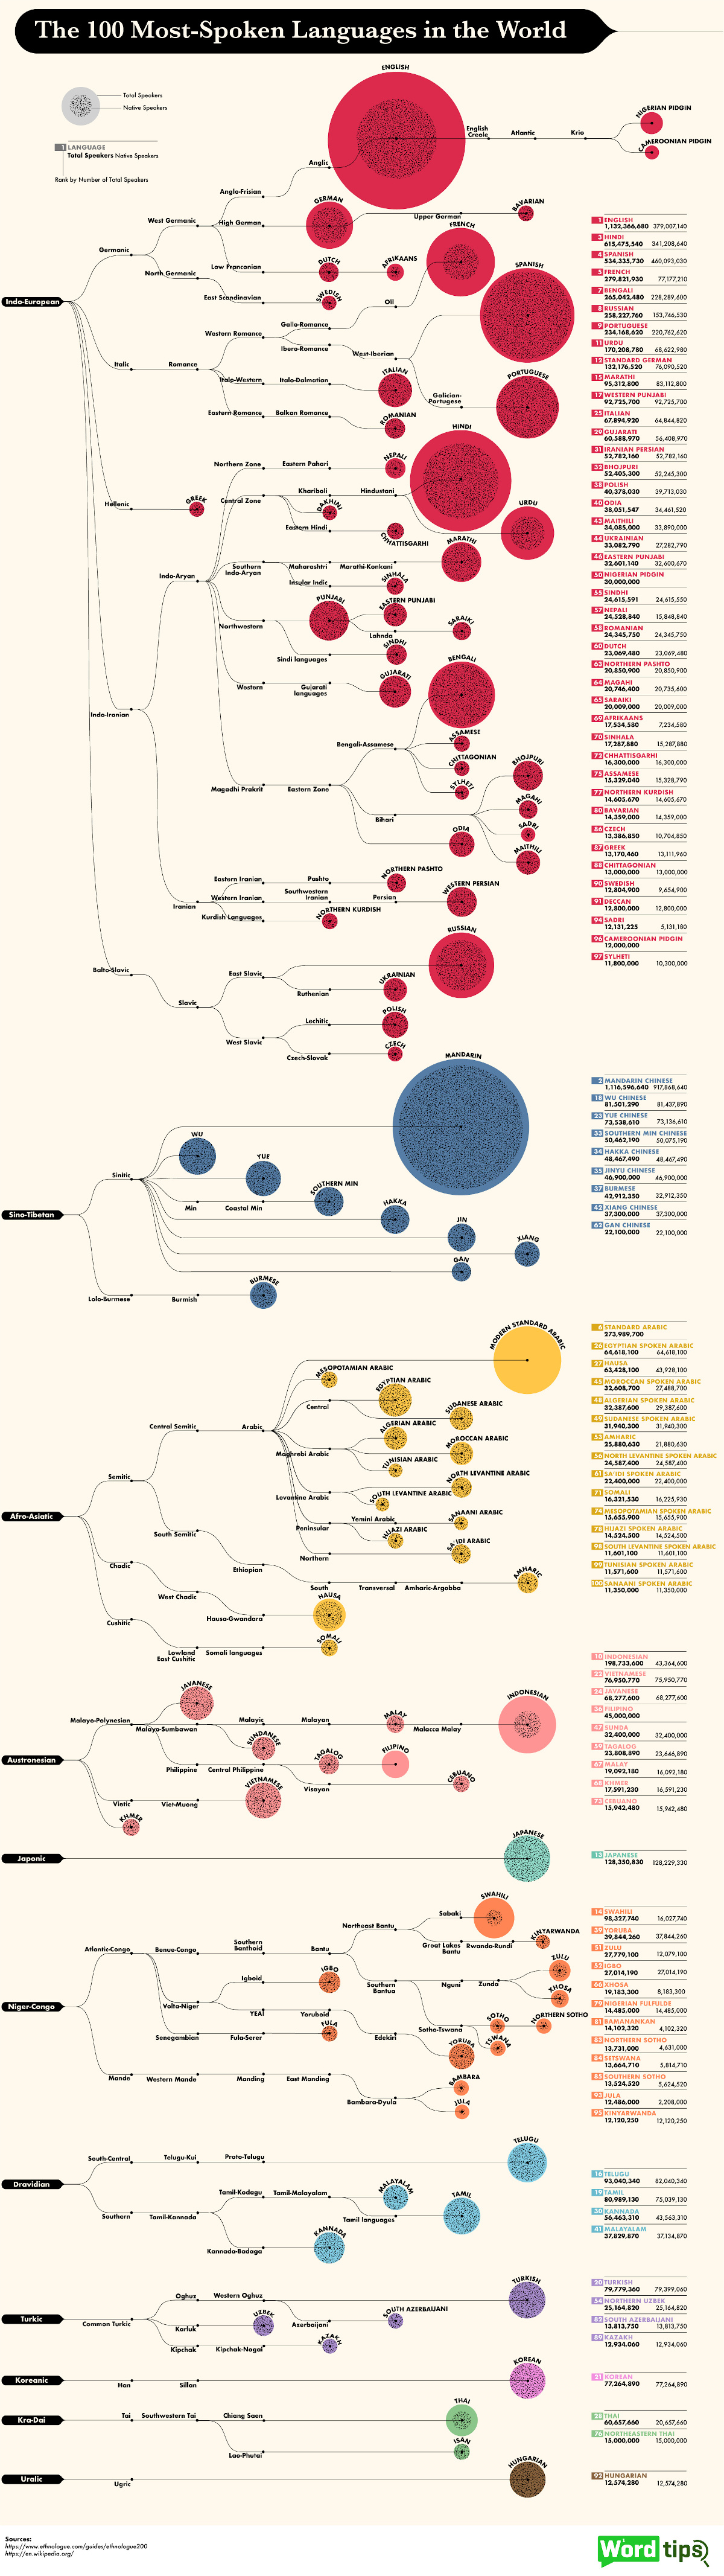
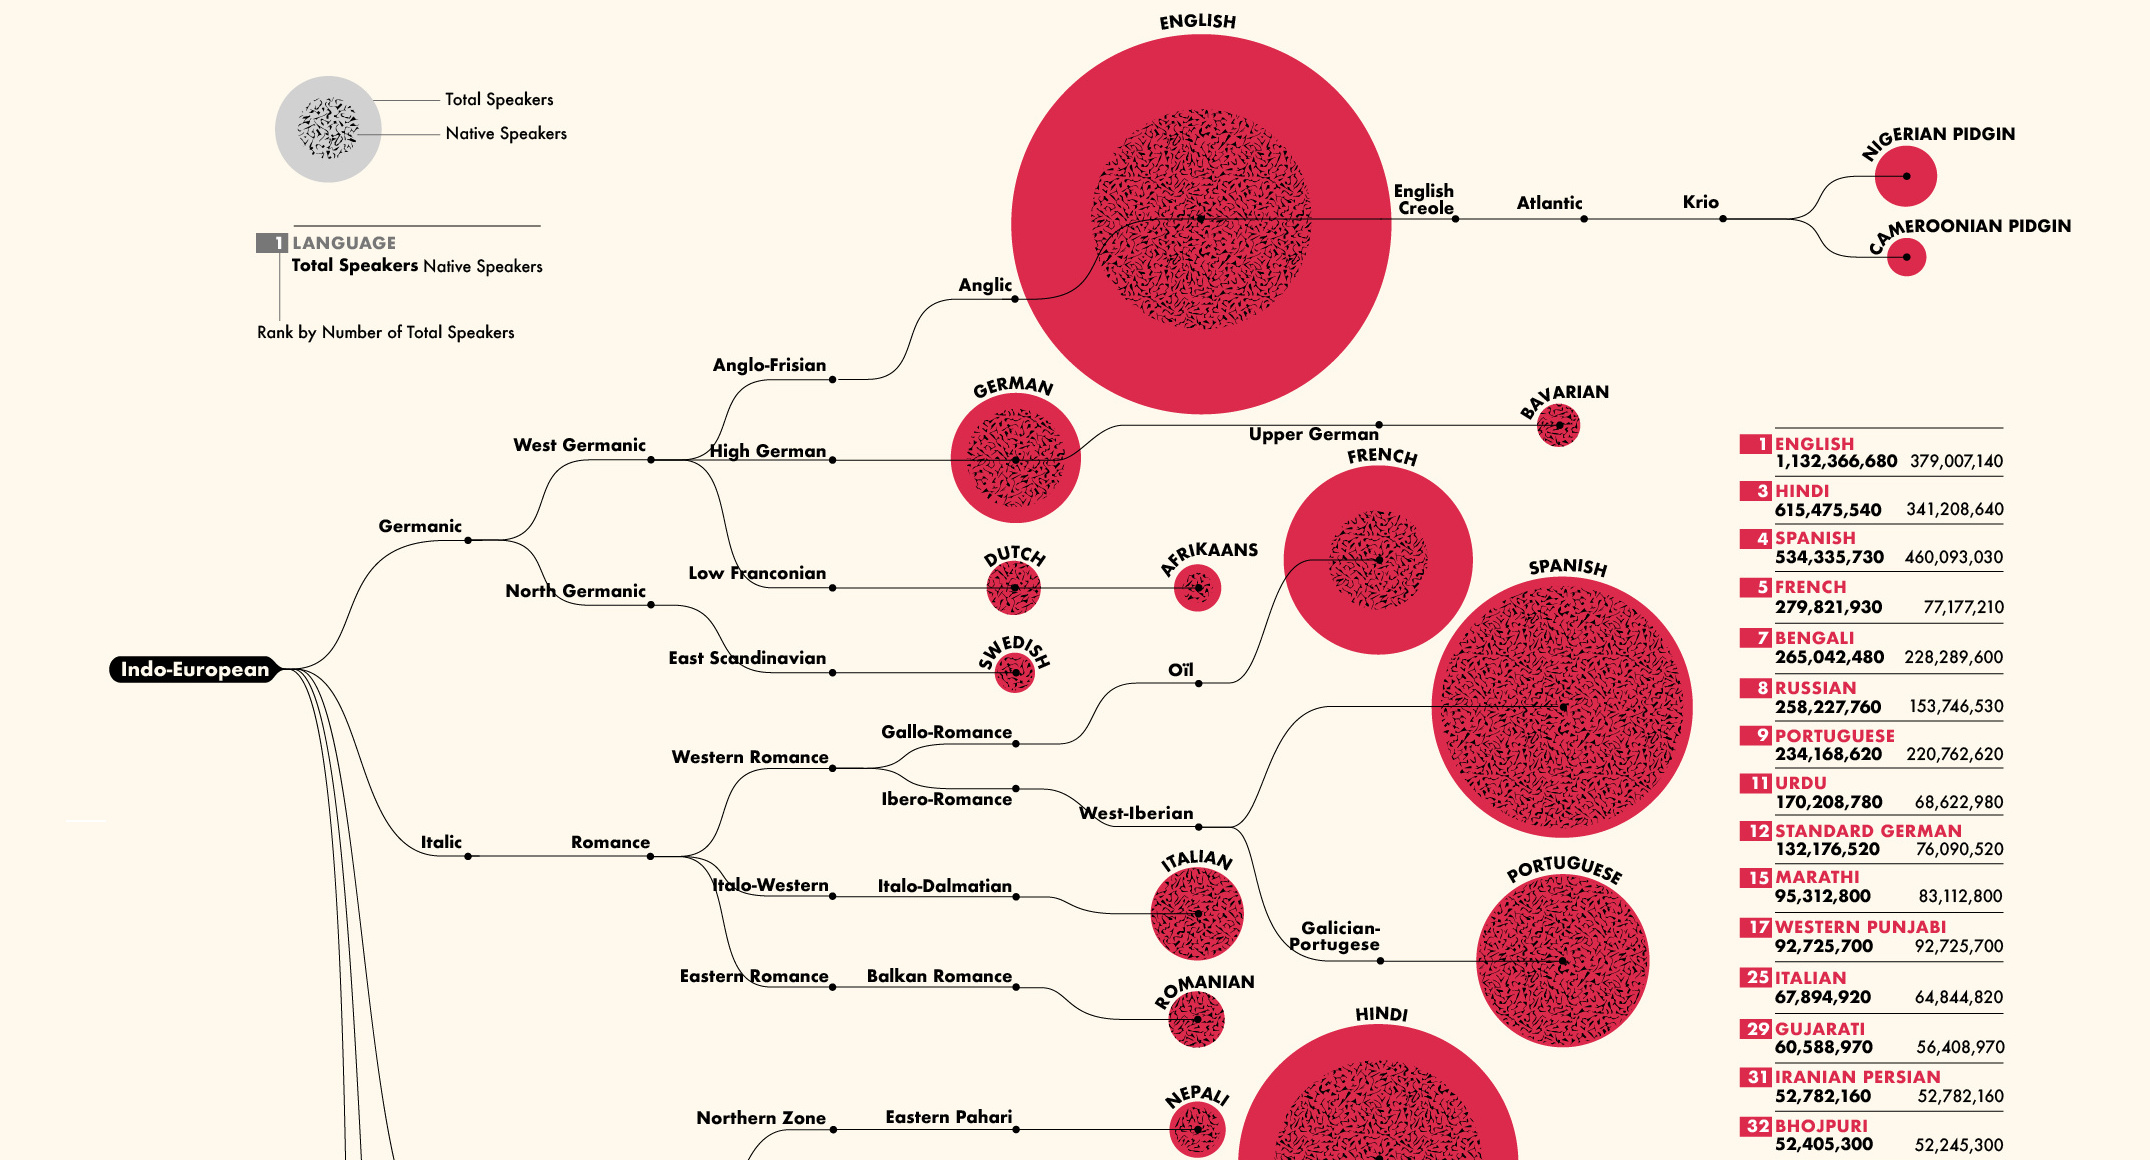
Today’s detailed visualization from WordTips illustrates the 100 most spoken languages in the world, the number of native speakers for each language, and the origin tree that each language has branched out from.
How Do You Define A Language?
The data comes from the 22nd edition of Ethnologue, a database covering a majority of the world’s population, detailing approximately 7,111 living languages in existence today.
The definitions of languages are often dynamic, blurring the lines around a singular understanding of what makes a language:
- Linguistic: focused on lexical and grammatical differences, or on variations within speech communities
- Social: focused on cultural or political factors, as well as heritage and identity
For the purposes of measurement, the researchers use the ISO 693-3 set of criteria, which accounts for related varieties and dialects—ensuring that linguistics are not the only factor considered in this count of languages.
Here are the language origins of the 100 most spoken languages:
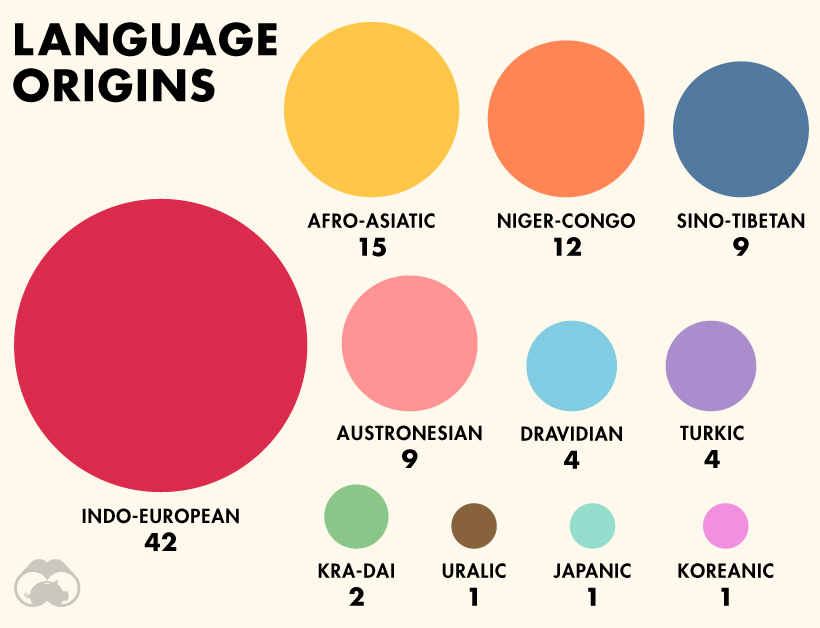
Indo-European languages have the widest spread worldwide. According to Ethnologue, the language family contains over 3 billion speakers in total. Interestingly, there are actually 1,526 Niger-Congo languages altogether, though only 12 are represented here.
Let’s now dive into the top 10 most spoken languages overall.
Which Languages Have the Most Speakers?
It comes as no surprise that English reigns supreme, with over 1.1 billion total speakers—or roughly 15% of the global population. Mandarin Chinese, Hindi, Spanish, and French round out the top five.
| Rank | Language | Total Speakers | Language Origin |
|---|---|---|---|
| 1 | English | 1,132 million | Indo-European |
| 2 | Mandarin Chinese | 1,117 million | Sino-Tibetan |
| 3 | Hindi | 615 million | Indo-European |
| 4 | Spanish | 534 million | Indo-European |
| 5 | French | 280 million | Indo-European |
| 6 | Standard Arabic | 274 million | Afro-Asiatic |
| 7 | Bengali | 265 million | Indo-European |
| 8 | Russian | 258 million | Indo-European |
| 9 | Portuguese | 234 million | Indo-European |
| 10 | Indonesian | 199 million | Austronesian |
However, this is only one piece in the full fabric of languages.
The metrics for native speakers tell a slightly different tale, as Mandarin Chinese shoots up to 918 million—almost 2.5x that of English native speakers.
| Rank | Language | Native Speakers | Language Origin |
|---|---|---|---|
| 1 | Mandarin Chinese | 918 million | Sino-Tibetan |
| 2 | Spanish | 460 million | Indo-European |
| 3 | English | 379 million | Indo-European |
| 4 | Hindi | 341 million | Indo-European |
| 5 | Bengali | 228 million | Indo-European |
| 6 | Portuguese | 221 million | Indo-European |
| 7 | Russian | 154 million | Indo-European |
| 8 | Japanese | 128 million | Japanic |
| 9 | Western Punjabi | 93 million | Indo-European |
| 10 | Marathi | 83 million | Indo-European |
Note: No native speaker data was available for Filipino, Standard Arabic, Nigerian Pidgin, or Cameroonian Pidgin.
Here, Spanish comes in strong second for native speakers with 460 million, considering it’s well-used across Latin America. The Indian languages of Hindi and Bengali cap off the top five by native speakers as well.
These are the biggest languages people learn growing up, but what about the ones they pick up later in life?
What About Second (L2) Languages?
Nearly 43% of the world’s population is bilingual, with the ability to switch between two languages with ease.
From the data, second language (L2) speakers can be calculated by looking at the difference between native and total speakers, as a proportion of the total. For example, 66% of English speakers learned it as a second language.
Swahili surprisingly has the highest ratio of L2 speakers to total speakers—although it only has 16 million native speakers, this shoots up to 98 million total speakers. Overall, 82% of Swahili speakers know it as a second language.
Swahili is listed as a national or official language in several African countries: Tanzania, Kenya, Uganda, and the Democratic Republic of Congo. It’s likely that the movement of people from rural areas into big cities in search of better economic opportunities, is what’s boosting the adoption of Swahili as a second language.
Indonesian is another similar example. With a 78% proportion of L2 speakers compared to total speakers, this variation on the Malay language has been used as the lingua franca across the islands for a long time. In contrast, only 17% of Mandarin speakers know it as a second language, perhaps because it is one of the most challenging languages to learn.
Keeping Language Traditions Alive
Languages are fluid, and constantly evolving—altogether, the 100 most spoken languages paint a unique picture across centuries of a changing world. Here’s the full list of these languages, by types of speakers and language origin.
| Rank | Language | Total Speakers | Native Speakers | Origin |
|---|---|---|---|---|
| 1 | English | 1,132M | 379M | Indo-European |
| 2 | Mandarin Chinese | 1,117M | 918M | Sino-Tibetan |
| 3 | Hindi | 615M | 341M | Indo-European |
| 4 | Spanish | 534M | 460M | Indo-European |
| 5 | French | 280M | 77M | Indo-European |
| 6 | Standard Arabic | 274M | NA | Afro-Asiatic |
| 7 | Bengali | 265M | 228M | Indo-European |
| 8 | Russian | 258M | 154M | Indo-European |
| 9 | Portuguese | 234M | 221M | Indo-European |
| 10 | Indonesian | 199M | 43M | Austronesian |
| 11 | Urdu | 170M | 69M | Indo-European |
| 12 | Standard German | 132M | 76M | Indo-European |
| 13 | Japanese | 128M | 128M | Japanic |
| 14 | Swahili | 98M | 16M | Niger-Congo |
| 15 | Marathi | 95M | 83M | Indo-European |
| 16 | Telugu | 93M | 82M | Dravidian |
| 17 | Western Punjabi | 93M | 93M | Indo-European |
| 18 | Wu Chinese | 82M | 81M | Sino-Tibetan |
| 19 | Tamil | 81M | 75M | Dravidian |
| 20 | Turkish | 80M | 69M | Turkic |
| 21 | Korean | 77M | 77M | Koreanic |
| 22 | Vietnamese | 77M | 76M | Austronesian |
| 23 | Yue Chinese | 74M | 73M | Sino-Tibetan |
| 24 | Javanese | 68M | 68M | Austronesian |
| 25 | Italian | 68M | 65M | Indo-European |
| 26 | Egyptian Spoken Arabic | 65M | 65M | Afro-Asiatic |
| 27 | Hausa | 63M | 44M | Afro-Asiatic |
| 28 | Thai | 61M | 21M | Kra-Dai |
| 29 | Gujarati | 61M | 56M | Indo-European |
| 30 | Kannada | 56M | 44M | Dravidian |
| 31 | Iranian Persian | 53M | 53M | Indo-European |
| 32 | Bhojpuri | 52M | 52M | Indo-European |
| 33 | Southern Min Chinese | 50M | 50M | Sino-Tibetan |
| 34 | Hakka Chinese | 48M | 48M | Sino-Tibetan |
| 35 | Jinyu Chinese | 47M | 47M | Sino-Tibetan |
| 36 | Filipino | 45M | NA | Austronesian |
| 37 | Burmese | 43M | 33M | Sino-Tibetan |
| 38 | Polish | 40M | 40M | Indo-European |
| 39 | Yoruba | 40M | 38M | Niger-Congo |
| 40 | Odia | 38M | 34M | Indo-European |
| 41 | Malayalam | 38M | 37M | Dravidian |
| 42 | Xiang Chinese | 37M | 37M | Sino-Tibetan |
| 43 | Maithili | 34M | 34M | Indo-European |
| 44 | Ukrainian | 33M | 27M | Indo-European |
| 45 | Moroccan Spoken Arabic | 33M | 27M | Afro-Asiatic |
| 46 | Eastern Punjabi | 33M | 33M | Indo-European |
| 47 | Sunda | 32M | 32M | Austronesian |
| 48 | Algerian Spoken Arabic | 32M | 29M | Afro-Asiatic |
| 49 | Sudanese Spoken Arabic | 32M | 32M | Afro-Asiatic |
| 50 | Nigerian Pidgin | 30M | NA | Indo-European |
| 51 | Zulu | 28M | 12M | Niger-Congo |
| 52 | Igbo | 27M | 27M | Niger-Congo |
| 53 | Amharic | 26M | 22M | Afro-Asiatic |
| 54 | Northern Uzbek | 25M | 25M | Turkic |
| 55 | Sindhi | 25M | 25M | Indo-European |
| 56 | North Levantine Spoken Arabic | 25M | 25M | Afro-Asiatic |
| 57 | Nepali | 25M | 16M | Indo-European |
| 58 | Romanian | 24M | 24M | Indo-European |
| 59 | Tagalog | 24M | 24M | Austronesian |
| 60 | Dutch | 23M | 23M | Indo-European |
| 61 | Sa'idi Spoken Arabic | 22M | 22M | Afro-Asiatic |
| 62 | Gan Chinese | 22M | 22M | Sino-Tibetan |
| 63 | Northern Pashto | 21M | 21M | Indo-European |
| 64 | Magahi | 21M | 21M | Indo-European |
| 65 | Saraiki | 20M | 20M | Indo-European |
| 66 | Xhosa | 19M | 8M | Niger-Congo |
| 67 | Malay | 19M | 16M | Austronesian |
| 68 | Khmer | 18M | 17M | Austronesian |
| 69 | Afrikaans | 18M | 7M | Indo-European |
| 70 | Sinhala | 17M | 15M | Indo-European |
| 71 | Somali | 16M | 16M | Afro-Asiatic |
| 72 | Chhattisgarhi | 16M | 16M | Indo-European |
| 73 | Cebuano | 16M | 16M | Austronesian |
| 74 | Mesopotamian Spoken Arabic | 16M | 16M | Afro-Asiatic |
| 75 | Assamese | 15M | 15M | Indo-European |
| 76 | Northeastern Thai | 15M | 15M | Kra-Dai |
| 77 | Northern Kurdish | 15M | 15M | Indo-European |
| 78 | Hijazi Spoken Arabic | 15M | 15M | Afro-Asiatic |
| 79 | Nigerian Fulfulde | 14M | 14M | Niger-Congo |
| 80 | Bavarian | 14M | 14M | Indo-European |
| 81 | Bamanankan | 14M | 4M | Niger-Congo |
| 82 | South Azerbaijani | 14M | 14M | Turkic |
| 83 | Northern Sotho | 14M | 5M | Niger-Congo |
| 84 | Setswana | 14M | 6M | Niger-Congo |
| 85 | Souther Sotho | 14M | 6M | Niger-Congo |
| 86 | Czech | 13M | 11M | Indo-European |
| 87 | Greek | 13M | 13M | Indo-European |
| 88 | Chittagonian | 13M | 13M | Indo-European |
| 89 | Kazakh | 13M | 13M | Turkic |
| 90 | Swedish | 13M | 10M | Indo-European |
| 91 | Deccan | 13M | 13M | Indo-European |
| 92 | Hungarian | 13M | 13M | Uralic |
| 93 | Jula | 12M | 2M | Niger-Congo |
| 94 | Sadri | 12M | 5M | Indo-European |
| 95 | Kinyarwanda | 12M | 12M | Niger-Congo |
| 96 | Cameroonian Pidgin | 12M | NA | Indo-European |
| 97 | Sylheti | 12M | 10M | Indo-European |
| 98 | South Levantine Spoken Arabic | 12M | 12M | Afro-Asiatic |
| 99 | Tunisian Spoken Arabic | 12M | 12M | Afro-Asiatic |
| 100 | Sanaani Spoken Arabic | 11M | 11M | Afro-Asiatic |
One reason these languages are popular is that they are actively and consistently used. Unfortunately, nearly 3,000 (about 40%) of all languages are at risk of being lost, or are already in the process of dying out today.
Languages play a crucial role in our daily lives. … [Their] losses have huge negative impacts indigenous peoples’ most basic human rights.
—UN, IYoIL statement
As a result, the United Nations declared 2019 the International Year of Indigenous Languages (IYoIL), with a resolution to continue fostering these languages and pass on their knowledge for future generations.


Misc
How Hard Is It to Get Into an Ivy League School?
We detail the admission rates and average annual cost for Ivy League schools, as well as the median SAT scores required to be accepted.


How Hard Is It to Get Into an Ivy League School?
This was originally posted on our Voronoi app. Download the app for free on iOS or Android and discover incredible data-driven charts from a variety of trusted sources.
Ivy League institutions are renowned worldwide for their academic excellence and long-standing traditions. But how hard is it to get into one of the top universities in the U.S.?
In this graphic, we detail the admission rates and average annual cost for Ivy League schools, as well as the median SAT scores required to be accepted. The data comes from the National Center for Education Statistics and was compiled by 24/7 Wall St.
Note that “average annual cost” represents the net price a student pays after subtracting the average value of grants and/or scholarships received.
Harvard is the Most Selective
The SAT is a standardized test commonly used for college admissions in the United States. It’s taken by high school juniors and seniors to assess their readiness for college-level academic work.
When comparing SAT scores, Harvard and Dartmouth are among the most challenging universities to gain admission to. The median SAT scores for their students are 760 for reading and writing and 790 for math. Still, Harvard has half the admission rate (3.2%) compared to Dartmouth (6.4%).
| School | Admission rate (%) | SAT Score: Reading & Writing | SAT Score: Math | Avg Annual Cost* |
|---|---|---|---|---|
| Harvard University | 3.2 | 760 | 790 | $13,259 |
| Columbia University | 3.9 | 750 | 780 | $12,836 |
| Yale University | 4.6 | 760 | 780 | $16,341 |
| Brown University | 5.1 | 760 | 780 | $26,308 |
| Princeton University | 5.7 | 760 | 780 | $11,080 |
| Dartmouth College | 6.4 | 760 | 790 | $33,023 |
| University of Pennsylvania | 6.5 | 750 | 790 | $14,851 |
| Cornell University | 7.5 | 750 | 780 | $29,011 |
*Costs after receiving federal financial aid.
Additionally, Dartmouth has the highest average annual cost at $33,000. Princeton has the lowest at $11,100.
While student debt has surged in the United States in recent years, hitting $1.73 trillion in 2023, the worth of obtaining a degree from any of the schools listed surpasses mere academics. This is evidenced by the substantial incomes earned by former students.
Harvard grads, for example, have the highest average starting salary in the country, at $91,700.

-

 Maps2 weeks ago
Mapped: Average Wages Across Europe
-

 Money1 week ago
Which States Have the Highest Minimum Wage in America?
-

 Real Estate1 week ago
Ranked: The Most Valuable Housing Markets in America
-

 Markets1 week ago
Charted: Big Four Market Share by S&P 500 Audits
-

 AI1 week ago
The Stock Performance of U.S. Chipmakers So Far in 2024
-

 Automotive2 weeks ago
Almost Every EV Stock is Down After Q1 2024
-

 Money2 weeks ago
Where Does One U.S. Tax Dollar Go?
-

 Green2 weeks ago
Ranked: Top Countries by Total Forest Loss Since 2001