Datastream
Ranked: These Are 10 of the World’s Least Affordable Housing Markets


The Briefing
- For the 12th year in a row, Hong Kong is the world’s least affordable housing market, according to Demographia’s ranking of 92 cities in select countries
- Sydney, Australia moves up one spot from last year’s ranking to take second place
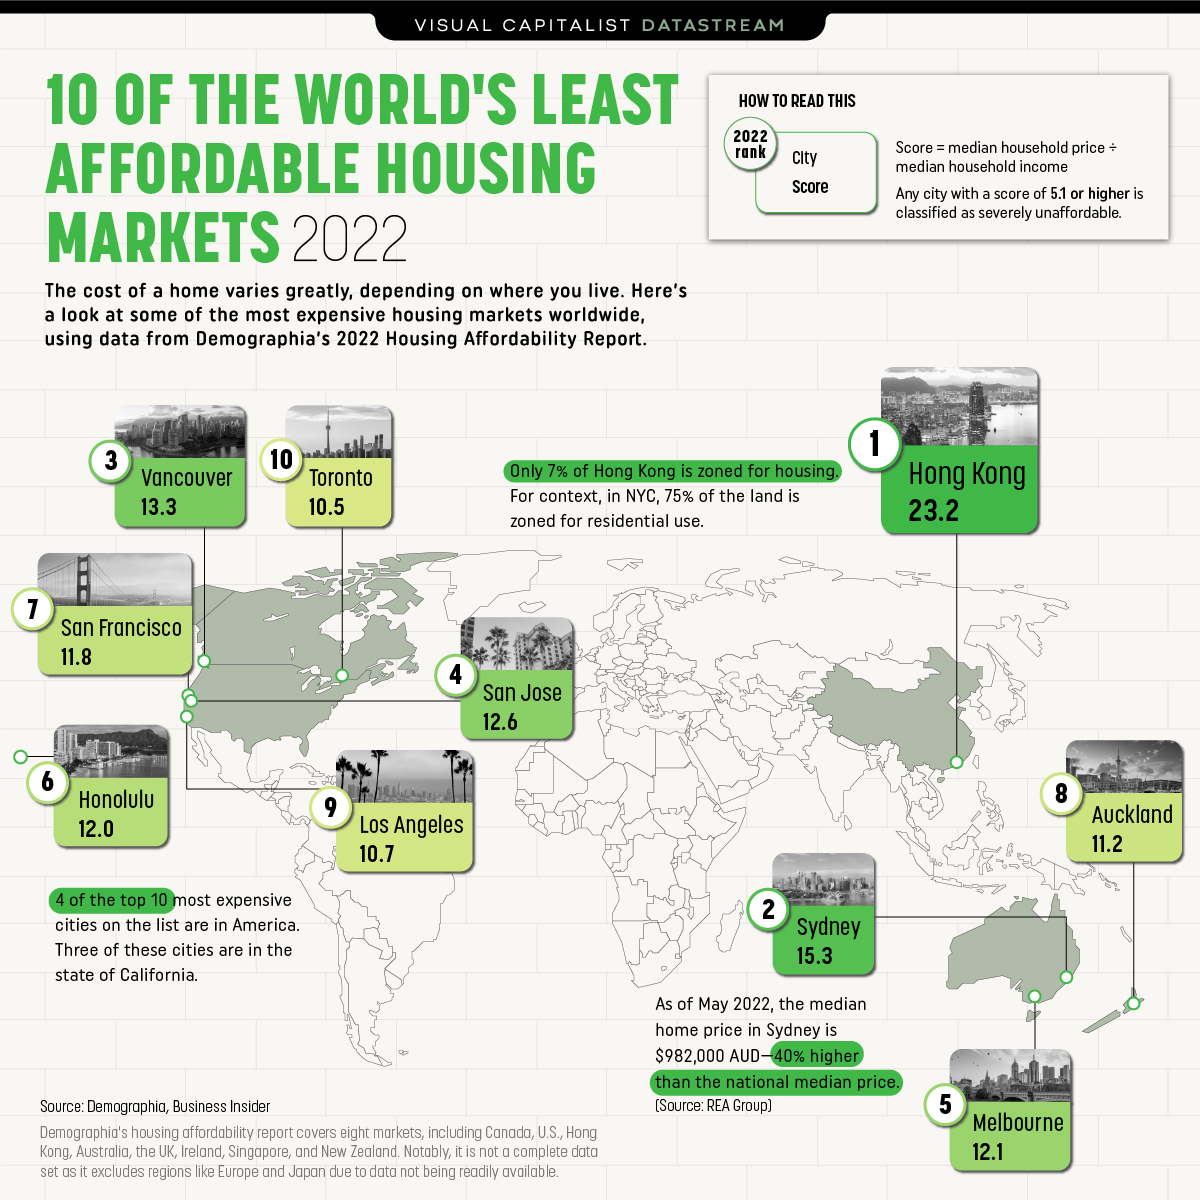
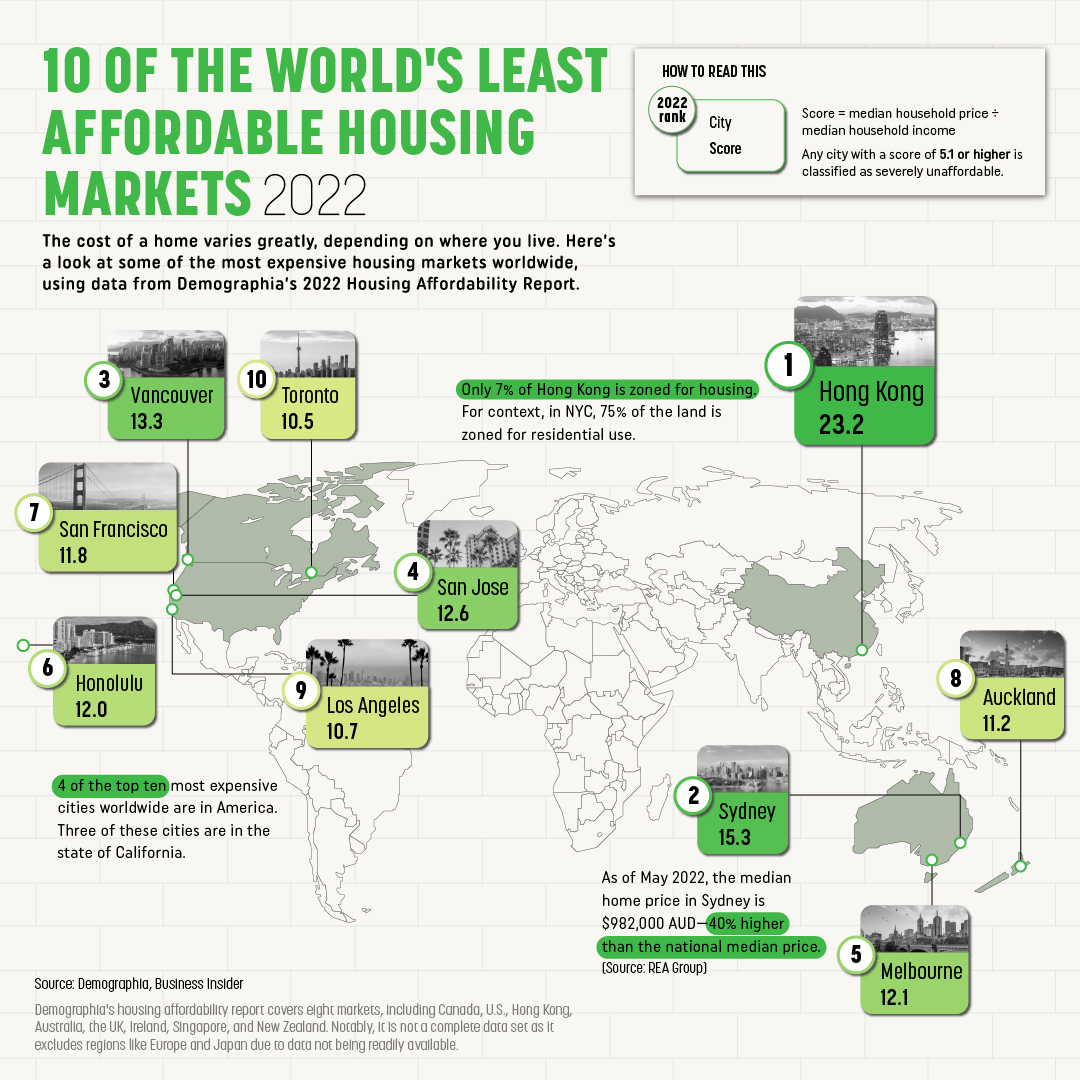
These Are 10 of the World’s Least Affordable Housing Markets
It’s become increasingly difficult for middle-class families to purchase a home over the last few years—and the global pandemic has only made things worse.
According to Demographia’s 2022 Housing Affordability Report, the number of housing markets around the world deemed “severely unaffordable” increased by 60% compared to 2019 (prior to the pandemic).
This graphic looks at some of the least affordable housing markets across the globe, relative to median household income. The report covers 92 different cities in eight nations: Australia, Canada, China, Ireland, New Zealand, Singapore, the United Kingdom, and the United States.
The Least Affordable Housing Markets
Before diving in, it’s worth outlining the methodology used in this report, to help explain what’s classified as a severely unaffordable housing market.
To calculate affordability, a city’s median housing price and divided by its median household income. From there, a city is given a score:
- A score of 5.1 or above is considered severely unaffordable
- 4.1 to 5.0 is considered seriously unaffordable
- 3.1 to 4.0 is considered moderately unaffordable
All the cities on this graphic are classified as severely unaffordable—and, for the 12th year in a row, Hong Kong takes the top spot as the world’s most unaffordable housing market, with a score of 23.2.
| Housing Market | Nation | Score |
|---|---|---|
| Hong Kong | 🇭🇰 Hong Kong (SAR) | 23.2 |
| Sydney, NSW | 🇦🇺 Australia | 15.3 |
| Vancouver, BC | 🇨🇦 Canada | 13.3 |
| San Jose, CA | 🇺🇸 U.S. | 12.6 |
| Melbourne, VIC | 🇦🇺 Australia | 12.1 |
| Honolulu, HI | 🇺🇸 U.S. | 12.0 |
| San Francisco, CA | 🇺🇸 U.S. | 11.8 |
| Auckland, AUK | 🇳🇿 New Zealand | 11.2 |
| Los Angeles, CA | 🇺🇸 U.S. | 10.7 |
| Toronto, ON | 🇨🇦 Canada | 10.5 |
One reason for Hong Kong’s steep housing costs is its lack of supply, partly due to its lack of residential zoning—which only accounts for 7% of the region’s zoned land. For context, 75% of New York City’s land area is dedicated to residential housing.
Sydney moved up one spot this year, making it the second most expensive city to purchase a home on the list, with a score of 15.3. Besides Hong Kong, no other city has scored this high in the last 18 years this report has been released.
There are several theories for Sydney’s soaring housing rates, but industry expert Tom Forrest, CEO of Urban Taskforce Australia, boils it down to one fundamental issue in an interview with Australia Broker—supply isn’t keeping up with demand:
“Housing supply has been consistently not meeting demand in the Greater Sydney and across regional New South Wales…if you have supply consistently not meeting demand then the price will go up. That’s what happened and we’re seeing it in abundance.”Tom Forrest, CEO of Urban Taskforce Australia
The COVID-19 Impact
Middle-income earners were already feeling the squeeze prior to the global pandemic, but COVID-19 only exacerbated housing affordability issues.
As people began to work from home, high-income earners started to look for more spacious housing that wasn’t necessarily in the city center, driving up demand in suburban areas that were relatively affordable prior to the pandemic.
At the same time, supply chain issues and material costs impacted construction, which created a perfect storm that ultimately drove housing prices up.
But with interest rates rising and COVID-19 restrictions easing around the world, some experts are predicting a market cool down this year—at least in some parts of the world.
>>Like this? Then you might like this article: How Much Prime Real Estate Could You Buy for $1M?
Where does this data come from?
Source: Demographia
Details: The affordability score is calculated by taking a city’s median housing price and dividing it by the median household income. Anything over 5.1 is considered severely unaffordable
Notes: Data includes 92 metropolitan markets across eight countries; Australia, Canada, Ireland, Singapore, China, New Zealand, the U.K., and the U.S., as of the third quarter of 2021. Many European countries, along wth Japan, we excluded from the dataset, because information on median income was not readily available.


Datastream
Can You Calculate Your Daily Carbon Footprint?
Discover how the average person’s carbon footprint impacts the environment and learn how carbon credits can offset your carbon footprint.


The Briefing
- A person’s carbon footprint is substantial, with activities such as food consumption creating as much as 4,500 g of CO₂ emissions daily.
- By purchasing carbon credits from Carbon Streaming Corporation, you can offset your own emissions and fund positive climate action.
Your Everyday Carbon Footprint
While many large businesses and countries have committed to net-zero goals, it is essential to acknowledge that your everyday activities also contribute to global emissions.
In this graphic, sponsored by Carbon Streaming Corporation, we will explore how the choices we make and the products we use have a profound impact on our carbon footprint.
Carbon Emissions by Activity
Here are some of the daily activities and products of the average person and their carbon footprint, according to Clever Carbon.
| Household Activities & Products | CO2 Emissions (g) |
|---|---|
| 💡 Standard Light Bulb (100 watts, four hours) | 172 g |
| 📱 Mobile Phone Use (195 minutes per day)* | 189 g |
| 👕 Washing Machine (0.63 kWh) | 275 g |
| 🔥 Electric Oven (1.56 kWh) | 675 g |
| ♨️ Tumble Dryer (2.5 kWh) | 1,000 g |
| 🧻 Toilet Roll (2 ply) | 1,300 g |
| 🚿 Hot Shower (10 mins) | 2,000 g |
| 🚙 Daily Commute (one hour, by car) | 3,360 g |
| 🍽️ Average Daily Food Consumption (three meals of 600 calories) | 4,500 g |
| *Phone use based on yearly use of 69kg per the source, Reboxed | |
Your choice of transportation plays a crucial role in determining your carbon footprint. For instance, a 15 km daily commute to work on public transport generates an average of 1,464 g of CO₂ emissions. Compared to 3,360 g—twice the volume for a journey the same length by car.
By opting for more sustainable modes of transport, such as cycling, walking, or public transportation, you can significantly reduce your carbon footprint.
Addressing Your Carbon Footprint
One way to compensate for your emissions is by purchasing high-quality carbon credits.
Carbon credits are used to help fund projects that avoid, reduce or remove CO₂ emissions. This includes nature-based solutions such as reforestation and improved forest management, or technology-based solutions such as the production of biochar and carbon capture and storage (CCS).
While carbon credits offer a potential solution for individuals to help reduce global emissions, public awareness remains a significant challenge. A BCG-Patch survey revealed that only 34% of U.S. consumers are familiar with carbon credits, and only 3% have purchased them in the past.
About Carbon Streaming
By financing the creation or expansion of carbon projects, Carbon Streaming Corporation secures the rights to future carbon credits generated by these sustainable projects. You can then purchase these carbon credits to help fund climate solutions around the world and compensate for your own emissions.
Ready to get involved?
>> Learn more about purchasing carbon credits at Carbon Streaming

-

 Travel1 week ago
Airline Incidents: How Do Boeing and Airbus Compare?
-

 Markets2 weeks ago
Visualizing America’s Shortage of Affordable Homes
-

 Green2 weeks ago
Ranked: Top Countries by Total Forest Loss Since 2001
-

 Money2 weeks ago
Where Does One U.S. Tax Dollar Go?
-

 Misc2 weeks ago
Almost Every EV Stock is Down After Q1 2024
-

 AI2 weeks ago
The Stock Performance of U.S. Chipmakers So Far in 2024
-

 Markets2 weeks ago
Charted: Big Four Market Share by S&P 500 Audits
-

 Real Estate2 weeks ago
Ranked: The Most Valuable Housing Markets in America