Money
10 Banknotes From Around the World, and Their Security Features
The history of counterfeiting is almost as extensive as the history of money itself.
It’s said that even the first electrum coins in Lydia were regularly faked, and coming across counterfeit coins in Ancient Rome was a daily occurrence. Roman Emperors, like other rulers, also famously did their own counterfeiting, debasing the metal in coins and trying to pass them off as having higher value.
The problem of funny money remained an issue for society even thousands of years later. For example, at the start of the U.S. Civil War in 1861 – when banks still issued their own currencies – it was estimated that half of the banknotes in circulation were forgeries.
Banknote Security Features
And as we move towards a more digital world, the cat and mouse games between authorities and counterfeiters continues.
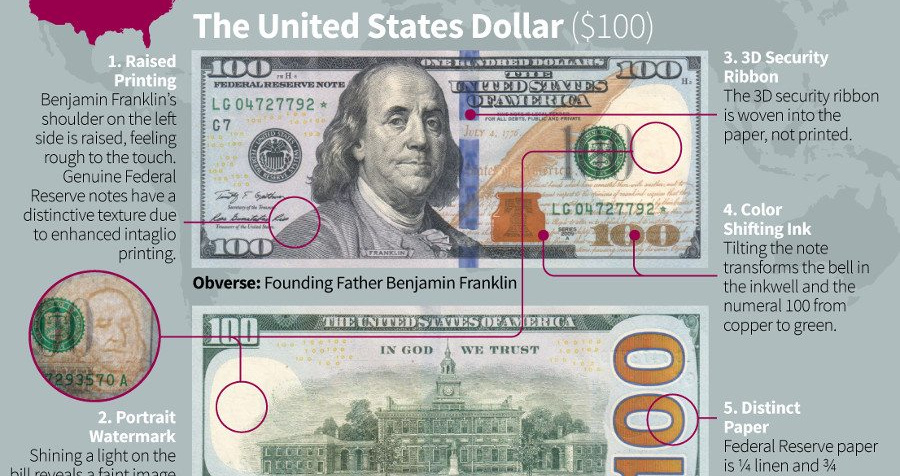
Today’s infographic comes to us from TitleMax and it details 10 popular banknotes from around the world, including the anti-counterfeiting measures that have been taken for each note.
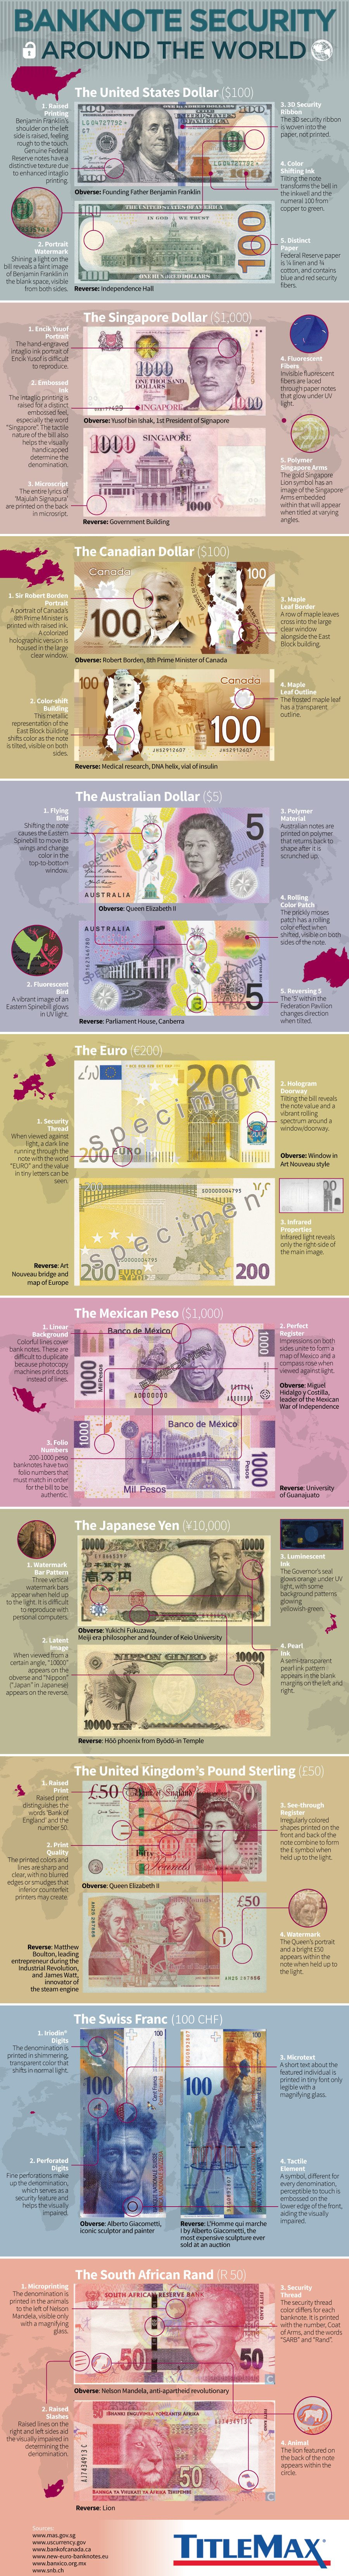
Through centuries of collective experience, advances in technology, and many episodes of trial and error, the latest fiat banknotes have impressive security features that blow previous generations out of the water.
Common Security Features Used
Many national mints have adopted similar anti-counterfeiting technologies for their banknotes:
Plastic money: In Canada, authorities were starting to find 470 counterfeits for every one million legitimate banknotes that existed – a rate almost 10x as high as other G20 countries. In light of this problem, the Bank of Canada recently introduced polymer notes that make counterfeiting considerably more difficult.
Polymer banknotes were pioneered in Australia in 1988, and like Canada, many countries have made the switch to polymer including the United Kingdom, Malaysia, Chile, New Zealand, and Mexico.
Holograms: More than 300 denominations in 97 currencies use holograms for protection, making them one of the most common security features globally. They can be incorporated into designs by the way of security threads, stripes, patches and window features.
Watermarks: One of the most common security features, watermarks are created by using different thicknesses of paper in the printing process. When hit with light, an image will be illuminated.
Microtext: Tiny text, which can only be read with a magnifying glass, is a common safety feature on many bills globally.
Color-changing features: Roughly 42% of banknotes issued since 2011 use color-changing features in which parts of the note change color to the viewer depending on the angle.
Security thread: Many notes use this security feature, which consists of a thin ribbon that is threaded through the note’s paper.
Invisible marks: Notes can also incorporate ink or markings that are only visible in fluorescent or infrared light, making them invisible to the naked eye.


Money
Charted: Who Has Savings in This Economy?
Older, better-educated adults are winning the savings game, reveals a January survey by the National Opinion Research Center at the University of Chicago.


Who Has Savings in This Economy?
This was originally posted on our Voronoi app. Download the app for free on iOS or Android and discover incredible data-driven charts from a variety of trusted sources.
Two full years of inflation have taken their toll on American households. In 2023, the country’s collective credit card debt crossed $1 trillion for the first time. So who is managing to save money in the current economic environment?
We visualize the percentage of respondents to the statement “I have money leftover at the end of the month” categorized by age and education qualifications. Data is sourced from a National Endowment for Financial Education (NEFE) report, published last month.
The survey for NEFE was conducted from January 12-14, 2024, by the National Opinion Research Center at the University of Chicago. It involved 1,222 adults aged 18+ and aimed to be representative of the U.S. population.
Older Americans Save More Than Their Younger Counterparts
General trends from this dataset indicate that as respondents get older, a higher percentage of them are able to save.
| Age | Always/Often | Sometimes | Rarely/Never |
|---|---|---|---|
| 18–29 | 29% | 33% | 38% |
| 30–44 | 36% | 27% | 37% |
| 45–59 | 39% | 23% | 38% |
| Above 60 | 49% | 28% | 23% |
| All Adults | 39% | 33% | 27% |
Note: Percentages are rounded and may not sum to 100.
Perhaps not surprisingly, those aged 60+ are the age group with the highest percentage saying they have leftover money at the end of the month. This age group spent the most time making peak earnings in their careers, are more likely to have investments, and are more likely to have paid off major expenses like a mortgage or raising a family.
The Impact of Higher Education on Earnings and Savings
Based on this survey, higher education dramatically improves one’s ability to save. Shown in the table below, those with a bachelor’s degree or higher are three times more likely to have leftover money than those without a high school diploma.
| Education | Always/Often | Sometimes | Rarely/Never |
|---|---|---|---|
| No HS Diploma | 18% | 26% | 56% |
| HS Diploma | 28% | 33% | 39% |
| Associate Degree | 33% | 31% | 36% |
| Bachelor/Higher Degree | 59% | 21% | 20% |
| All Adults | 39% | 33% | 27% |
Note: Percentages are rounded and may not sum to 100.
As the Bureau of Labor Statistics notes, earnings improve with every level of education completed.
For example, those with a high school diploma made 25% more than those without in 2022. And as the qualifications increase, the effects keep stacking.
Meanwhile, a Federal Reserve study also found that those with more education tended to make financial decisions that contributed to building wealth, of which the first step is to save.

-

 Markets1 week ago
U.S. Debt Interest Payments Reach $1 Trillion
-

 Business2 weeks ago
Charted: Big Four Market Share by S&P 500 Audits
-

 Real Estate2 weeks ago
Ranked: The Most Valuable Housing Markets in America
-

 Money2 weeks ago
Which States Have the Highest Minimum Wage in America?
-

 AI2 weeks ago
Ranked: Semiconductor Companies by Industry Revenue Share
-

 Markets2 weeks ago
Ranked: The World’s Top Flight Routes, by Revenue
-

 Demographics2 weeks ago
Population Projections: The World’s 6 Largest Countries in 2075
-

 Markets2 weeks ago
The Top 10 States by Real GDP Growth in 2023