Mining
A Year’s Worth of Resources in British Columbia
https://beta.quiet.ly/list/share/8dc7b-a-year-s-worth-of-resources-in-bc?width=796&height=0&showGradient=false&showMapView=false&showAuthor=false&showLogo=true&showListTitle=true&showListDescription=true&showTitles=true&showDescriptions=true&showWeblinks=true&makeClickable=true&sharePage=true&showIcons=true&embedTheme=dark&titleSize=18&titleType=quietly&descriptionSize=14&descriptionType=quietly&useOriginalImages=true&lastSlide=default&lastSlideMsg=&lastSlideUrl=http%3A%2F%2Fwww.facebook.com%2Fvisualcapitalist
A Year’s Worth of Resources in British Columbia
Earlier this month, we created a slideshow visualizing the amount of metal and oil extracted globally with famous landmarks and cities.
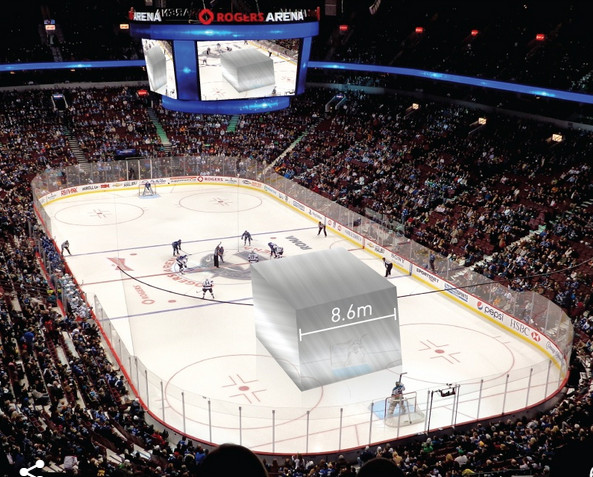
We’ve received numerous requests from folks in our hometown of Vancouver, BC to show how much resources are extracted in British Columbia. As you can see in the above slideshow, we have covered gold, silver, zinc, molybdenum, copper, lead, metallurgical coal, and even wood products.
It surprises many British Columbians that one of the most valuable resources is met coal, which is not used for power generation but to produce steel. Steel is an alloy of iron and carbon, and the carbon comes from the metallurgical coal. In fact, 70% of steel worldwide is made this way.
Also surprising is that less than 1m cubed of gold is produced in BC each year. This may change soon with some of the many projects that may eventually go into production, but for now it remains quite low and rare in BC.
To us, one thing is clear: BC is a beautiful and resource-rich province. We at Visual Capitalist hope that companies learn from the tragic events of Mt. Polley this summer and are able to start building and maintaining mining projects that far exceed expectations for safety and environmental stewardship.
Special kudos to PwC for providing most of the information in their latest Digging Deeper report. (Note: some cube sizes were estimated in size based on value of commodity shipped and avg. 2013 commodity prices)


Lithium
Ranked: The Top 10 EV Battery Manufacturers in 2023
Asia dominates this ranking of the world’s largest EV battery manufacturers in 2023.


The Top 10 EV Battery Manufacturers in 2023
This was originally posted on our Voronoi app. Download the app for free on iOS or Android and discover incredible data-driven charts from a variety of trusted sources.
Despite efforts from the U.S. and EU to secure local domestic supply, all major EV battery manufacturers remain based in Asia.
In this graphic we rank the top 10 EV battery manufacturers by total battery deployment (measured in megawatt-hours) in 2023. The data is from EV Volumes.
Chinese Dominance
Contemporary Amperex Technology Co. Limited (CATL) has swiftly risen in less than a decade to claim the title of the largest global battery group.
The Chinese company now has a 34% share of the market and supplies batteries to a range of made-in-China vehicles, including the Tesla Model Y, SAIC’s MG4/Mulan, and various Li Auto models.
| Company | Country | 2023 Production (megawatt-hour) | Share of Total Production |
|---|---|---|---|
| CATL | 🇨🇳 China | 242,700 | 34% |
| BYD | 🇨🇳 China | 115,917 | 16% |
| LG Energy Solution | 🇰🇷 Korea | 108,487 | 15% |
| Panasonic | 🇯🇵 Japan | 56,560 | 8% |
| SK On | 🇰🇷 Korea | 40,711 | 6% |
| Samsung SDI | 🇰🇷 Korea | 35,703 | 5% |
| CALB | 🇨🇳 China | 23,493 | 3% |
| Farasis Energy | 🇨🇳 China | 16,527 | 2% |
| Envision AESC | 🇨🇳 China | 8,342 | 1% |
| Sunwoda | 🇨🇳 China | 6,979 | 1% |
| Other | - | 56,040 | 8% |
In 2023, BYD surpassed LG Energy Solution to claim second place. This was driven by demand from its own models and growth in third-party deals, including providing batteries for the made-in-Germany Tesla Model Y, Toyota bZ3, Changan UNI-V, Venucia V-Online, as well as several Haval and FAW models.
The top three battery makers (CATL, BYD, LG) collectively account for two-thirds (66%) of total battery deployment.
Once a leader in the EV battery business, Panasonic now holds the fourth position with an 8% market share, down from 9% last year. With its main client, Tesla, now sourcing batteries from multiple suppliers, the Japanese battery maker seems to be losing its competitive edge in the industry.
Overall, the global EV battery market size is projected to grow from $49 billion in 2022 to $98 billion by 2029, according to Fortune Business Insights.

-

 Green1 week ago
Ranked: The Countries With the Most Air Pollution in 2023
-

 Automotive2 weeks ago
Almost Every EV Stock is Down After Q1 2024
-

 AI2 weeks ago
The Stock Performance of U.S. Chipmakers So Far in 2024
-

 Markets2 weeks ago
Charted: Big Four Market Share by S&P 500 Audits
-

 Real Estate2 weeks ago
Ranked: The Most Valuable Housing Markets in America
-

 Money2 weeks ago
Which States Have the Highest Minimum Wage in America?
-

 AI2 weeks ago
Ranked: Semiconductor Companies by Industry Revenue Share
-

 Travel2 weeks ago
Ranked: The World’s Top Flight Routes, by Revenue