Technology
The World’s 100 Most Valuable Brands in 2018
The World’s 100 Most Valuable Brands in 2018
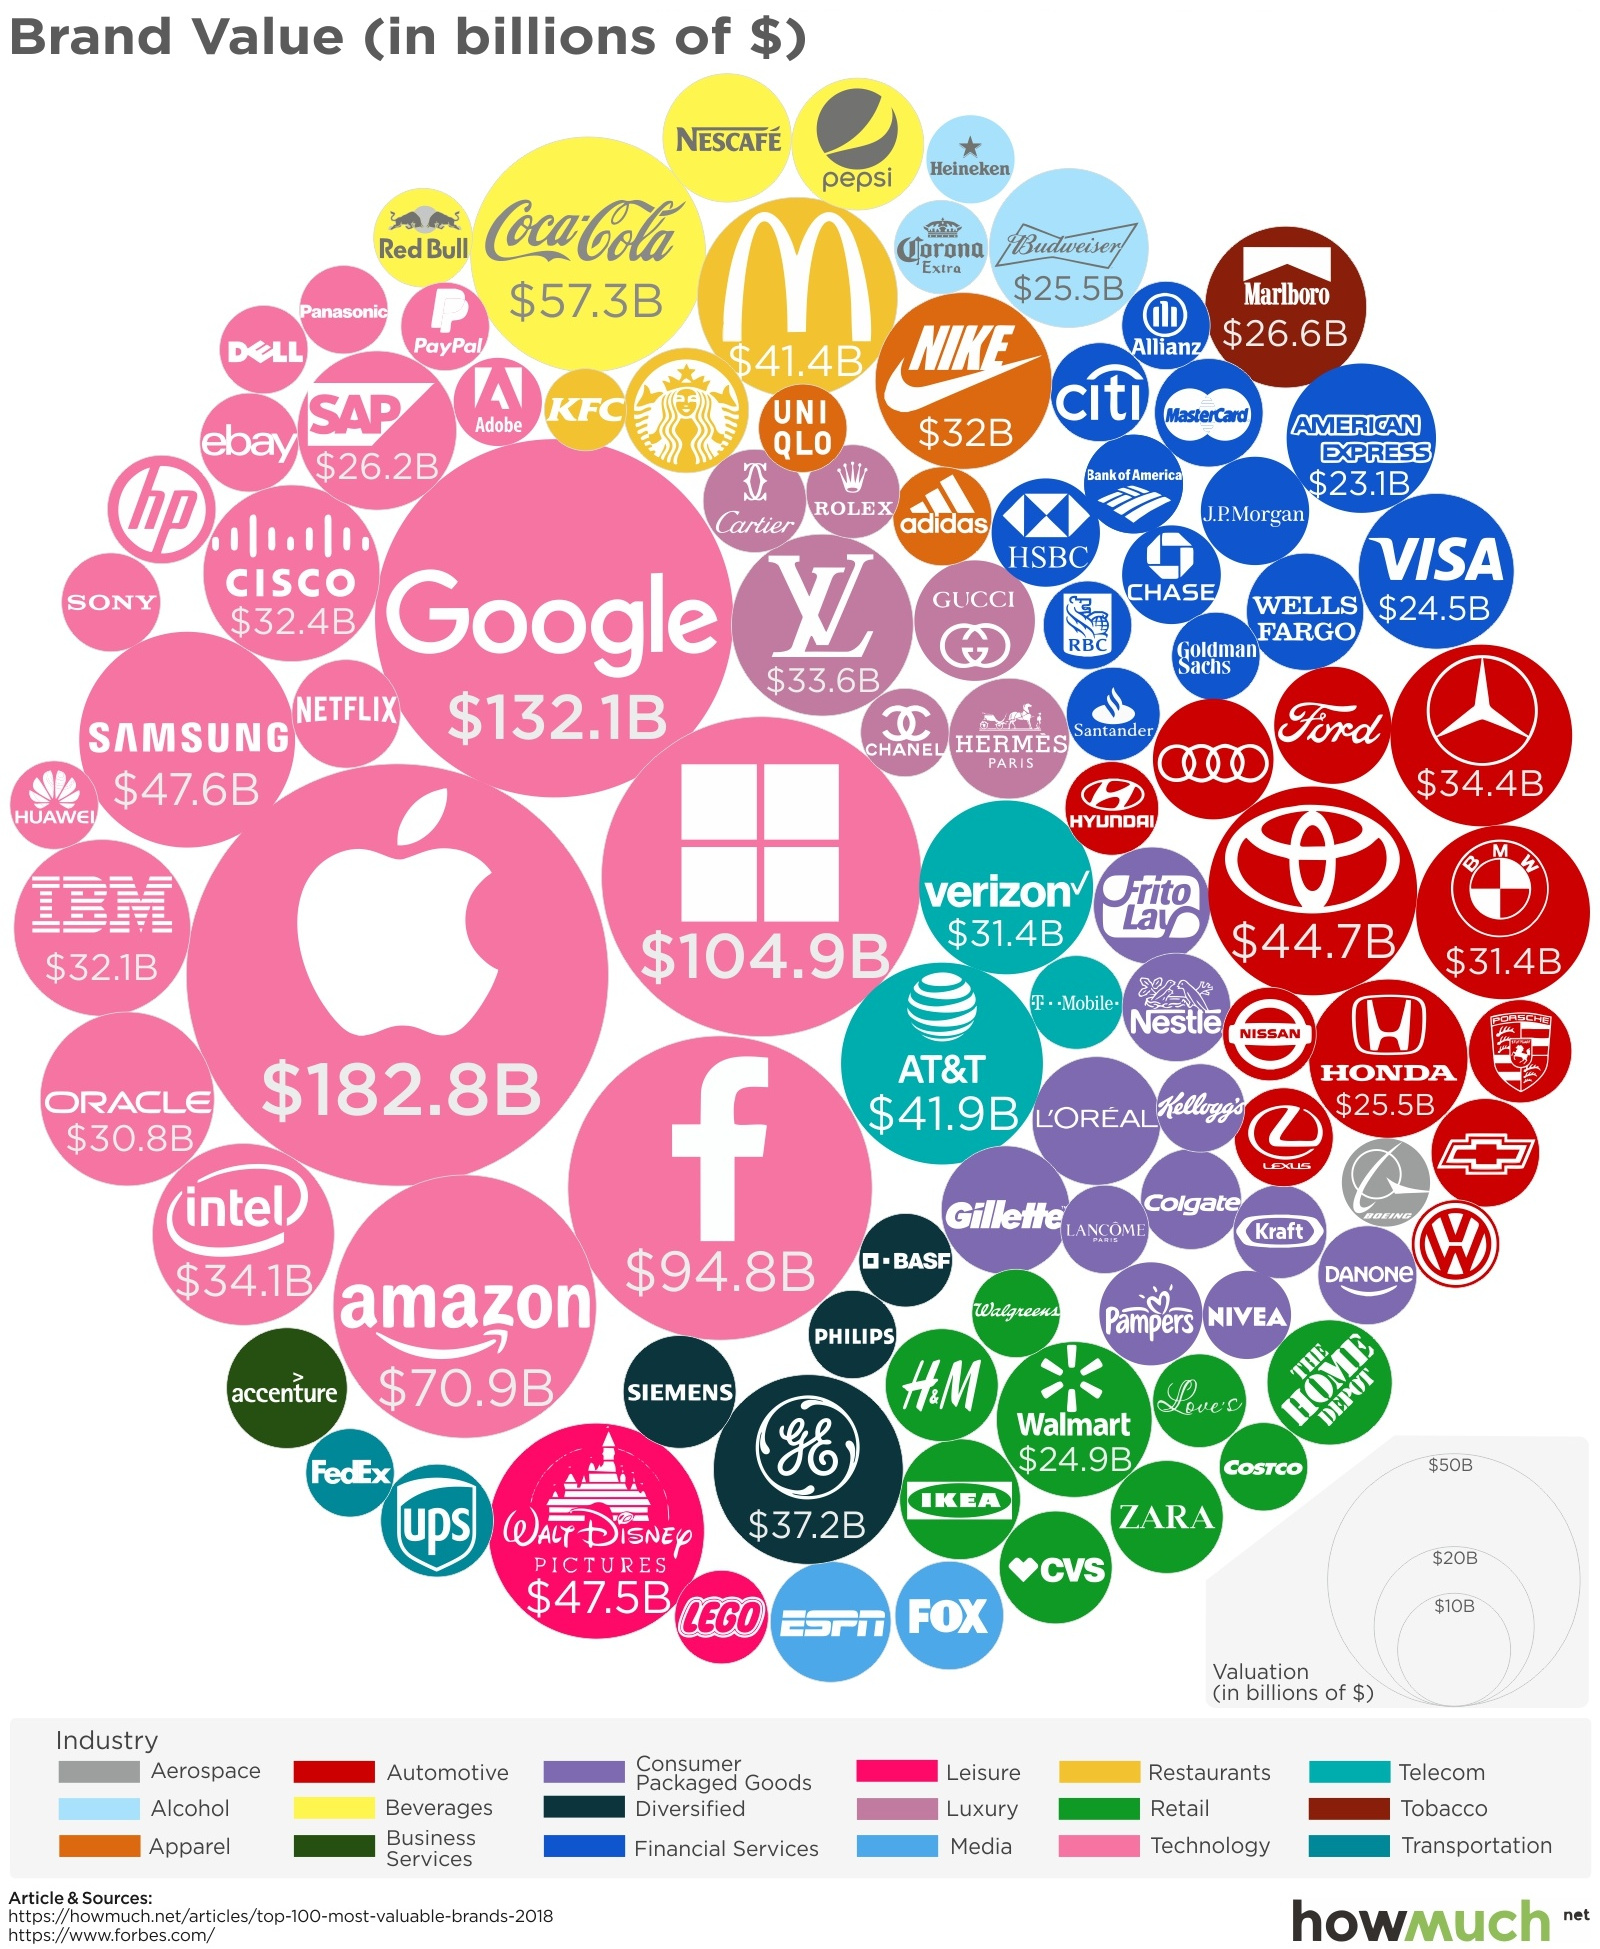
According to Forbes, the world’s 100 most valuable brands are worth a staggering $2.15 trillion.
While that singular number is impressive, the publication’s 2018 rankings of global brands can be further broken down in other ways that are also quite intriguing. Let’s take a look at brands by individual brand value, as well as sorted by relevant industry.
Ranking the Most Valuable Brands in 2018
Today’s infographic comes to us from HowMuch.net and it showcases the 100 most valuable brands in the world, according to recent Forbes rankings.
Here are the brands with the most assessed value, along with their one-year change and industry.
| Rank | Brand | Brand Value ($B) | 1-Year Change | Industry |
|---|---|---|---|---|
| #1 | Apple | $182.8 | +8% | Technology |
| #2 | $132.1 | +30% | Technology | |
| #3 | Microsoft | $104.9 | +21% | Technology |
| #4 | $94.8 | +29% | Technology | |
| #5 | Amazon | $70.9 | +31% | Technology |
| #6 | Coca-Cola | $57.3 | +2% | Beverages |
| #7 | Samsung | $47.6 | +25% | Technology |
| #8 | Disney | $47.5 | +8% | Leisure |
| #9 | Toyota | $44.7 | +9% | Automotive |
| #10 | AT&T | $41.9 | +14% | Telecom |
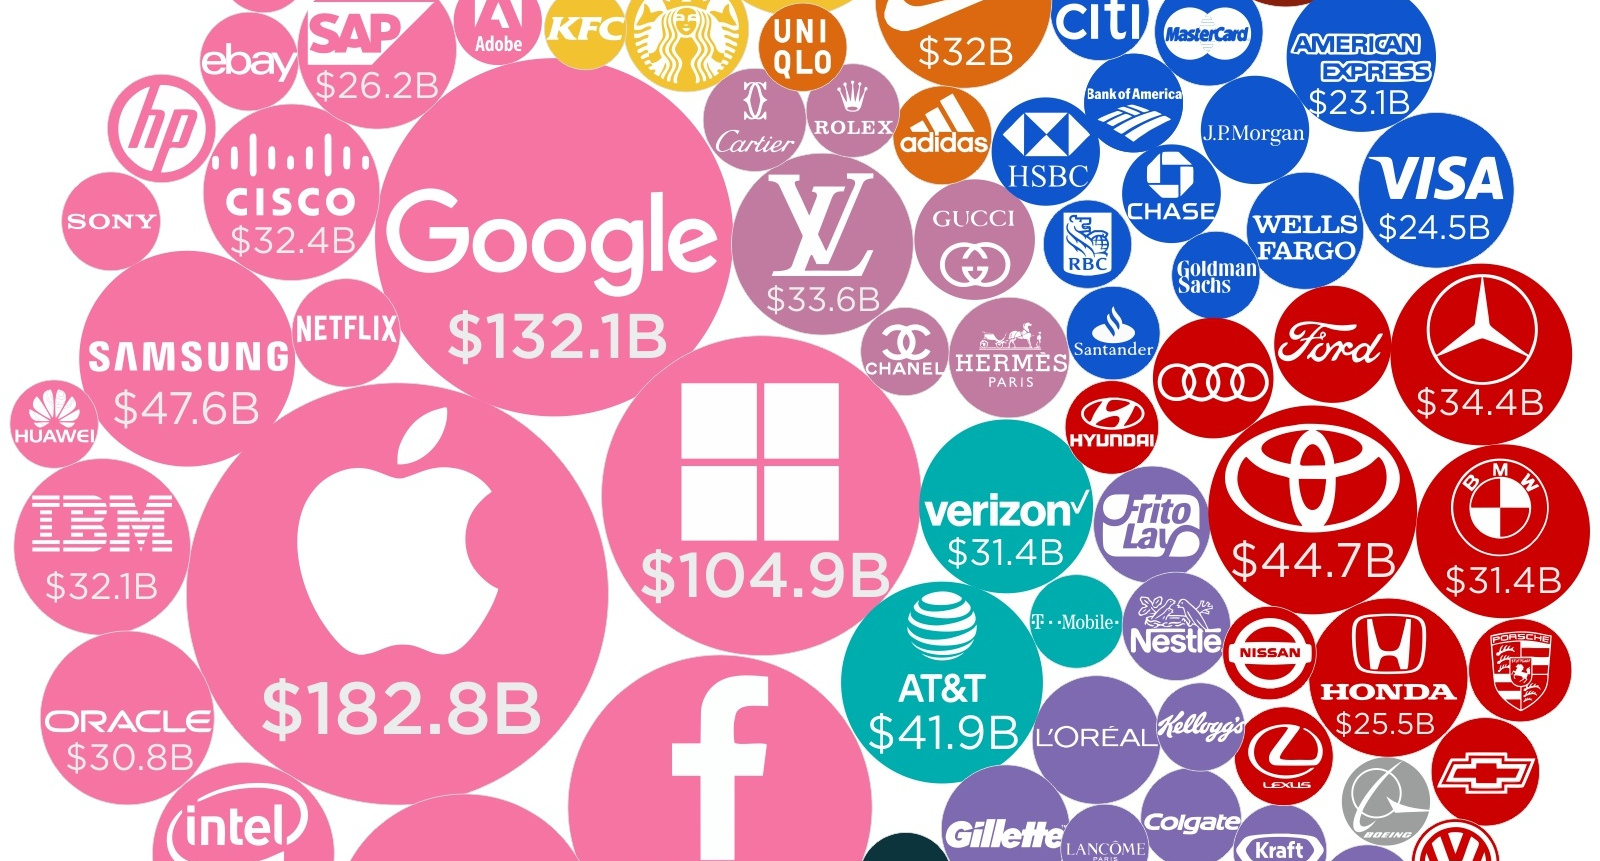
Apple remains the world’s most valuable brand at $182.8 billion, but there are four other tech companies hot on the iPhone maker’s heels – and each of them is growing brand value at a rapid pace.
Google (+30%), Microsoft (+21%), Facebook (+29%), and Amazon (31%) are all gaining at double-digit clips. At this point, each has lapped Coca-Cola, the highest ranked non-tech brand in the Top 10 at $57.3 billion.
Brands by Industry
The aforementioned top five brands are all focused on technology, but it’s important to recognize that this is also a part of a much wider trend.
Over the last decade, tech brands have gained consumer prominence to make the industry dominant both in terms of quantity of brands (20%) and total brand value (41%) on the Forbes 100 Most Valuable Brand list.
| Industry | # of Brands | Total Brand Value ($B) |
|---|---|---|
| Technology | 20 | $872.6 |
| Financial Services | 13 | $160.2 |
| Automotive | 12 | $222.9 |
| Consumer Goods | 11 | $124.7 |
| Retail | 9 | $119.0 |
| Luxury | 6 | $91.7 |
| Beverages | 4 | $103.2 |
| Diversified | 4 | $66.3 |
| Telecom | 3 | $82.3 |
| Restaurants | 3 | $65.0 |
| Apparel | 3 | $49.0 |
| Alcohol | 3 | $42.5 |
| Leisure | 2 | $56.1 |
| Media | 2 | $26.3 |
| Transportation | 2 | $21.6 |
| Tobacco | 1 | $26.6 |
| Business Services | 1 | $14.8 |
| Aerospace | 1 | $8.1 |
| Total | 100 | $2,152.9 |
Only a handful of brands in consumer-facing industries like media, apparel, alcohol, and restaurants make the rankings.
Meanwhile, sectors that traditionally rely on heavy amounts of advertising – like consumer packaged goods and retail – have just 20 brands on the list between them. The highest ranked brand in either of those categories is Walmart at #26th with a brand value of $24.9 billion, which is about 1/3 of the brand value of online competitor Amazon.


Technology
Ranked: Semiconductor Companies by Industry Revenue Share
Nvidia is coming for Intel’s crown. Samsung is losing ground. AI is transforming the space. We break down revenue for semiconductor companies.


Semiconductor Companies by Industry Revenue Share
This was originally posted on our Voronoi app. Download the app for free on Apple or Android and discover incredible data-driven charts from a variety of trusted sources.
Did you know that some computer chips are now retailing for the price of a new BMW?
As computers invade nearly every sphere of life, so too have the chips that power them, raising the revenues of the businesses dedicated to designing them.
But how did various chipmakers measure against each other last year?
We rank the biggest semiconductor companies by their percentage share of the industry’s revenues in 2023, using data from Omdia research.
Which Chip Company Made the Most Money in 2023?
Market leader and industry-defining veteran Intel still holds the crown for the most revenue in the sector, crossing $50 billion in 2023, or 10% of the broader industry’s topline.
All is not well at Intel, however, with the company’s stock price down over 20% year-to-date after it revealed billion-dollar losses in its foundry business.
| Rank | Company | 2023 Revenue | % of Industry Revenue |
|---|---|---|---|
| 1 | Intel | $51B | 9.4% |
| 2 | NVIDIA | $49B | 9.0% |
| 3 | Samsung Electronics | $44B | 8.1% |
| 4 | Qualcomm | $31B | 5.7% |
| 5 | Broadcom | $28B | 5.2% |
| 6 | SK Hynix | $24B | 4.4% |
| 7 | AMD | $22B | 4.1% |
| 8 | Apple | $19B | 3.4% |
| 9 | Infineon Tech | $17B | 3.2% |
| 10 | STMicroelectronics | $17B | 3.2% |
| 11 | Texas Instruments | $17B | 3.1% |
| 12 | Micron Technology | $16B | 2.9% |
| 13 | MediaTek | $14B | 2.6% |
| 14 | NXP | $13B | 2.4% |
| 15 | Analog Devices | $12B | 2.2% |
| 16 | Renesas Electronics Corporation | $11B | 1.9% |
| 17 | Sony Semiconductor Solutions Corporation | $10B | 1.9% |
| 18 | Microchip Technology | $8B | 1.5% |
| 19 | Onsemi | $8B | 1.4% |
| 20 | KIOXIA Corporation | $7B | 1.3% |
| N/A | Others | $126B | 23.2% |
| N/A | Total | $545B | 100% |
Note: Figures are rounded. Totals and percentages may not sum to 100.
Meanwhile, Nvidia is very close to overtaking Intel, after declaring $49 billion of topline revenue for 2023. This is more than double its 2022 revenue ($21 billion), increasing its share of industry revenues to 9%.
Nvidia’s meteoric rise has gotten a huge thumbs-up from investors. It became a trillion dollar stock last year, and broke the single-day gain record for market capitalization this year.
Other chipmakers haven’t been as successful. Out of the top 20 semiconductor companies by revenue, 12 did not match their 2022 revenues, including big names like Intel, Samsung, and AMD.
The Many Different Types of Chipmakers
All of these companies may belong to the same industry, but they don’t focus on the same niche.
According to Investopedia, there are four major types of chips, depending on their functionality: microprocessors, memory chips, standard chips, and complex systems on a chip.
Nvidia’s core business was once GPUs for computers (graphics processing units), but in recent years this has drastically shifted towards microprocessors for analytics and AI.
These specialized chips seem to be where the majority of growth is occurring within the sector. For example, companies that are largely in the memory segment—Samsung, SK Hynix, and Micron Technology—saw peak revenues in the mid-2010s.

-

 Real Estate2 weeks ago
Visualizing America’s Shortage of Affordable Homes
-

 Technology1 week ago
Ranked: Semiconductor Companies by Industry Revenue Share
-

 Money1 week ago
Which States Have the Highest Minimum Wage in America?
-

 Real Estate1 week ago
Ranked: The Most Valuable Housing Markets in America
-

 Business1 week ago
Charted: Big Four Market Share by S&P 500 Audits
-

 AI2 weeks ago
The Stock Performance of U.S. Chipmakers So Far in 2024
-

 Misc2 weeks ago
Almost Every EV Stock is Down After Q1 2024
-

 Money2 weeks ago
Where Does One U.S. Tax Dollar Go?