Investor Education
What is an ETF?
What is an ETF?
In 1989, the idea for the exchange-traded fund (ETF) was born.
Initially marketed to investors as Index Participation Shares, this innovative new product was meant to be a proxy for the S&P 500 that also traded on an exchange like a stock. After being launched, this early ETF prototype was immediately targeted by lawyers of the Chicago Mercantile Exchange (CME) for illegally behaving like a futures contract. A lawsuit ensued, and a federal judge in Chicago ruled that they needed to be withdrawn.
A year later, the case can be made that Canada was the birthplace of the first successful ETF. This time the product was called Toronto 35 Index Participation Units (TIPs 35), and it tracked the TSE-35 Index at the time. TIPs were instantly lauded for providing low-cost exposure to Canadian equities – and shortly after, many more ETFs in Canada and the United States would follow suit, including the SPDR S&P 500 Trust ETF in 1993.
How do ETFs work?
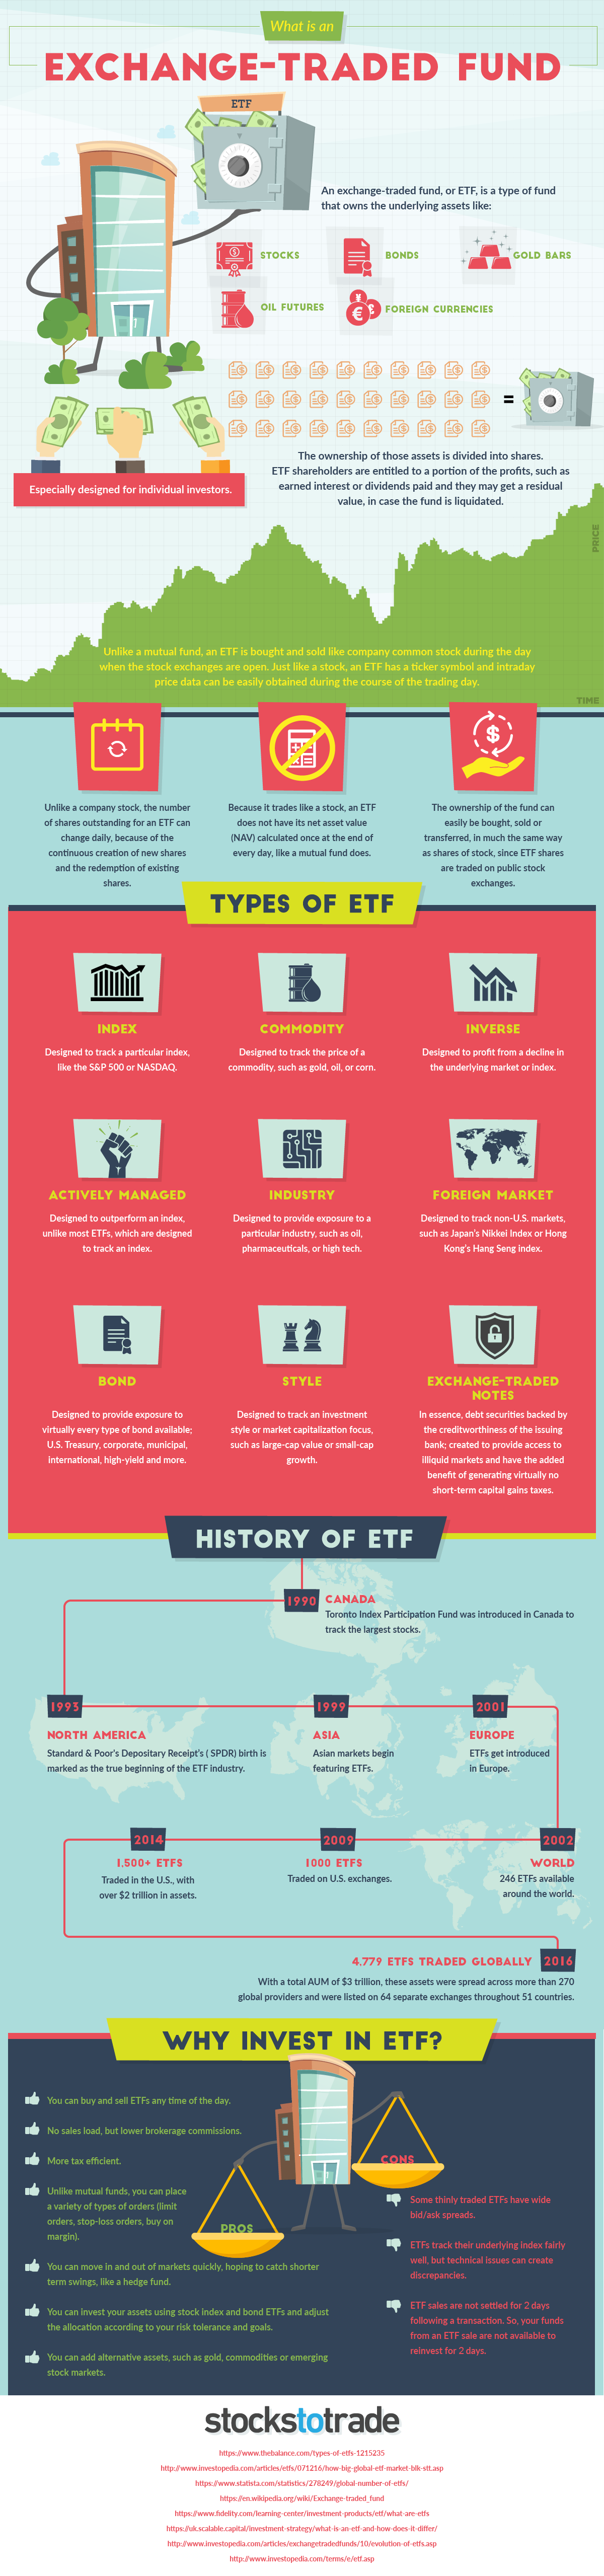
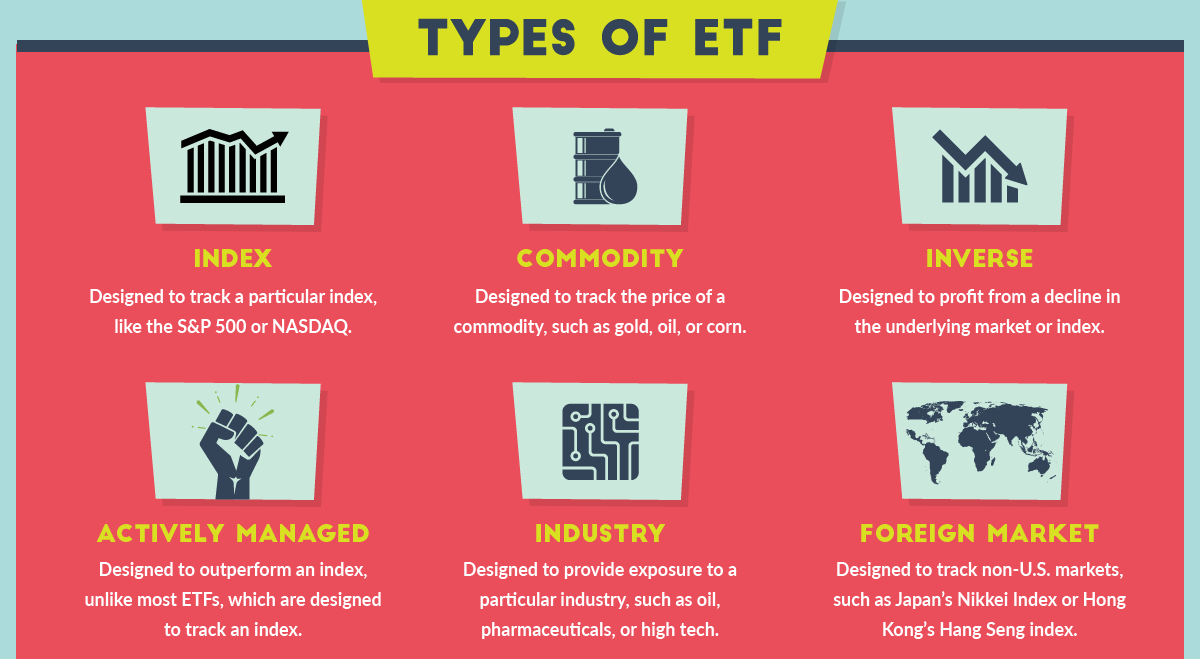
Today’s infographic from StocksToTrade.com highlights the basics around ETFs, including how they work, what type of assets they can track, and the pros and cons associated with investing in them.
In the most basic sense, an ETF is a type of fund that owns assets – like stocks, commodities, or futures – but has its ownership divided into shares that trade on stock exchanges.
In other words, investors can buy and sell ETFs whenever they want during trading hours. Like a stock, each ETF has a ticker symbol and a price that changes in real-time. However, unlike a stock, the number of shares outstanding can change daily based on the share creation and redemption mechanisms.
Pros and Cons
There are many views out there on ETFs, but it is generally accepted that they provide an inexpensive, transparent, and convenient way to get access to many different asset classes. This makes it easy to diversify a portfolio, and it also makes ETFs simple to buy and sell.
For these reasons, the passive management investment industry has taken off, and the ETF industry now has over $4 trillion of assets under management (AUM) globally. By the year 2021, ETFs are expected to surpass the $7 trillion mark for AUM.
Despite this growth and a wide range of benefits, ETFs do have some detractors.
Critics would be quick to point out that some ETFs are very thinly traded, providing wide bid/ask spreads and lower liquidity. Furthermore, there can also be instances where technical issues can cause a performance gap between the ETF and the index it tracks, known as tracking error.
As a final point, it’s worth mentioning that there is some counterparty risk with ETFs – for example, even if you “own” physically-backed gold through the SPDR Gold Trust (GLD), there is a chance that in extreme situations that you may not actually get to see the benefit of that gold. The counterparty risk stems from the possibility of a party failing to deliver on their promises, and is actually quite common to see with other types of assets, as well.


Investor Education
How MSCI Builds Thematic Indexes: A Step-by-Step Guide
From developing an index objective to choosing relevant stocks, this graphic breaks down how MSCI builds thematic indexes using examples.


How MSCI Builds Thematic Indexes: A Step-by-Step Guide
Have you ever wondered how MSCI builds its thematic indexes?
To capture long-term, structural trends that could drive business performance in the future, the company follows a systematic approach. This graphic from MSCI breaks down each step in the process used to create its thematic indexes.
Step 1: Develop an Index Objective
MSCI first builds a broad statement of what the theme aims to capture based on extensive research and insights from industry experts.
Steps 2 and 3: List Sub-Themes, Generate Keyword List
Together with experts, MSCI creates a list of sub-themes or “seedwords” to identify aligned business activities.
The team then assembles a collection of suitable documents describing the theme. Natural language processing efficiently analyzes word frequency and relevance to generate a more detailed set of keywords contextually similar to the seedwords.
Step 4: Find Relevant Companies
By analyzing financial reports, MSCI picks companies relevant to the theme using two methods:
- Direct approach: Revenue from a company’s business segment is considered 100% relevant if the segment name matches a theme keyword. Standard Industrial Classification (SIC) codes from these directly-matched segments make up the eligible SIC code list used in the indirect approach.
- Indirect approach: If a segment name doesn’t match theme keywords, MSCI will:
- Analyze the density of theme keywords mentioned in the company’s description. A minimum of two unique keywords is required.
- The keyword density determines a “discount factor” to reflect lower certainty in theme alignment.
- Revenue from business segments with an eligible SIC code, regardless of how they are named, is scaled down by the discount factor.
The total percentage of revenue applicable to the theme from both approaches determines a company’s relevance score.
Step 5: Select the Stocks
Finally, MSCI narrows down the stocks that will be included:
- Global parent universe: The ACWI Investable Market Index (IMI) is the starting point for standard thematic indexes.
- Relevance filter: The universe is filtered for companies with a relevance score of at least 25%.
- False positive control: Eligible companies that are mapped to un-related GICS sub-industries are removed.
Companies with higher relevance scores and market caps have a higher weighting in the index, with the maximum weighting for any one issuer capped at 5%. The final selected stocks span various sectors.
MSCI Thematic Indexes: Regularly Updated and Rules-Based
Once an index is built, it is reviewed semi-annually and updated based on:
- Changes to the parent index
- Changes at individual companies
- Theme developments based on expert input
Theme keywords are reviewed yearly in May. Overall, MSCI’s thematic index construction process is objective, scalable, and flexible. The process can be customized based on the theme(s) you want to capture.
Learn more about MSCI’s thematic indexes.

-

 Investor Education5 months ago
The 20 Most Common Investing Mistakes, in One Chart
Here are the most common investing mistakes to avoid, from emotionally-driven investing to paying too much in fees.
-

 Stocks10 months ago
Visualizing BlackRock’s Top Equity Holdings
BlackRock is the world’s largest asset manager, with over $9 trillion in holdings. Here are the company’s top equity holdings.
-

 Investor Education10 months ago
10-Year Annualized Forecasts for Major Asset Classes
This infographic visualizes 10-year annualized forecasts for both equities and fixed income using data from Vanguard.
-

 Investor Education1 year ago
Visualizing 90 Years of Stock and Bond Portfolio Performance
How have investment returns for different portfolio allocations of stocks and bonds compared over the last 90 years?
-

 Debt2 years ago
Countries with the Highest Default Risk in 2022
In this infographic, we examine new data that ranks the top 25 countries by their default risk.
-

 Markets2 years ago
The Best Months for Stock Market Gains
This infographic analyzes over 30 years of stock market performance to identify the best and worst months for gains.


-

 Mining2 weeks ago
Charted: The Value Gap Between the Gold Price and Gold Miners
-

 Real Estate1 week ago
Ranked: The Most Valuable Housing Markets in America
-

 Business1 week ago
Charted: Big Four Market Share by S&P 500 Audits
-

 AI1 week ago
The Stock Performance of U.S. Chipmakers So Far in 2024
-

 Misc1 week ago
Almost Every EV Stock is Down After Q1 2024
-

 Money2 weeks ago
Where Does One U.S. Tax Dollar Go?
-

 Green2 weeks ago
Ranked: Top Countries by Total Forest Loss Since 2001
-

 Markets2 weeks ago
Visualizing America’s Shortage of Affordable Homes