Technology
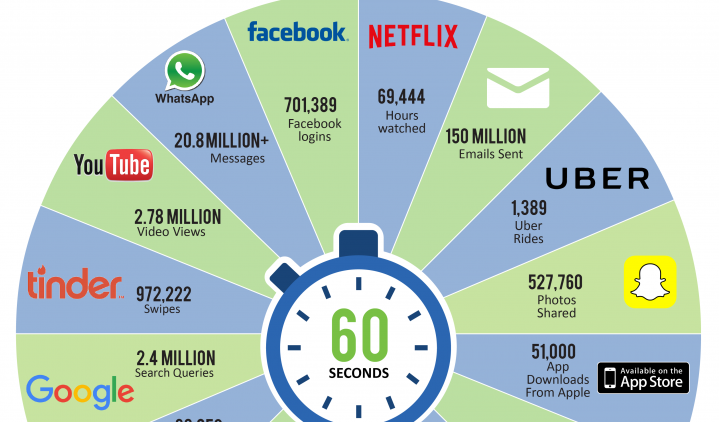
What Happens in an Internet Minute in 2016?
Last week, we published U.S. consumption numbers in real-time, highlighting the speed at which physical goods and services are purchased.
Today, we enter into the digital realm to see what happens every minute on the internet. The statistics are mind-boggling and put in perspective how scalable platforms have taken over the world:
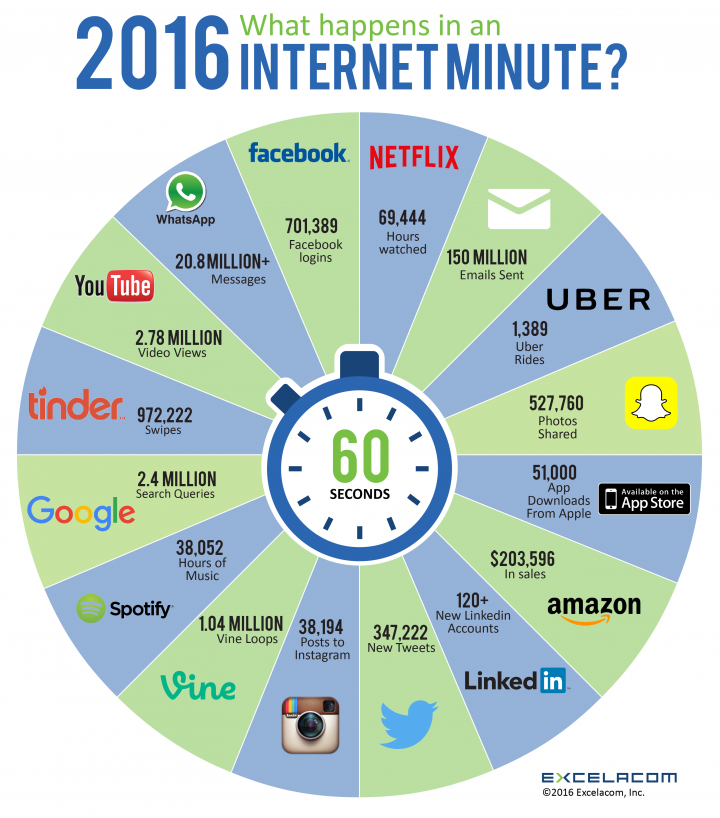
The above infographic shows how truly important the element of scale is to business today.
Google literally processes 2.4 million searches every minute. In that same span of time, 700,000 people login to Facebook and Amazon sells over $200,000 of physical and digital goods.
Platforms such as the ones listed above are comparable in magnitude to other mega-sized companies, but without the intense capital expenditures, debt, or hard costs. That’s why Alphabet, Google’s parent company, can spend over a billion dollars each year on “moonshots”, and why Facebook’s stock is up 35.6% over the last 52 weeks.
Here are the full stats on what happens every internet minute:
- 701,389 logins on Facebook
- 69,444 hours watched on Netflix
- 150 million emails sent
- 1,389 Uber rides
- 527,760 photos shared on Snapchat
- 51,000 app downloads on Apple’s App Store
- $203,596 in sales on Amazon.com
- 120+ new Linkedin accounts
- 347,222 tweets on Twitter
- 28,194 new posts to Instagram
- 38,052 hours of music listened to on Spotify
- 1.04 million vine loops
- 2.4 million search queries on Google
- 972,222 Tinder swipes
- 2.78 million video views on Youtube
- 20.8 million messages on WhatsApp
That’s a lot of data every minute, and this volume of information is part of the reason that these same companies are prioritizing the ability to process and interpret big data more than ever before.
Original graphic by: Excelacom


Technology
Visualizing AI Patents by Country
See which countries have been granted the most AI patents each year, from 2012 to 2022.


Visualizing AI Patents by Country
This was originally posted on our Voronoi app. Download the app for free on iOS or Android and discover incredible data-driven charts from a variety of trusted sources.
This infographic shows the number of AI-related patents granted each year from 2010 to 2022 (latest data available). These figures come from the Center for Security and Emerging Technology (CSET), accessed via Stanford University’s 2024 AI Index Report.
From this data, we can see that China first overtook the U.S. in 2013. Since then, the country has seen enormous growth in the number of AI patents granted each year.
| Year | China | EU and UK | U.S. | RoW | Global Total |
|---|---|---|---|---|---|
| 2010 | 307 | 137 | 984 | 571 | 1,999 |
| 2011 | 516 | 129 | 980 | 581 | 2,206 |
| 2012 | 926 | 112 | 950 | 660 | 2,648 |
| 2013 | 1,035 | 91 | 970 | 627 | 2,723 |
| 2014 | 1,278 | 97 | 1,078 | 667 | 3,120 |
| 2015 | 1,721 | 110 | 1,135 | 539 | 3,505 |
| 2016 | 1,621 | 128 | 1,298 | 714 | 3,761 |
| 2017 | 2,428 | 144 | 1,489 | 1,075 | 5,136 |
| 2018 | 4,741 | 155 | 1,674 | 1,574 | 8,144 |
| 2019 | 9,530 | 322 | 3,211 | 2,720 | 15,783 |
| 2020 | 13,071 | 406 | 5,441 | 4,455 | 23,373 |
| 2021 | 21,907 | 623 | 8,219 | 7,519 | 38,268 |
| 2022 | 35,315 | 1,173 | 12,077 | 13,699 | 62,264 |
In 2022, China was granted more patents than every other country combined.
While this suggests that the country is very active in researching the field of artificial intelligence, it doesn’t necessarily mean that China is the farthest in terms of capability.
Key Facts About AI Patents
According to CSET, AI patents relate to mathematical relationships and algorithms, which are considered abstract ideas under patent law. They can also have different meaning, depending on where they are filed.
In the U.S., AI patenting is concentrated amongst large companies including IBM, Microsoft, and Google. On the other hand, AI patenting in China is more distributed across government organizations, universities, and tech firms (e.g. Tencent).
In terms of focus area, China’s patents are typically related to computer vision, a field of AI that enables computers and systems to interpret visual data and inputs. Meanwhile America’s efforts are more evenly distributed across research fields.
Learn More About AI From Visual Capitalist
If you want to see more data visualizations on artificial intelligence, check out this graphic that shows which job departments will be impacted by AI the most.

-

 Mining1 week ago
Gold vs. S&P 500: Which Has Grown More Over Five Years?
-

 Markets2 weeks ago
Ranked: The Most Valuable Housing Markets in America
-

 Money2 weeks ago
Which States Have the Highest Minimum Wage in America?
-

 AI2 weeks ago
Ranked: Semiconductor Companies by Industry Revenue Share
-

 Markets2 weeks ago
Ranked: The World’s Top Flight Routes, by Revenue
-

 Countries2 weeks ago
Population Projections: The World’s 6 Largest Countries in 2075
-

 Markets2 weeks ago
The Top 10 States by Real GDP Growth in 2023
-

 Demographics2 weeks ago
The Smallest Gender Wage Gaps in OECD Countries