Markets
Walmart Nation: Mapping the Largest Employers in the U.S.
Walmart Nation: Mapping the Largest Employers in the U.S.
The Chart of the Week is a weekly Visual Capitalist feature on Fridays.
In an era where Amazon steals most of the headlines, it’s easy to forget about brick-and-mortar retailers like Walmart.
But, even though the market values the Bezos e-commerce juggernaut at about twice the sum of Walmart, the blue big-box store is very formidable in other ways. For example, revenue and earnings are two areas where Walmart still reigns supreme, and the stock just hit all-time highs yesterday on an earnings beat.
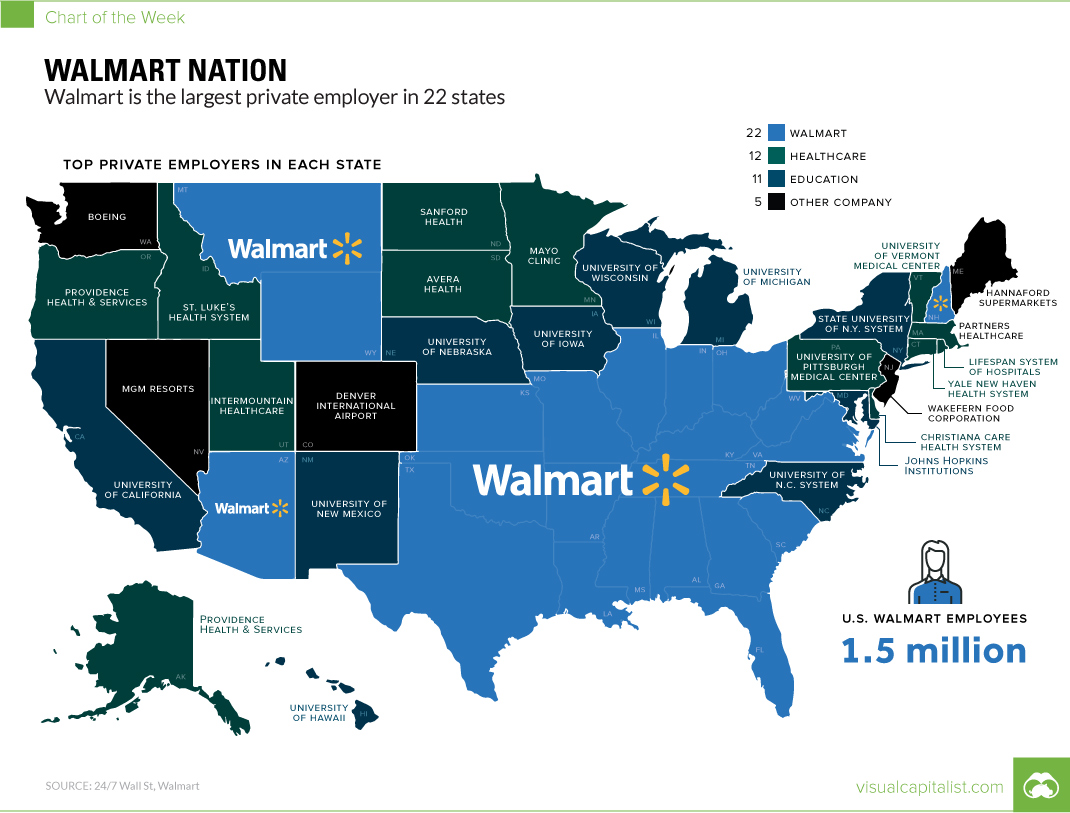
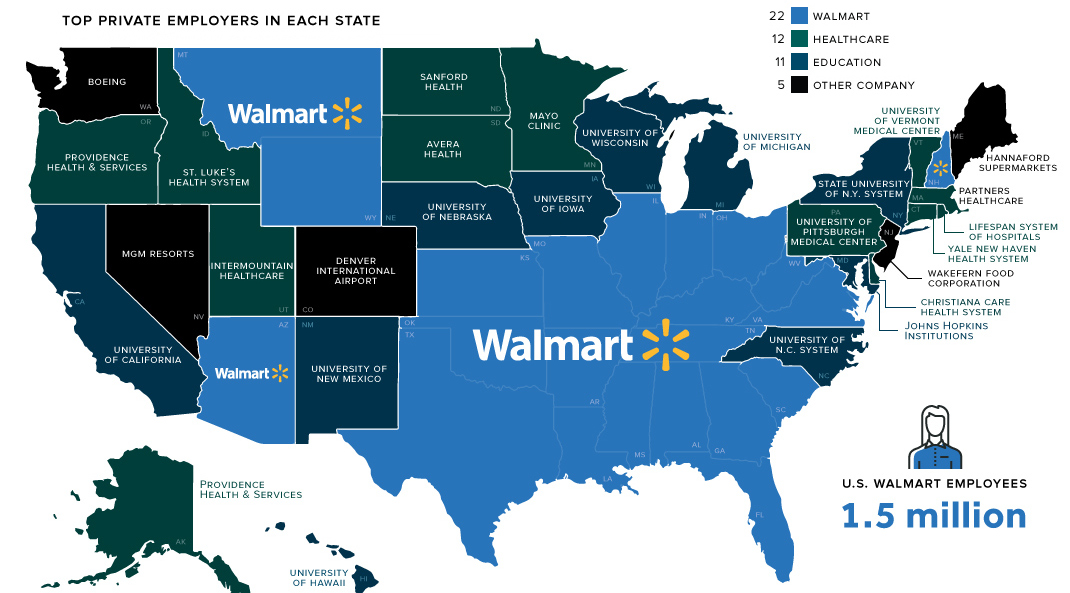
That’s not all, though. As today’s map shows, Walmart is dominant in one other notable way: the company is the biggest private employer in America in a whopping 22 states.
Wally World
Using data from 24/7 Wall Street, we mapped out the largest employer (excluding public administrative bodies, such as state governments) in each state.
Here are the states where Walmart took the title:
| State | Company | # of employees |
|---|---|---|
| Alabama | Walmart | 38,041 |
| Arizona | Walmart | 33,910 |
| Arkansas | Walmart | 53,310 |
| Florida | Walmart | 108,321 |
| Georgia | Walmart | 59,371 |
| Illinois | Walmart | 54,698 |
| Indiana | Walmart | 39,667 |
| Kansas | Walmart | 20,938 |
| Kentucky | Walmart | 30,181 |
| Louisiana | Walmart | 36,992 |
| Mississippi | Walmart | 24,898 |
| Missouri | Walmart | 43,203 |
| Montana | Walmart | 4,776 |
| New Hampshire | Walmart | 8,284 |
| Ohio | Walmart | 50,481 |
| Oklahoma | Walmart | 34,014 |
| South Carolina | Walmart | 32,267 |
| Tennessee | Walmart | 41,487 |
| Texas | Walmart | 171,531 |
| Virginia | Walmart | 44,621 |
| West Virginia | Walmart | 12,321 |
| Wyoming | Walmart | 4,699 |
The company has 1.5 million employees in the U.S. – and about 950,000 of them are in the states above.
A Southern Institution
In Walmart’s home state of Arkansas, the company employees 53,310 people, or about 4% of the non-farm work force. That includes about 18,600 jobs at the HQ in Bentonville, AR.
Despite the company’s obvious influence in the state where it was founded, Walmart is also the largest employer across the South in general. Whether it is Texas (171,531 employees) or Virginia (44,621), there are Walmarts aplenty in the states surrounding Arkansas.
One notable exception to this rule? North Carolina, where the University of North Carolina University system employs 74,079 people. However, that doesn’t mean that Walmart has zero presence in the Tar Heel State – it actually has 218 retail stores and 58,525 employees in North Carolina, according to its website.
Your Turn, Amazon
In case you may be wondering, Amazon is not the largest employer in any state – even in the company’s home state of Washington, where it still lags behind Boeing.
However, Amazon’s epic ramp-up is quickly taking over Seattle, and the company now has as much office space there as the city’s next 40 biggest employers combined.
And who knows, with over 238 bids for Amazon’s new HQ2, it’s possible that the company could be adding up to 50,000 new jobs in another state very soon.


Markets
U.S. Debt Interest Payments Reach $1 Trillion
U.S. debt interest payments have surged past the $1 trillion dollar mark, amid high interest rates and an ever-expanding debt burden.


U.S. Debt Interest Payments Reach $1 Trillion
This was originally posted on our Voronoi app. Download the app for free on iOS or Android and discover incredible data-driven charts from a variety of trusted sources.
The cost of paying for America’s national debt crossed the $1 trillion dollar mark in 2023, driven by high interest rates and a record $34 trillion mountain of debt.
Over the last decade, U.S. debt interest payments have more than doubled amid vast government spending during the pandemic crisis. As debt payments continue to soar, the Congressional Budget Office (CBO) reported that debt servicing costs surpassed defense spending for the first time ever this year.
This graphic shows the sharp rise in U.S. debt payments, based on data from the Federal Reserve.
A $1 Trillion Interest Bill, and Growing
Below, we show how U.S. debt interest payments have risen at a faster pace than at another time in modern history:
| Date | Interest Payments | U.S. National Debt |
|---|---|---|
| 2023 | $1.0T | $34.0T |
| 2022 | $830B | $31.4T |
| 2021 | $612B | $29.6T |
| 2020 | $518B | $27.7T |
| 2019 | $564B | $23.2T |
| 2018 | $571B | $22.0T |
| 2017 | $493B | $20.5T |
| 2016 | $460B | $20.0T |
| 2015 | $435B | $18.9T |
| 2014 | $442B | $18.1T |
| 2013 | $425B | $17.2T |
| 2012 | $417B | $16.4T |
| 2011 | $433B | $15.2T |
| 2010 | $400B | $14.0T |
| 2009 | $354B | $12.3T |
| 2008 | $380B | $10.7T |
| 2007 | $414B | $9.2T |
| 2006 | $387B | $8.7T |
| 2005 | $355B | $8.2T |
| 2004 | $318B | $7.6T |
| 2003 | $294B | $7.0T |
| 2002 | $298B | $6.4T |
| 2001 | $318B | $5.9T |
| 2000 | $353B | $5.7T |
| 1999 | $353B | $5.8T |
| 1998 | $360B | $5.6T |
| 1997 | $368B | $5.5T |
| 1996 | $362B | $5.3T |
| 1995 | $357B | $5.0T |
| 1994 | $334B | $4.8T |
| 1993 | $311B | $4.5T |
| 1992 | $306B | $4.2T |
| 1991 | $308B | $3.8T |
| 1990 | $298B | $3.4T |
| 1989 | $275B | $3.0T |
| 1988 | $254B | $2.7T |
| 1987 | $240B | $2.4T |
| 1986 | $225B | $2.2T |
| 1985 | $219B | $1.9T |
| 1984 | $205B | $1.7T |
| 1983 | $176B | $1.4T |
| 1982 | $157B | $1.2T |
| 1981 | $142B | $1.0T |
| 1980 | $113B | $930.2B |
| 1979 | $96B | $845.1B |
| 1978 | $84B | $789.2B |
| 1977 | $69B | $718.9B |
| 1976 | $61B | $653.5B |
| 1975 | $55B | $576.6B |
| 1974 | $50B | $492.7B |
| 1973 | $45B | $469.1B |
| 1972 | $39B | $448.5B |
| 1971 | $36B | $424.1B |
| 1970 | $35B | $389.2B |
| 1969 | $30B | $368.2B |
| 1968 | $25B | $358.0B |
| 1967 | $23B | $344.7B |
| 1966 | $21B | $329.3B |
Interest payments represent seasonally adjusted annual rate at the end of Q4.
At current rates, the U.S. national debt is growing by a remarkable $1 trillion about every 100 days, equal to roughly $3.6 trillion per year.
As the national debt has ballooned, debt payments even exceeded Medicaid outlays in 2023—one of the government’s largest expenditures. On average, the U.S. spent more than $2 billion per day on interest costs last year. Going further, the U.S. government is projected to spend a historic $12.4 trillion on interest payments over the next decade, averaging about $37,100 per American.
Exacerbating matters is that the U.S. is running a steep deficit, which stood at $1.1 trillion for the first six months of fiscal 2024. This has accelerated due to the 43% increase in debt servicing costs along with a $31 billion dollar increase in defense spending from a year earlier. Additionally, a $30 billion increase in funding for the Federal Deposit Insurance Corporation in light of the regional banking crisis last year was a major contributor to the deficit increase.
Overall, the CBO forecasts that roughly 75% of the federal deficit’s increase will be due to interest costs by 2034.

-

 Mining2 weeks ago
Charted: The Value Gap Between the Gold Price and Gold Miners
-

 Real Estate1 week ago
Ranked: The Most Valuable Housing Markets in America
-

 Business1 week ago
Charted: Big Four Market Share by S&P 500 Audits
-

 AI1 week ago
The Stock Performance of U.S. Chipmakers So Far in 2024
-

 Misc1 week ago
Almost Every EV Stock is Down After Q1 2024
-

 Money2 weeks ago
Where Does One U.S. Tax Dollar Go?
-

 Green2 weeks ago
Ranked: Top Countries by Total Forest Loss Since 2001
-

 Real Estate2 weeks ago
Visualizing America’s Shortage of Affordable Homes