Technology
Visualizing the Unicorn Landscape in 2019
Visualizing the Unicorn Landscape in 2019
It was only six years ago that venture capitalist Aileen Lee coined the term “unicorn” to describe any privately-held startup worth $1 billion or more.
At the time, such valuations were so rare that they deserved a special name – but since then, it’s fair to say that the landscape has shifted dramatically. The startup boom intensified, and capital flowed into private companies at an unprecedented pace.
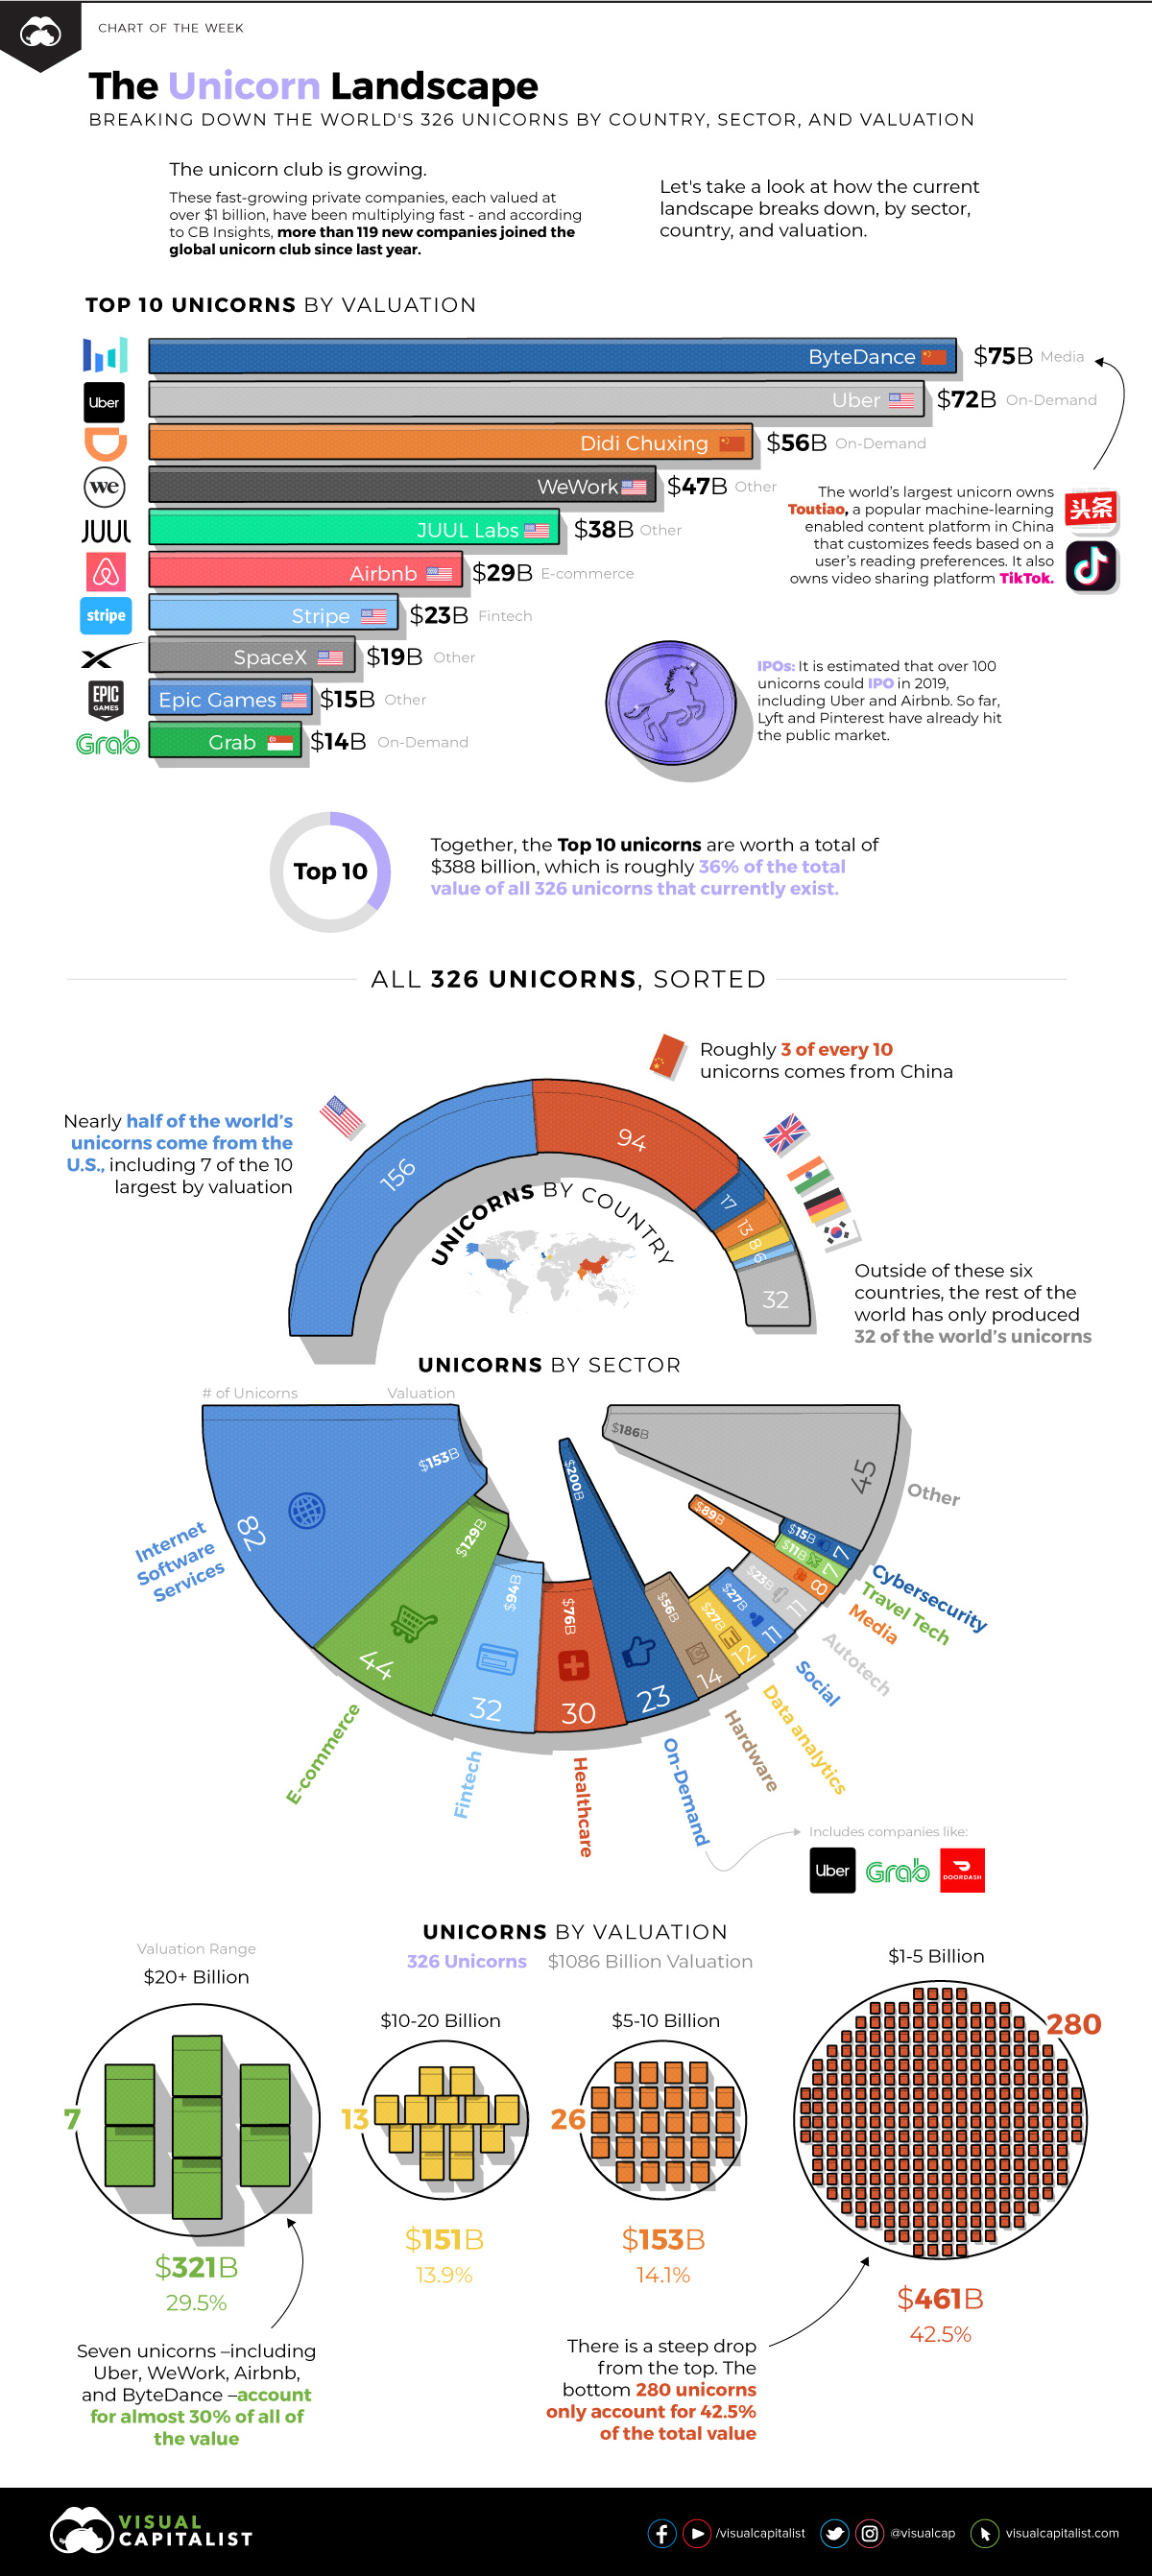
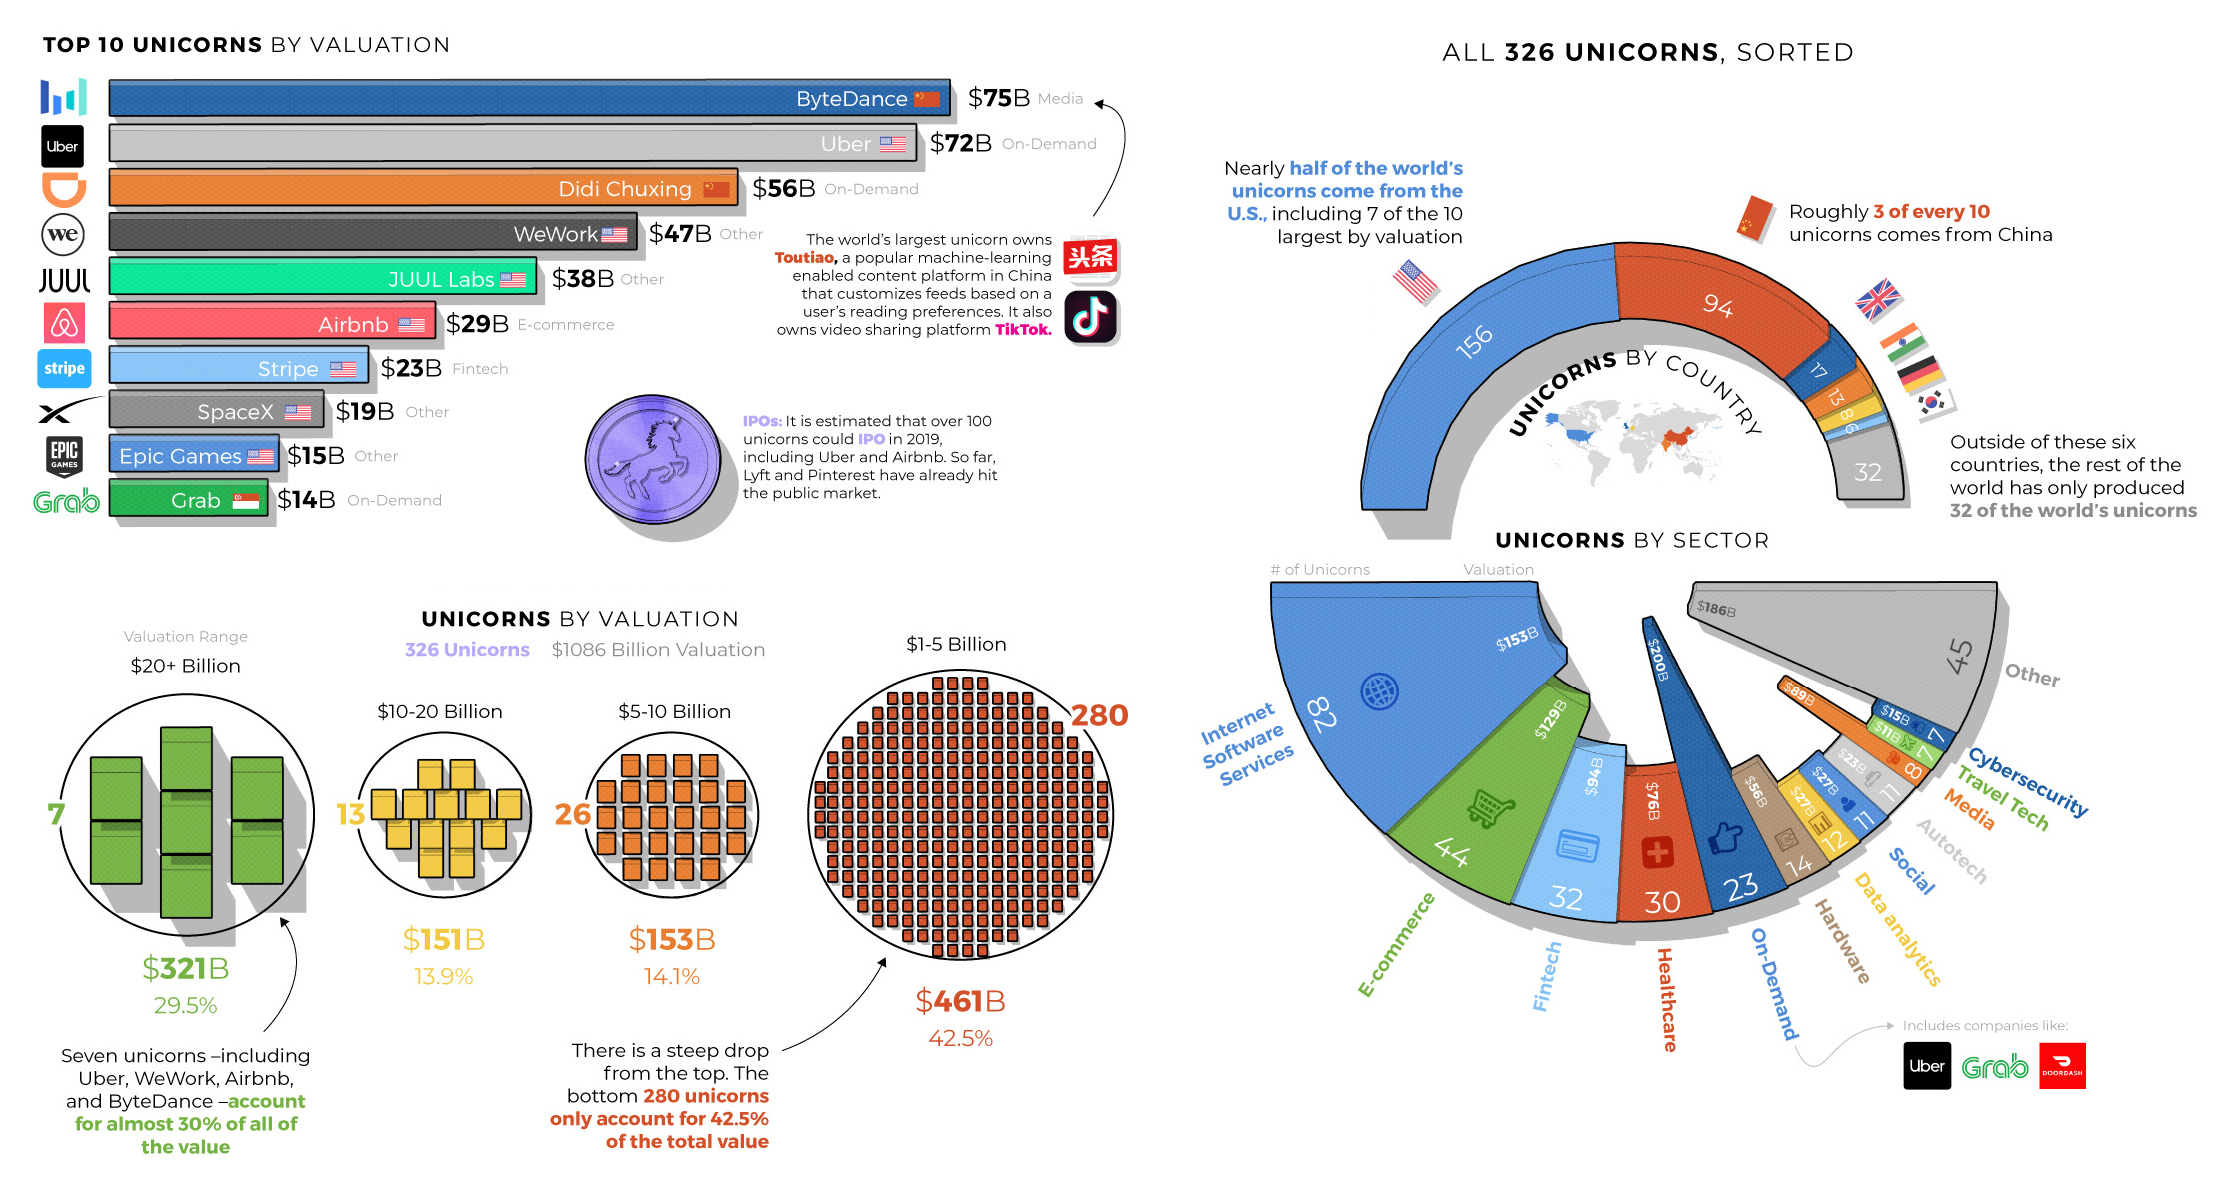
In recent times, unicorns have multiplied more like rabbits, and investors have propped up the combined value of the world’s 326 unicorns to the tune of $1.1 trillion.
Breaking down the World’s 326 Unicorns
Today’s chart uses data from the Unicorn Tracker created by CB Insights, and it breaks down the unicorn landscape by sector, valuation, and country.
Let’s start by looking at the biggest unicorns currently in existence:
| Rank | Company | Valuation ($B) | Country | Sector |
|---|---|---|---|---|
| #1 | Toutiao (ByteDance) | $75 | China | Media |
| #2 | Uber | $72 | United States | On-Demand |
| #3 | Didi Chuxing | $56 | China | On-Demand |
| #4 | WeWork | $47 | United States | Other |
| #5 | JUUL Labs | $38 | United States | Other |
| #6 | Airbnb | $29 | United States | eCommerce |
| #7 | Stripe | $23 | United States | Fintech |
| #8 | SpaceX | $19 | United States | Other |
| #9 | Epic Games | $15 | United States | Other |
| #10 | GrabTaxi | $14 | Singapore | On-Demand |
ByteDance is the world’s largest unicorn at a $75 billion valuation. The company owns Toutiao, a popular machine-learning enabled content platform in China that customizes feeds based on a user’s reading preferences. It also owns video sharing platform Tik Tok.
Experts are estimating that over 100 unicorns could IPO in 2019, including Uber and Airbnb from the above list.
So far this year, Lyft and Pinterest have already hit the public market – and another recent unicorn to IPO was conferencing platform Zoom Video, which has seen shares increase 120% in price since its impressive mid-April debut.
Unicorns by Sector
The two most common sectors for unicorns are Internet Software Services and E-commerce.
| Sector | # of Unicorns | Valuation ($B) |
|---|---|---|
| Internet Software Services | 82 | $153 |
| e-commerce | 44 | $129 |
| Fintech | 32 | $94 |
| Healthcare | 30 | $76 |
| On Demand | 23 | $200 |
| Hardware | 14 | $56 |
| Data analytics | 12 | $27 |
| Social | 11 | $27 |
| Autotech | 11 | $23 |
| Media | 8 | $89 |
| Travel Tech | 7 | $11 |
| Cybersecurity | 7 | $15 |
| Other | 45 | $186 |
| Total | 326 | $1,086 billion |
However, as you can see, the segment most valued by investors is On-Demand, which includes companies like Uber, Didi Chuxing, and DoorDash.
Unicorns by Geography
Nearly half of the world’s unicorns come from the U.S., but China also has an impressive roster of highly valued startups.
| Country | # of Unicorns | % |
|---|---|---|
| USA | 156 | 47.9% |
| China | 94 | 28.8% |
| UK | 17 | 5.2% |
| India | 13 | 4.0% |
| Germany | 8 | 2.5% |
| South Korea | 6 | 1.8% |
| Rest of World | 32 | 9.8% |
| Total | 326 |
Strangely, outside of the six major countries listed above, the rest of the world only combines for a measly 32 unicorns – less than 10% of the global total.
Unicorns by Valuation
Seven unicorns – including Uber, WeWork, Airbnb, and ByteDance – account for almost 30% of all of the value of the entire landscape.
| Valuation Range | # of Unicorns | Value ($B) | % of Value |
|---|---|---|---|
| $20+ billion | 7 | $321 | 29.5% |
| $10-20 billion | 13 | $151 | 13.9% |
| $5-10 billion | 26 | $153 | 14.1% |
| $1-5 billion | 280 | $461 | 42.5% |
| Total | 326 | $1,086 |
The bottom of the pyramid ($1-5 billion in valuation) holds 280 companies. Added together, they are worth $461 billion, which is equal to 42.5% of the unicorn total.


Technology
Ranked: Semiconductor Companies by Industry Revenue Share
Nvidia is coming for Intel’s crown. Samsung is losing ground. AI is transforming the space. We break down revenue for semiconductor companies.


Semiconductor Companies by Industry Revenue Share
This was originally posted on our Voronoi app. Download the app for free on Apple or Android and discover incredible data-driven charts from a variety of trusted sources.
Did you know that some computer chips are now retailing for the price of a new BMW?
As computers invade nearly every sphere of life, so too have the chips that power them, raising the revenues of the businesses dedicated to designing them.
But how did various chipmakers measure against each other last year?
We rank the biggest semiconductor companies by their percentage share of the industry’s revenues in 2023, using data from Omdia research.
Which Chip Company Made the Most Money in 2023?
Market leader and industry-defining veteran Intel still holds the crown for the most revenue in the sector, crossing $50 billion in 2023, or 10% of the broader industry’s topline.
All is not well at Intel, however, with the company’s stock price down over 20% year-to-date after it revealed billion-dollar losses in its foundry business.
| Rank | Company | 2023 Revenue | % of Industry Revenue |
|---|---|---|---|
| 1 | Intel | $51B | 9.4% |
| 2 | NVIDIA | $49B | 9.0% |
| 3 | Samsung Electronics | $44B | 8.1% |
| 4 | Qualcomm | $31B | 5.7% |
| 5 | Broadcom | $28B | 5.2% |
| 6 | SK Hynix | $24B | 4.4% |
| 7 | AMD | $22B | 4.1% |
| 8 | Apple | $19B | 3.4% |
| 9 | Infineon Tech | $17B | 3.2% |
| 10 | STMicroelectronics | $17B | 3.2% |
| 11 | Texas Instruments | $17B | 3.1% |
| 12 | Micron Technology | $16B | 2.9% |
| 13 | MediaTek | $14B | 2.6% |
| 14 | NXP | $13B | 2.4% |
| 15 | Analog Devices | $12B | 2.2% |
| 16 | Renesas Electronics Corporation | $11B | 1.9% |
| 17 | Sony Semiconductor Solutions Corporation | $10B | 1.9% |
| 18 | Microchip Technology | $8B | 1.5% |
| 19 | Onsemi | $8B | 1.4% |
| 20 | KIOXIA Corporation | $7B | 1.3% |
| N/A | Others | $126B | 23.2% |
| N/A | Total | $545B | 100% |
Note: Figures are rounded. Totals and percentages may not sum to 100.
Meanwhile, Nvidia is very close to overtaking Intel, after declaring $49 billion of topline revenue for 2023. This is more than double its 2022 revenue ($21 billion), increasing its share of industry revenues to 9%.
Nvidia’s meteoric rise has gotten a huge thumbs-up from investors. It became a trillion dollar stock last year, and broke the single-day gain record for market capitalization this year.
Other chipmakers haven’t been as successful. Out of the top 20 semiconductor companies by revenue, 12 did not match their 2022 revenues, including big names like Intel, Samsung, and AMD.
The Many Different Types of Chipmakers
All of these companies may belong to the same industry, but they don’t focus on the same niche.
According to Investopedia, there are four major types of chips, depending on their functionality: microprocessors, memory chips, standard chips, and complex systems on a chip.
Nvidia’s core business was once GPUs for computers (graphics processing units), but in recent years this has drastically shifted towards microprocessors for analytics and AI.
These specialized chips seem to be where the majority of growth is occurring within the sector. For example, companies that are largely in the memory segment—Samsung, SK Hynix, and Micron Technology—saw peak revenues in the mid-2010s.

-
 Money2 weeks ago
Visualizing the Growth of $100, by Asset Class (1970-2023)
-

 Money1 week ago
Where Does One U.S. Tax Dollar Go?
-

 Green2 weeks ago
Ranked: Top Countries by Total Forest Loss Since 2001
-

 Real Estate2 weeks ago
Visualizing America’s Shortage of Affordable Homes
-

 Maps2 weeks ago
Mapped: Average Wages Across Europe
-

 Mining2 weeks ago
Charted: The Value Gap Between the Gold Price and Gold Miners
-

 Demographics2 weeks ago
Visualizing the Size of the Global Senior Population
-

 Automotive2 weeks ago
Tesla Is Once Again the World’s Best-Selling EV Company