Markets
The Movers and Shakers of the Top 500 Global Companies List
The Fortune Global 500 List is an annual ranking of the largest 500 companies by revenue worldwide. The publisher of the rankings, Fortune magazine, has recently put together an excellent interactive chart that shows how the list has changed over the last 20 years.
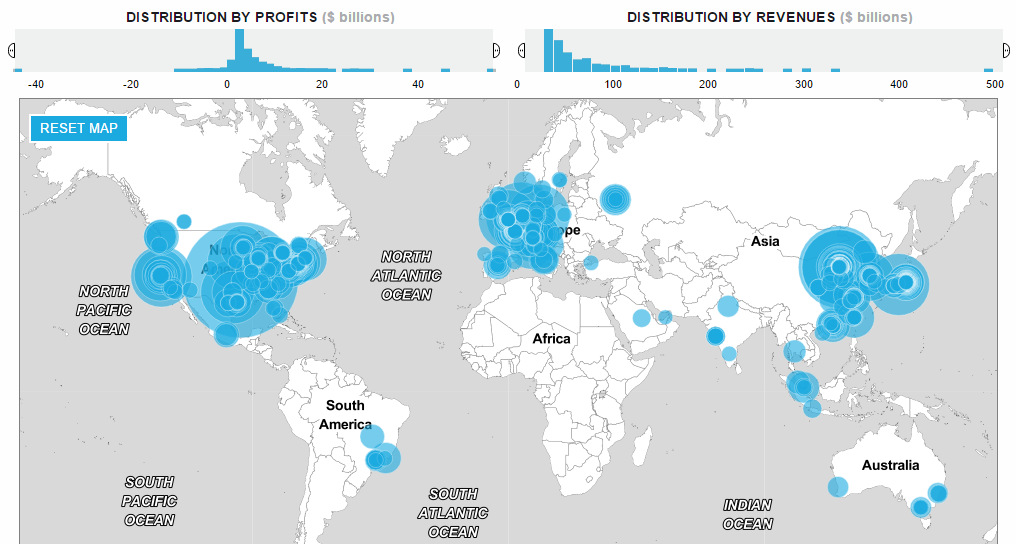
Here’s the companies on the 2016 edition mapped based on the location of their headquarters. The size of each circle is equivalent to the most recent revenue number:
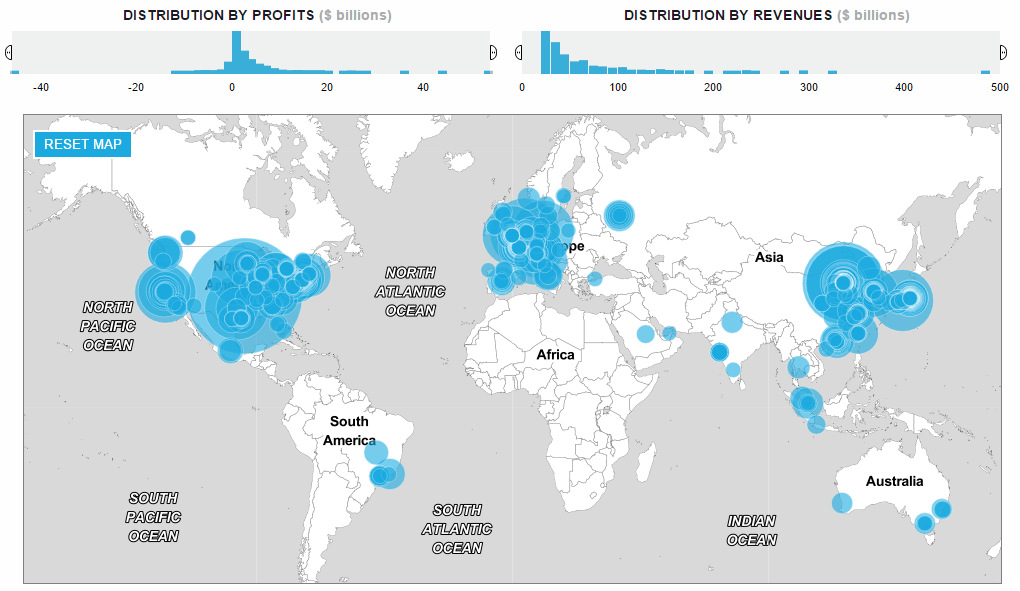
As you can see, companies are mostly concentrated in the United States, China, Japan, and the EU. Here’s the exact breakdown:
- United States: 134
- China: 103
- Japan: 52
- France: 29
- Germany: 28
- United Kingdom: 28
- South Korea: 26
- Switzerland: 15
- Netherlands: 12
- Canada: 11
- Other: 75
The biggest company by revenue? It’s Walmart, and it has a circle that takes up the whole continental United States on the map. That circle represents its annual revenues of $482 billion.
But the real question isn’t which company is the biggest – what’s much more interesting is to look at the rankings data to see what interesting stories can be told.
Movers and Shakers on the Fortune Global 500 List
How have companies on the list today performed over the last 20 years?
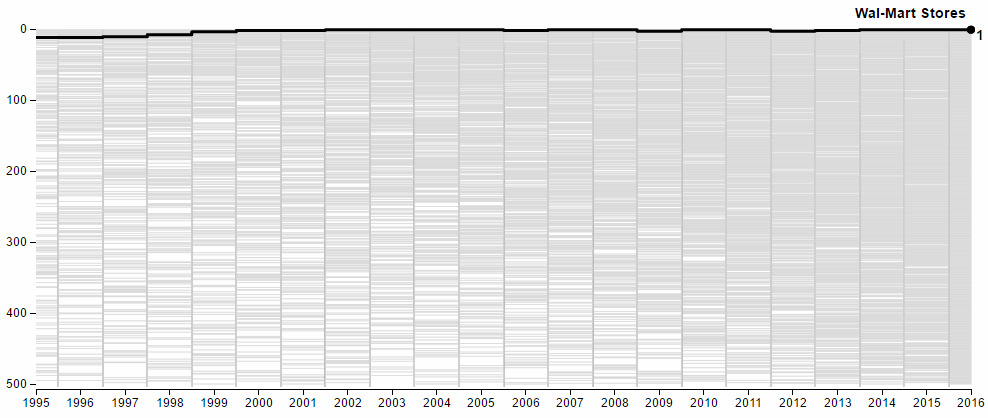
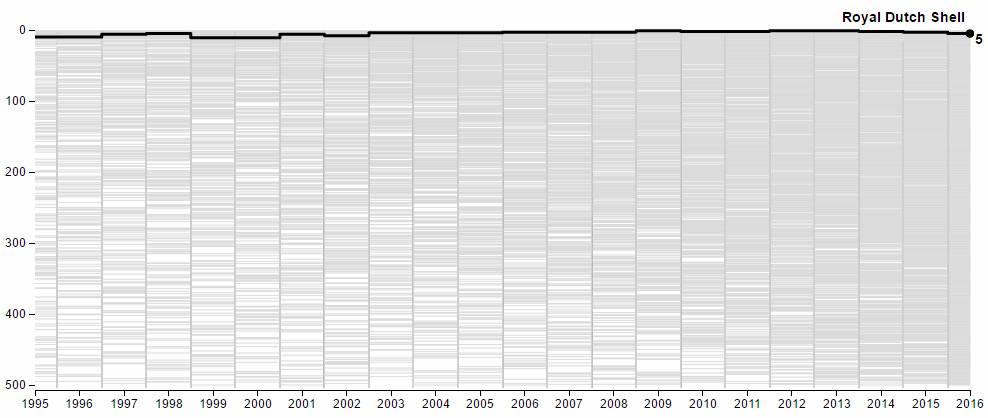
Companies such as Walmart or Royal Dutch Shell have been remarkably consistent blue chips:
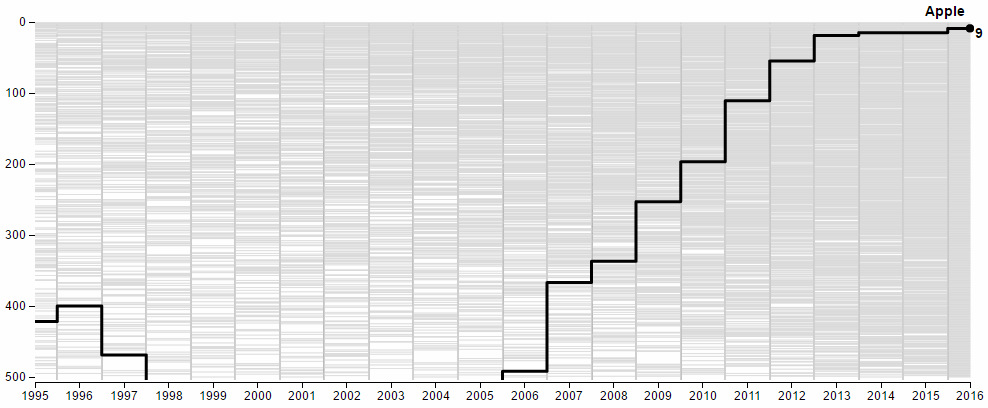
Other companies are not so consistent. They have ups and downs, and here the rankings data helps to tell their tales.
For example, you can see the “Dark Ages” of Apple in the following graph after they fired Steve Jobs. The company spent 12 years without him, and you can see that by 1997 they were almost off the Fortune Global 500 list.
Apple acquired NeXT in 1997 and Jobs would regain the title of CEO. Ten years later, the iPhone was released and the company soared back into the Top 10.
But Apple isn’t the only company that is a mover or shaker.
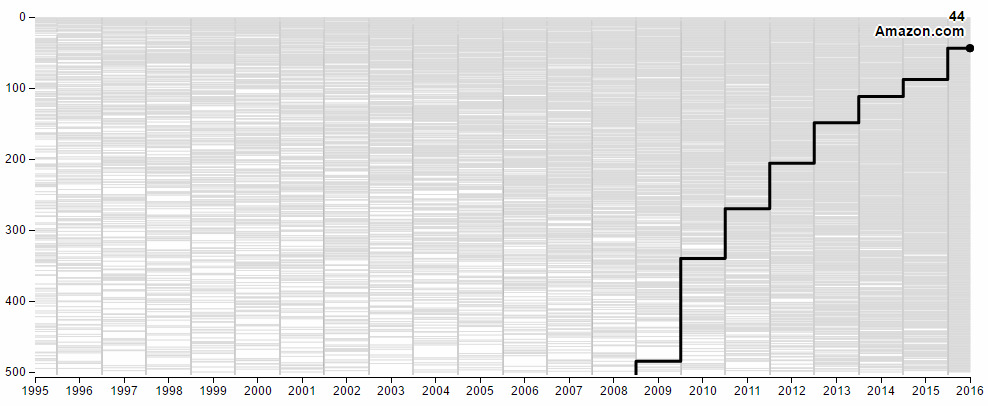
Amazon.com, of course, is also growing at a breakneck pace:
There are many newer entries on the list from China, and it seems that almost every one has a trajectory similar to this:
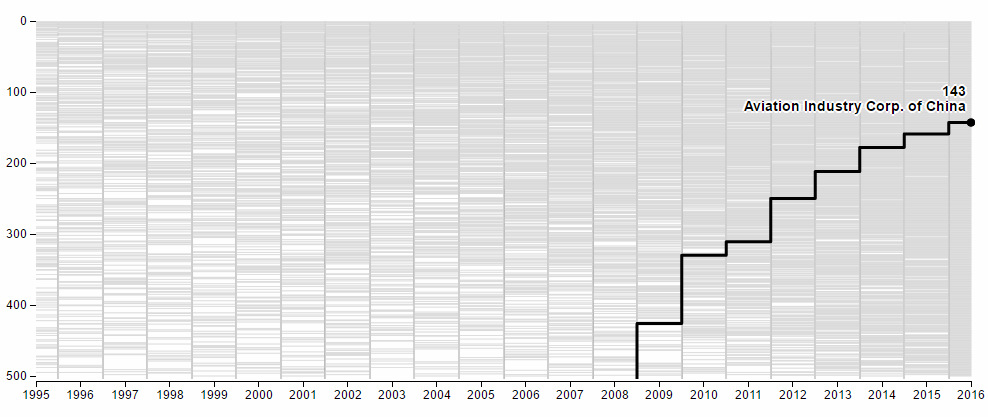
What does the state-sponsored Aviation Industry Corp. of China do, exactly?
The company’s 542,236 employees build planes – lots of planes. Particularly, they seem to build fighter jets, bombers, drones, and even entire airports.
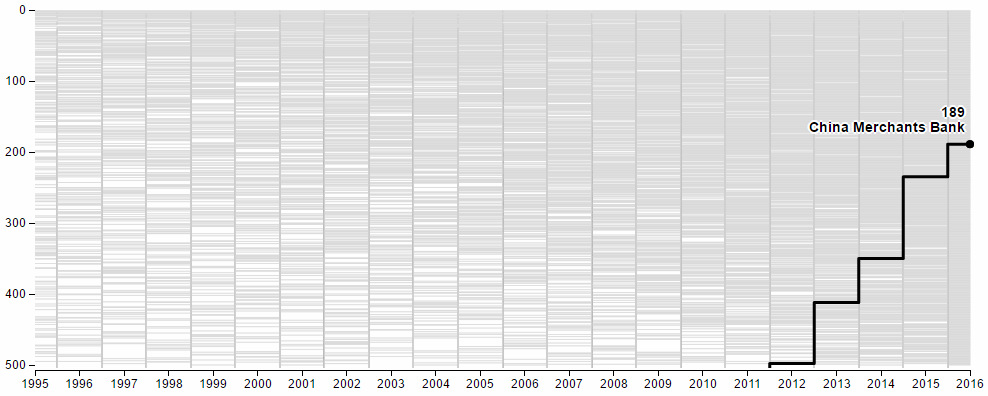
Here’s another skyrocketing Chinese company. This time it is the China Merchants Bank:
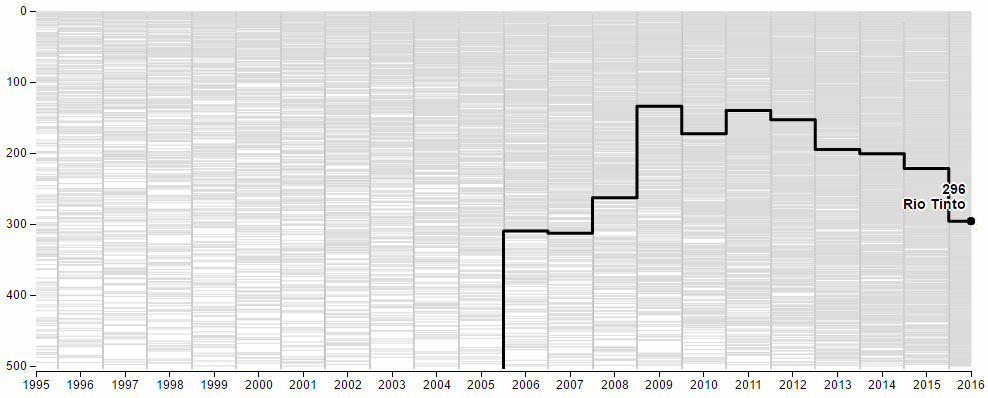
Meanwhile, the effects of the recent commodity downturn can be seen in the trajectories of companies such as Rio Tinto:
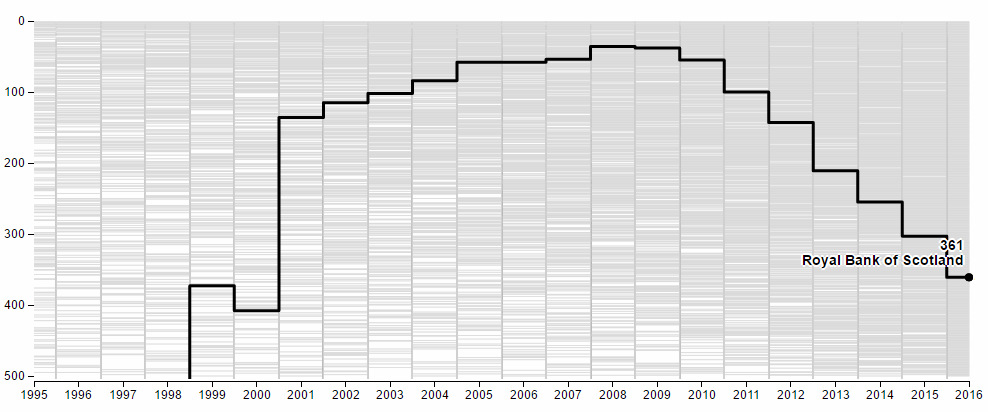
And the chart for the Royal Bank of Scotland shows how it was affected by the 2009 Financial Crisis:
If you haven’t already, we recommend checking out the full interactive piece by Fortune.


Markets
U.S. Debt Interest Payments Reach $1 Trillion
U.S. debt interest payments have surged past the $1 trillion dollar mark, amid high interest rates and an ever-expanding debt burden.


U.S. Debt Interest Payments Reach $1 Trillion
This was originally posted on our Voronoi app. Download the app for free on iOS or Android and discover incredible data-driven charts from a variety of trusted sources.
The cost of paying for America’s national debt crossed the $1 trillion dollar mark in 2023, driven by high interest rates and a record $34 trillion mountain of debt.
Over the last decade, U.S. debt interest payments have more than doubled amid vast government spending during the pandemic crisis. As debt payments continue to soar, the Congressional Budget Office (CBO) reported that debt servicing costs surpassed defense spending for the first time ever this year.
This graphic shows the sharp rise in U.S. debt payments, based on data from the Federal Reserve.
A $1 Trillion Interest Bill, and Growing
Below, we show how U.S. debt interest payments have risen at a faster pace than at another time in modern history:
| Date | Interest Payments | U.S. National Debt |
|---|---|---|
| 2023 | $1.0T | $34.0T |
| 2022 | $830B | $31.4T |
| 2021 | $612B | $29.6T |
| 2020 | $518B | $27.7T |
| 2019 | $564B | $23.2T |
| 2018 | $571B | $22.0T |
| 2017 | $493B | $20.5T |
| 2016 | $460B | $20.0T |
| 2015 | $435B | $18.9T |
| 2014 | $442B | $18.1T |
| 2013 | $425B | $17.2T |
| 2012 | $417B | $16.4T |
| 2011 | $433B | $15.2T |
| 2010 | $400B | $14.0T |
| 2009 | $354B | $12.3T |
| 2008 | $380B | $10.7T |
| 2007 | $414B | $9.2T |
| 2006 | $387B | $8.7T |
| 2005 | $355B | $8.2T |
| 2004 | $318B | $7.6T |
| 2003 | $294B | $7.0T |
| 2002 | $298B | $6.4T |
| 2001 | $318B | $5.9T |
| 2000 | $353B | $5.7T |
| 1999 | $353B | $5.8T |
| 1998 | $360B | $5.6T |
| 1997 | $368B | $5.5T |
| 1996 | $362B | $5.3T |
| 1995 | $357B | $5.0T |
| 1994 | $334B | $4.8T |
| 1993 | $311B | $4.5T |
| 1992 | $306B | $4.2T |
| 1991 | $308B | $3.8T |
| 1990 | $298B | $3.4T |
| 1989 | $275B | $3.0T |
| 1988 | $254B | $2.7T |
| 1987 | $240B | $2.4T |
| 1986 | $225B | $2.2T |
| 1985 | $219B | $1.9T |
| 1984 | $205B | $1.7T |
| 1983 | $176B | $1.4T |
| 1982 | $157B | $1.2T |
| 1981 | $142B | $1.0T |
| 1980 | $113B | $930.2B |
| 1979 | $96B | $845.1B |
| 1978 | $84B | $789.2B |
| 1977 | $69B | $718.9B |
| 1976 | $61B | $653.5B |
| 1975 | $55B | $576.6B |
| 1974 | $50B | $492.7B |
| 1973 | $45B | $469.1B |
| 1972 | $39B | $448.5B |
| 1971 | $36B | $424.1B |
| 1970 | $35B | $389.2B |
| 1969 | $30B | $368.2B |
| 1968 | $25B | $358.0B |
| 1967 | $23B | $344.7B |
| 1966 | $21B | $329.3B |
Interest payments represent seasonally adjusted annual rate at the end of Q4.
At current rates, the U.S. national debt is growing by a remarkable $1 trillion about every 100 days, equal to roughly $3.6 trillion per year.
As the national debt has ballooned, debt payments even exceeded Medicaid outlays in 2023—one of the government’s largest expenditures. On average, the U.S. spent more than $2 billion per day on interest costs last year. Going further, the U.S. government is projected to spend a historic $12.4 trillion on interest payments over the next decade, averaging about $37,100 per American.
Exacerbating matters is that the U.S. is running a steep deficit, which stood at $1.1 trillion for the first six months of fiscal 2024. This has accelerated due to the 43% increase in debt servicing costs along with a $31 billion dollar increase in defense spending from a year earlier. Additionally, a $30 billion increase in funding for the Federal Deposit Insurance Corporation in light of the regional banking crisis last year was a major contributor to the deficit increase.
Overall, the CBO forecasts that roughly 75% of the federal deficit’s increase will be due to interest costs by 2034.

-

 Maps2 weeks ago
Mapped: Average Wages Across Europe
-

 Money1 week ago
Which States Have the Highest Minimum Wage in America?
-

 Real Estate1 week ago
Ranked: The Most Valuable Housing Markets in America
-

 Markets1 week ago
Charted: Big Four Market Share by S&P 500 Audits
-

 AI1 week ago
The Stock Performance of U.S. Chipmakers So Far in 2024
-

 Automotive2 weeks ago
Almost Every EV Stock is Down After Q1 2024
-

 Money2 weeks ago
Where Does One U.S. Tax Dollar Go?
-

 Green2 weeks ago
Ranked: Top Countries by Total Forest Loss Since 2001