Technology
Visualizing the Diversity of the Tech Industry
Visualizing the Diversity of the Tech Industry
With the recent leak of the “Google Manifesto” and the maelstrom of media backlash that followed, it seems that concerns around diversity in the technology industry have finally reached a boiling point.
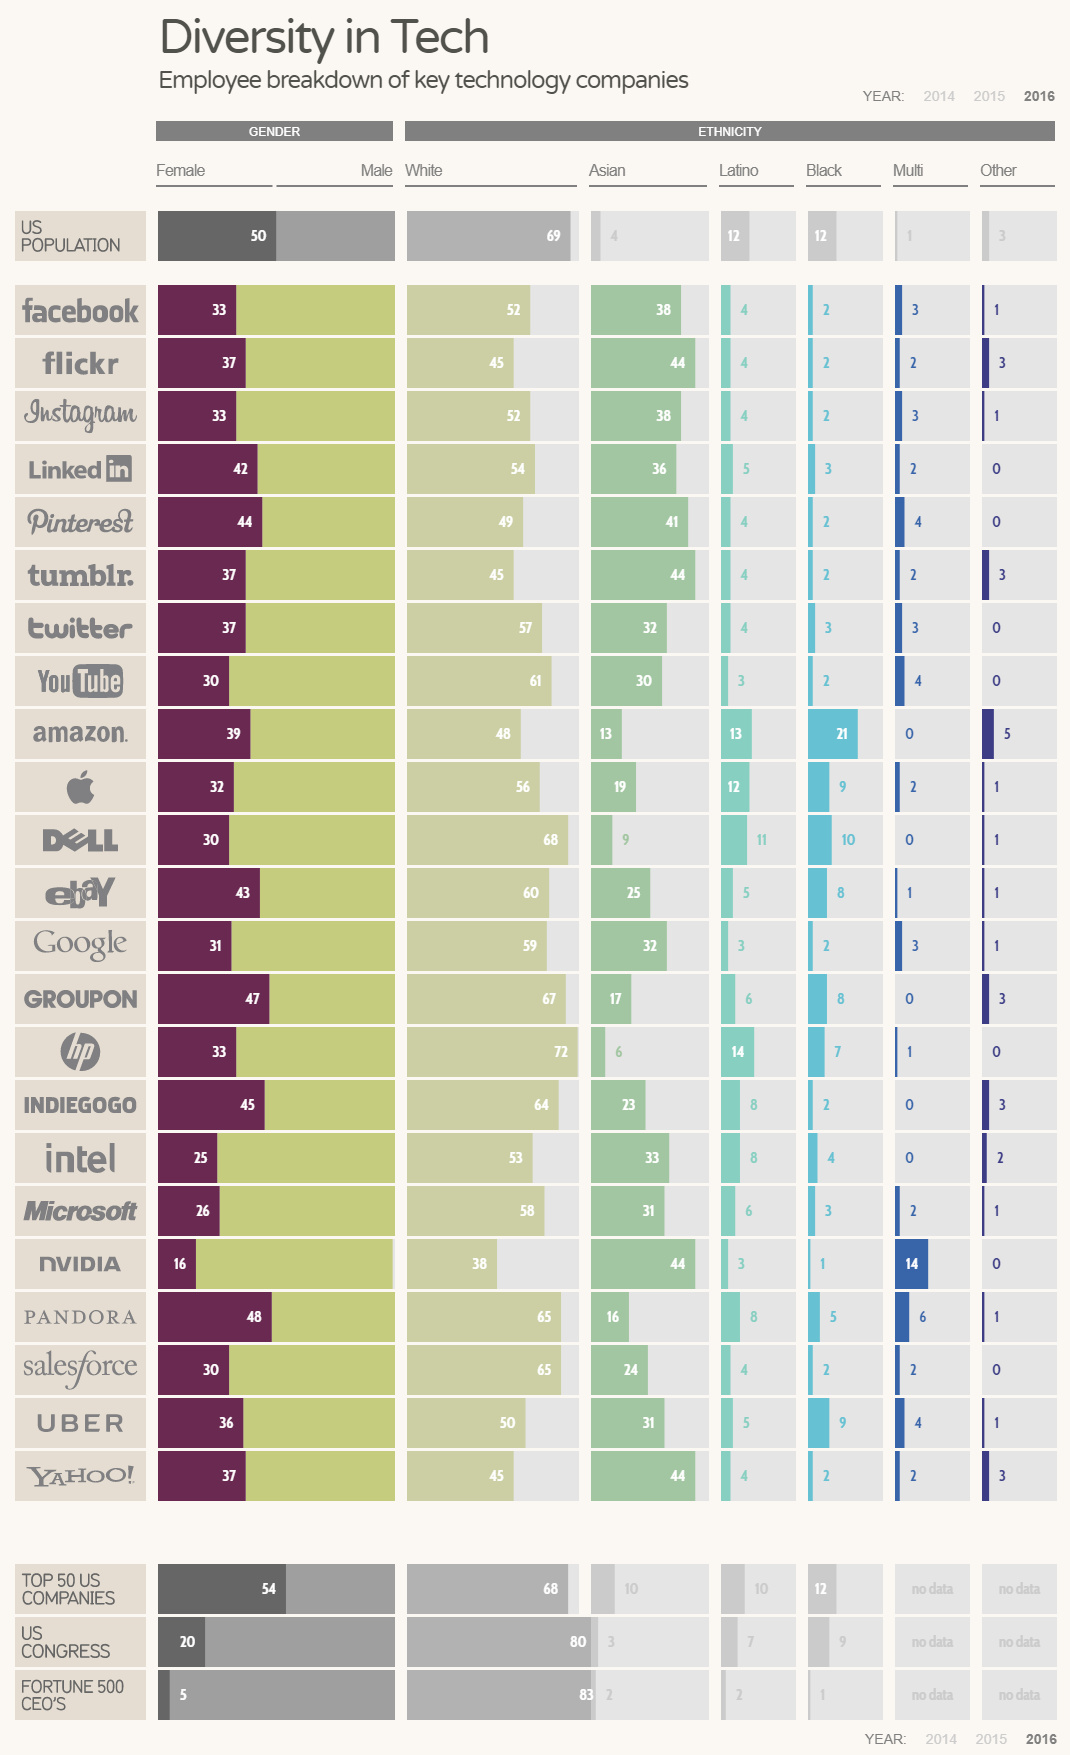
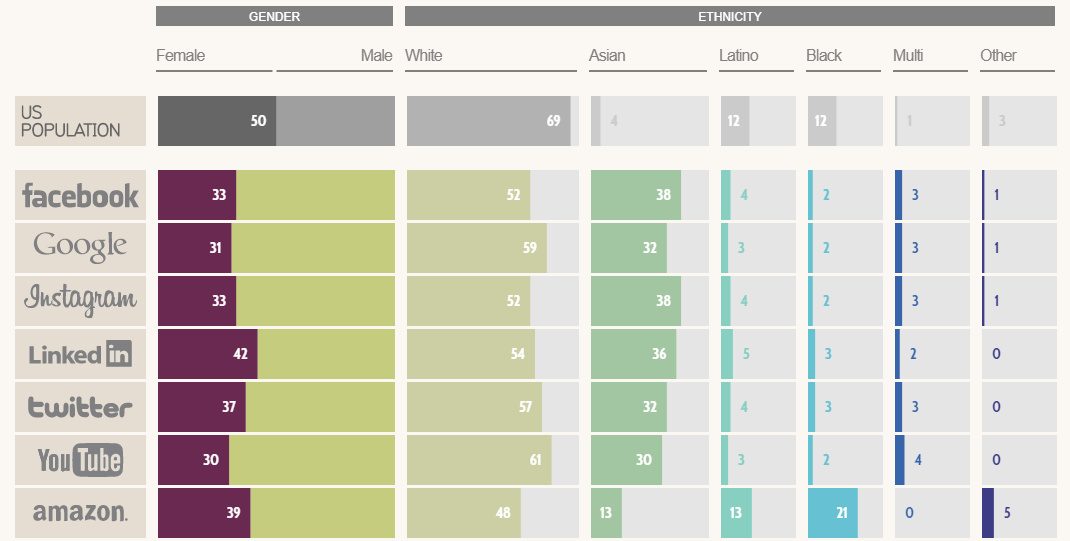
Today’s infographic from Information is Beautiful breaks down the demographics of 23 major tech companies, based on statistics from 2016. It also provides comparisons to the composition of the U.S. population in general, the top 50 U.S. companies, Congress, and Fortune 500 CEOs.
Which Companies Employ the Most Women?
With just a focus on the major companies on this list, here is a breakdown that shows which companies employ the most women:
| Rank | Tech Company | % of Females |
|---|---|---|
| #1 | Pandora | 48% |
| #2 | Groupon | 47% |
| #3 | Indiegogo | 45% |
| #4 | 44% | |
| #5 | eBay | 43% |
| U.S. Population Avg. | 50% |
The above list already illustrates why diversity is such a concern for many observers of the industry: even the companies with the most women on their rosters have proportions lower than U.S. population average of 50%.
In contrast, here are the companies on the list that employ the fewest women, as a proportion of their workforce:
| Rank | Tech Company | % of Females |
|---|---|---|
| #18 (t) | Salesforce | 30% |
| #18 (t) | Youtube | 30% |
| #18 (t) | Dell | 30% |
| #21 | Microsoft | 26% |
| #22 | Intel | 25% |
| #23 | Nvidia | 16% |
Google, which is at the center of debate right now, did not make the list of the companies with the fewest women – but it’s not far off with a workforce comprised of 31% women.
What’s Changed in the Last 12 Months?
According to Information is Beautiful, here is what has changed in the last 12 months as of their last update (April 2017):
- Facebook, Apple, eBay, and Microsoft all had their ratio of women increase by 1%.
- LinkedIn had their ratio of women increase by 3%.
- Google’s gender ratio stayed the same.
- Microsoft increased the ratio of non-white employees by 3%, and Facebook by 2%.
- Google, Apple, and eBay increased ratio of non-white employees by 1%.
- LinkedIn lost 3% of its non-white employees.
- Asian staff accounted for the majority of increases in ethnic diversity, while the ratio of Hispanic employees remained static.
To get an even better sense of the data, we recommend visiting the interactive version of Information is Beautiful’s graphic, which shows numbers for 2014 and 2015 as well.


Technology
Ranked: Semiconductor Companies by Industry Revenue Share
Nvidia is coming for Intel’s crown. Samsung is losing ground. AI is transforming the space. We break down revenue for semiconductor companies.


Semiconductor Companies by Industry Revenue Share
This was originally posted on our Voronoi app. Download the app for free on Apple or Android and discover incredible data-driven charts from a variety of trusted sources.
Did you know that some computer chips are now retailing for the price of a new BMW?
As computers invade nearly every sphere of life, so too have the chips that power them, raising the revenues of the businesses dedicated to designing them.
But how did various chipmakers measure against each other last year?
We rank the biggest semiconductor companies by their percentage share of the industry’s revenues in 2023, using data from Omdia research.
Which Chip Company Made the Most Money in 2023?
Market leader and industry-defining veteran Intel still holds the crown for the most revenue in the sector, crossing $50 billion in 2023, or 10% of the broader industry’s topline.
All is not well at Intel, however, with the company’s stock price down over 20% year-to-date after it revealed billion-dollar losses in its foundry business.
| Rank | Company | 2023 Revenue | % of Industry Revenue |
|---|---|---|---|
| 1 | Intel | $51B | 9.4% |
| 2 | NVIDIA | $49B | 9.0% |
| 3 | Samsung Electronics | $44B | 8.1% |
| 4 | Qualcomm | $31B | 5.7% |
| 5 | Broadcom | $28B | 5.2% |
| 6 | SK Hynix | $24B | 4.4% |
| 7 | AMD | $22B | 4.1% |
| 8 | Apple | $19B | 3.4% |
| 9 | Infineon Tech | $17B | 3.2% |
| 10 | STMicroelectronics | $17B | 3.2% |
| 11 | Texas Instruments | $17B | 3.1% |
| 12 | Micron Technology | $16B | 2.9% |
| 13 | MediaTek | $14B | 2.6% |
| 14 | NXP | $13B | 2.4% |
| 15 | Analog Devices | $12B | 2.2% |
| 16 | Renesas Electronics Corporation | $11B | 1.9% |
| 17 | Sony Semiconductor Solutions Corporation | $10B | 1.9% |
| 18 | Microchip Technology | $8B | 1.5% |
| 19 | Onsemi | $8B | 1.4% |
| 20 | KIOXIA Corporation | $7B | 1.3% |
| N/A | Others | $126B | 23.2% |
| N/A | Total | $545B | 100% |
Note: Figures are rounded. Totals and percentages may not sum to 100.
Meanwhile, Nvidia is very close to overtaking Intel, after declaring $49 billion of topline revenue for 2023. This is more than double its 2022 revenue ($21 billion), increasing its share of industry revenues to 9%.
Nvidia’s meteoric rise has gotten a huge thumbs-up from investors. It became a trillion dollar stock last year, and broke the single-day gain record for market capitalization this year.
Other chipmakers haven’t been as successful. Out of the top 20 semiconductor companies by revenue, 12 did not match their 2022 revenues, including big names like Intel, Samsung, and AMD.
The Many Different Types of Chipmakers
All of these companies may belong to the same industry, but they don’t focus on the same niche.
According to Investopedia, there are four major types of chips, depending on their functionality: microprocessors, memory chips, standard chips, and complex systems on a chip.
Nvidia’s core business was once GPUs for computers (graphics processing units), but in recent years this has drastically shifted towards microprocessors for analytics and AI.
These specialized chips seem to be where the majority of growth is occurring within the sector. For example, companies that are largely in the memory segment—Samsung, SK Hynix, and Micron Technology—saw peak revenues in the mid-2010s.

-

 Mining2 weeks ago
Charted: The Value Gap Between the Gold Price and Gold Miners
-

 Real Estate1 week ago
Ranked: The Most Valuable Housing Markets in America
-

 Business1 week ago
Charted: Big Four Market Share by S&P 500 Audits
-

 AI1 week ago
The Stock Performance of U.S. Chipmakers So Far in 2024
-

 Misc1 week ago
Almost Every EV Stock is Down After Q1 2024
-

 Money2 weeks ago
Where Does One U.S. Tax Dollar Go?
-

 Green2 weeks ago
Ranked: Top Countries by Total Forest Loss Since 2001
-

 Real Estate2 weeks ago
Visualizing America’s Shortage of Affordable Homes