Technology
A Visual Map of the Social Media Universe
View the full-size version of this graphic
A Stunning Visual Map of the Social Media Universe
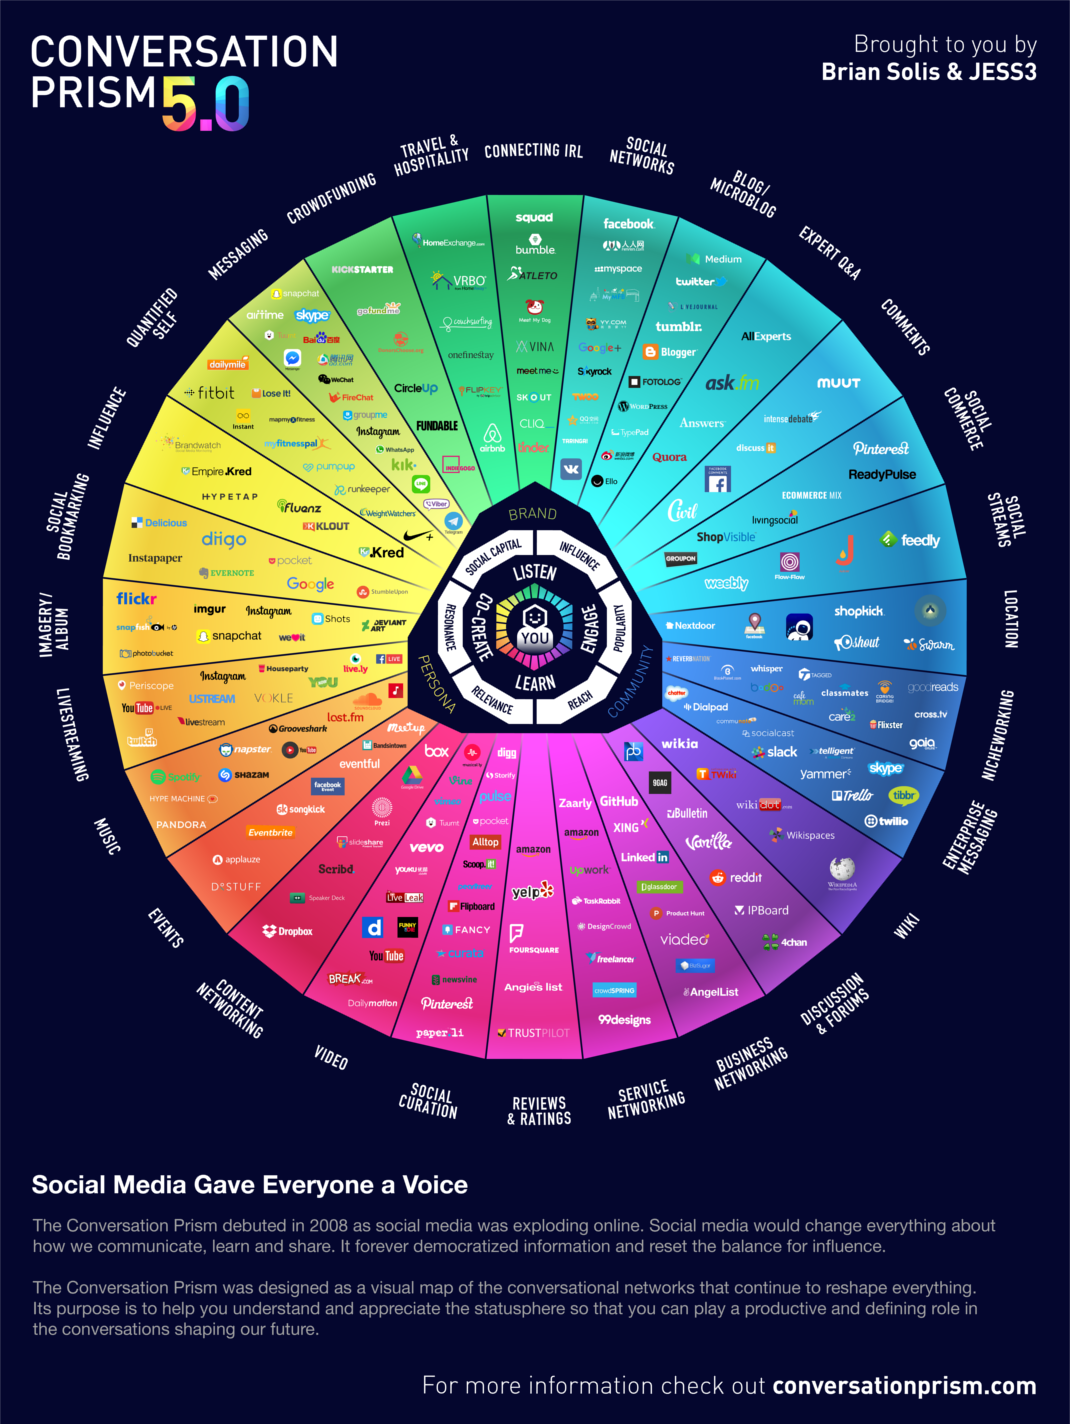
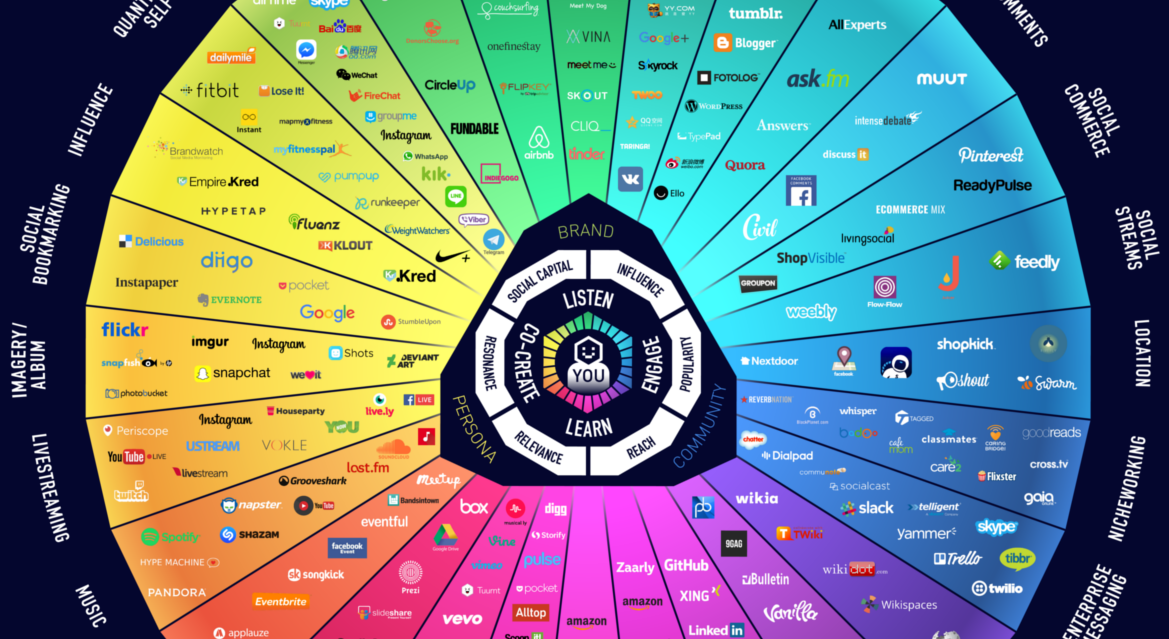
Today’s infographic comes from Brian Solis and JESS3, and it visualizes the massive social media universe of 2017. Make sure to view the full-size version of the graphic for the best experience.
It’s hard to believe that social media has emerged as such an expansive ecosystem in just the last 10 years.
The incredible growth of this social media universe can be largely attributed to the success of Facebook, which has recently hit two billion active users globally. But, of course, there are many other platforms that have helped to build the foundation as well – names like YouTube, Messenger, WhatsApp, LinkedIn, Reddit, Twitter, Snapchat, and Instagram all create a powerful base for new apps and add-ons to plug into.
As of today, entrepreneurs have been able to use this foundation to build out new branches to the social media universe that are both exciting and diverse. The apps in these niches help to facilitate workplace collaboration, live events, dating, networking, user reviews, location-based marketing, livestreaming, expert Q&As, and many other functions – and the ecosystem continues to expand and multiply by the day.
What’s Changed in Social Media?
The version of the graphic posted here today is actually the fifth rendition since the concept was first introduced in 2008.
For a trip down memory lane, here’s a copy of the version released in August 2008 as well as a link to the full-size 2008 graphic as well:
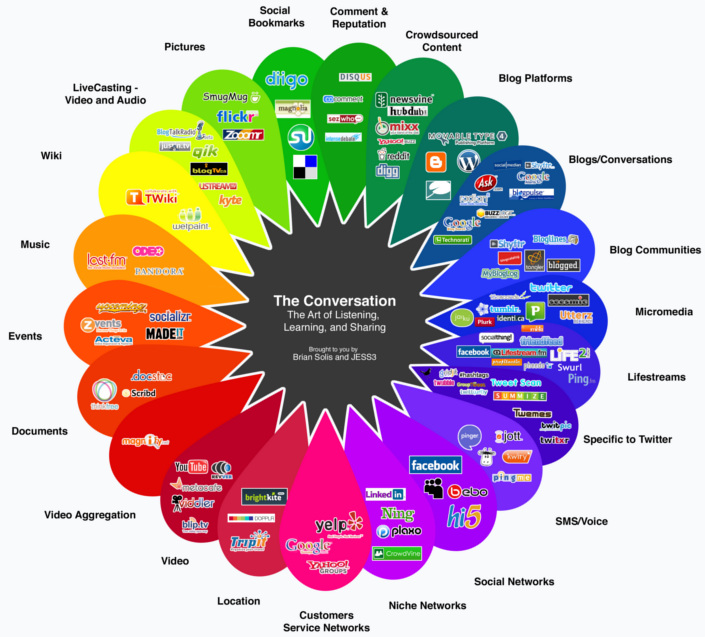
Aside from the ugly, old logos, this graphic is an interesting blast from the past. It helps us see the evolution of social media, while reminding us that new additions from the ecosystem can come into their own as huge successes.
As an example, knowing what we know today, it is almost comical that the 2008 version lists LinkedIn as a “Niche Network”. Of course, at the time, it would be hard to see that LinkedIn would eventually boast a userbase of 500 million professionals and be sold to Microsoft for $26.2 billion as the company’s biggest acquisition of all-time.
There’s also some nostalgic mentions on the list, as well: Ask.com is the remnants of the glorious Ask Jeeves search engine founded in 1996, and hi5 was a social network that was the world’s second-biggest in 2007 (after MySpace).


Technology
Ranked: Semiconductor Companies by Industry Revenue Share
Nvidia is coming for Intel’s crown. Samsung is losing ground. AI is transforming the space. We break down revenue for semiconductor companies.


Semiconductor Companies by Industry Revenue Share
This was originally posted on our Voronoi app. Download the app for free on Apple or Android and discover incredible data-driven charts from a variety of trusted sources.
Did you know that some computer chips are now retailing for the price of a new BMW?
As computers invade nearly every sphere of life, so too have the chips that power them, raising the revenues of the businesses dedicated to designing them.
But how did various chipmakers measure against each other last year?
We rank the biggest semiconductor companies by their percentage share of the industry’s revenues in 2023, using data from Omdia research.
Which Chip Company Made the Most Money in 2023?
Market leader and industry-defining veteran Intel still holds the crown for the most revenue in the sector, crossing $50 billion in 2023, or 10% of the broader industry’s topline.
All is not well at Intel, however, with the company’s stock price down over 20% year-to-date after it revealed billion-dollar losses in its foundry business.
| Rank | Company | 2023 Revenue | % of Industry Revenue |
|---|---|---|---|
| 1 | Intel | $51B | 9.4% |
| 2 | NVIDIA | $49B | 9.0% |
| 3 | Samsung Electronics | $44B | 8.1% |
| 4 | Qualcomm | $31B | 5.7% |
| 5 | Broadcom | $28B | 5.2% |
| 6 | SK Hynix | $24B | 4.4% |
| 7 | AMD | $22B | 4.1% |
| 8 | Apple | $19B | 3.4% |
| 9 | Infineon Tech | $17B | 3.2% |
| 10 | STMicroelectronics | $17B | 3.2% |
| 11 | Texas Instruments | $17B | 3.1% |
| 12 | Micron Technology | $16B | 2.9% |
| 13 | MediaTek | $14B | 2.6% |
| 14 | NXP | $13B | 2.4% |
| 15 | Analog Devices | $12B | 2.2% |
| 16 | Renesas Electronics Corporation | $11B | 1.9% |
| 17 | Sony Semiconductor Solutions Corporation | $10B | 1.9% |
| 18 | Microchip Technology | $8B | 1.5% |
| 19 | Onsemi | $8B | 1.4% |
| 20 | KIOXIA Corporation | $7B | 1.3% |
| N/A | Others | $126B | 23.2% |
| N/A | Total | $545B | 100% |
Note: Figures are rounded. Totals and percentages may not sum to 100.
Meanwhile, Nvidia is very close to overtaking Intel, after declaring $49 billion of topline revenue for 2023. This is more than double its 2022 revenue ($21 billion), increasing its share of industry revenues to 9%.
Nvidia’s meteoric rise has gotten a huge thumbs-up from investors. It became a trillion dollar stock last year, and broke the single-day gain record for market capitalization this year.
Other chipmakers haven’t been as successful. Out of the top 20 semiconductor companies by revenue, 12 did not match their 2022 revenues, including big names like Intel, Samsung, and AMD.
The Many Different Types of Chipmakers
All of these companies may belong to the same industry, but they don’t focus on the same niche.
According to Investopedia, there are four major types of chips, depending on their functionality: microprocessors, memory chips, standard chips, and complex systems on a chip.
Nvidia’s core business was once GPUs for computers (graphics processing units), but in recent years this has drastically shifted towards microprocessors for analytics and AI.
These specialized chips seem to be where the majority of growth is occurring within the sector. For example, companies that are largely in the memory segment—Samsung, SK Hynix, and Micron Technology—saw peak revenues in the mid-2010s.

-
 Money2 weeks ago
Visualizing the Growth of $100, by Asset Class (1970-2023)
-

 Money1 week ago
Where Does One U.S. Tax Dollar Go?
-

 Green2 weeks ago
Ranked: Top Countries by Total Forest Loss Since 2001
-

 Real Estate2 weeks ago
Visualizing America’s Shortage of Affordable Homes
-

 Maps2 weeks ago
Mapped: Average Wages Across Europe
-

 Mining2 weeks ago
Charted: The Value Gap Between the Gold Price and Gold Miners
-

 Demographics2 weeks ago
Visualizing the Size of the Global Senior Population
-

 Automotive2 weeks ago
Tesla Is Once Again the World’s Best-Selling EV Company