Personal Finance
Visual Capitalist Takes On Personal Finance With New Project
There’s no doubt that financial decisions have a crucial impact on our lives.
Everyone should have access to knowledge on how to save money, buy a home, make smart purchases, and build a robust portfolio of investments. This information can be dry at times, but it can also be the difference between being living month-to-month and achieving financial independence.
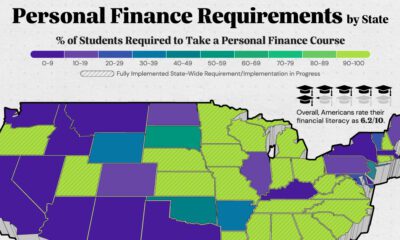
Yet statistics show that only about 16.4% of high school grads were required to take a course on personal finance, and problems go far deeper than that. Right now, financial literacy is dropping around the globe – and even worse, a record-high amount of debt is weighing younger generations down.
Introducing Wealth 101
Today we’re proud to announce our partnership with U.S. non-profit Next Gen Personal Finance, which specializes in offering free personal finance resources for teachers and students.
Together, we’ve created Wealth 101, an educational resource that will feature regular infographics on how to make responsible financial decisions:
 | About Wealth 101 Wealth 101 is the personal finance course you’ve always deserved. Using powerful infographics and data visualizations, it will be updated regularly to build out a compelling base of lessons for people of all ages and backgrounds. Wealth 101 infographics can all be accessed at http://wealth.visualcapitalist.com (These infographics will also be posted on the regular Visual Capitalist site, as well.) |
To start, here are our first two infographics for the project.
The first deals with the problem of financial literacy, while the other showcases the financial concepts that we’ll be addressing as we build out Wealth 101.
The Financial Literacy Problem
Financial literacy has been dropping for years. This giant infographic shows why that’s a problem, and what we can do to make future generations more prepared:
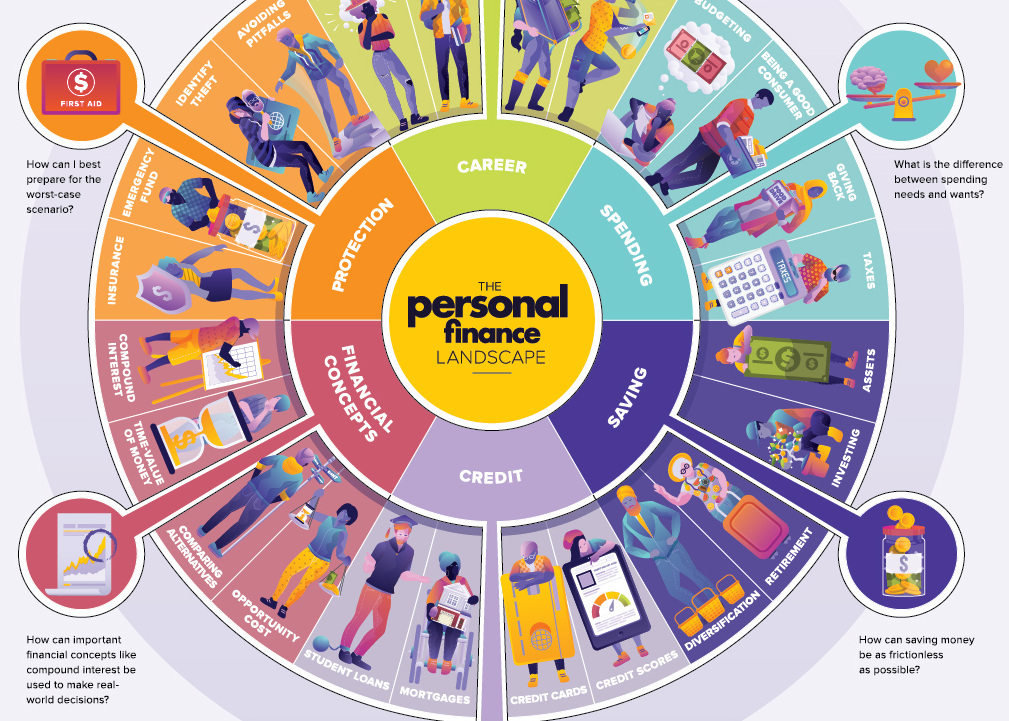
The Personal Finance Landscape
This personal finance wheel covers the most important concepts you need to know in order to gain financial independence:
Click on the above previews to see the full infographics.
Lastly, we appreciate your support as we continue to build out this resource!
Founding Partners
![]()
NGPF is a free high-school personal finance curriculum and professional development partner helping teachers deliver essential money understanding in an easy-to-grasp, engaging way.
![]()
Visual Capitalist is a leading financial media site that creates and curates enriched visual content focused on emerging trends in business and investing.


Personal Finance
Chart: The Declining Value of the U.S. Federal Minimum Wage
This graphic compares the nominal vs. inflation-adjusted value of the U.S. minimum wage, from 1940 to 2023.


The Declining Value of the U.S. Federal Minimum Wage
This was originally posted on our Voronoi app. Download the app for free on iOS or Android and discover incredible data-driven charts from a variety of trusted sources.
This graphic illustrates the history of the U.S. federal minimum wage using data compiled by Statista, in both nominal and real (inflation-adjusted) terms. The federal minimum wage was raised to $7.25 per hour in July 2009, where it has remained ever since.
Nominal vs. Real Value
The data we used to create this graphic can be found in the table below.
| Year | Nominal value ($/hour) | Real value ($/hour) |
|---|---|---|
| 1940 | 0.3 | 6.5 |
| 1945 | 0.4 | 6.82 |
| 1950 | 0.75 | 9.64 |
| 1955 | 0.75 | 8.52 |
| 1960 | 1 | 10.28 |
| 1965 | 1.25 | 12.08 |
| 1970 | 1.6 | 12.61 |
| 1975 | 2.1 | 12.04 |
| 1980 | 3.1 | 11.61 |
| 1985 | 3.35 | 9.51 |
| 1990 | 3.8 | 8.94 |
| 1995 | 4.25 | 8.49 |
| 2000 | 5.15 | 9.12 |
| 2005 | 5.15 | 8.03 |
| 2010 | 7.25 | 10.09 |
| 2015 | 7.25 | 9.3 |
| 2018 | 7.25 | 8.78 |
| 2019 | 7.25 | 8.61 |
| 2020 | 7.25 | 8.58 |
| 2021 | 7.25 | 8.24 |
| 2022 | 7.25 | 7.61 |
| 2023 | 7.25 | 7.25 |
What our graphic shows is how inflation has eroded the real value of the U.S. minimum wage over time, despite nominal increases.
For instance, consider the year 1960, when the federal minimum wage was $1 per hour. After accounting for inflation, this would be worth around $10.28 today!
The two lines converge at 2023 because the nominal and real value are identical in present day terms.
Many States Have Their Own Minimum Wage
According to the National Conference of State Legislatures (NCSL), 30 states and Washington, D.C. have implemented a minimum wage that is higher than $7.25.
The following states have adopted the federal minimum: Georgia, Idaho, Indiana, Iowa, Kansas, Kentucky, New Hampshire, North Carolina, North Dakota, Oklahoma, Pennsylvania, Texas, Utah, Wisconsin, and Wyoming.
Meanwhile, the states of Alabama, Louisiana, Mississippi, South Carolina, and Tennessee have no wage minimums, but have to follow the federal minimum.
How Does the U.S. Minimum Wage Rank Globally?
If you found this topic interesting, check out Mapped: Minimum Wage Around the World to see which countries have the highest minimum wage in monthly terms, as of January 2023.

-

 Markets1 week ago
Ranked: The Largest U.S. Corporations by Number of Employees
-

 Green3 weeks ago
Ranked: Top Countries by Total Forest Loss Since 2001
-

 Money2 weeks ago
Where Does One U.S. Tax Dollar Go?
-

 Automotive2 weeks ago
Almost Every EV Stock is Down After Q1 2024
-

 AI2 weeks ago
The Stock Performance of U.S. Chipmakers So Far in 2024
-

 Markets2 weeks ago
Charted: Big Four Market Share by S&P 500 Audits
-

 Real Estate2 weeks ago
Ranked: The Most Valuable Housing Markets in America
-

 Money2 weeks ago
Which States Have the Highest Minimum Wage in America?