Mining
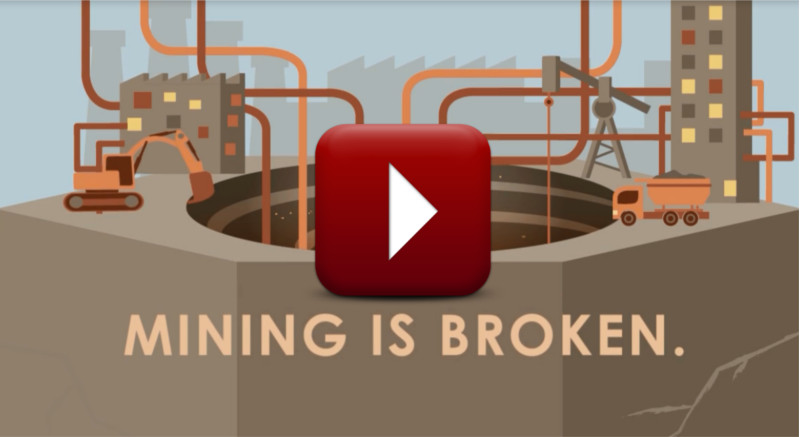
Video: A New Vision of the Mining Company of the Future
Video: A New Vision of the Mining Company of the Future
Note: this is the video version of a this previous infographic.
In 2012, a diverse group of global leaders met at the KIN Catalyst conference in Brazil. With representation from business, academia, nonprofits and government, the group convened and collaborated to discuss the look of the Mining Company of the Future.
Participation in the discussions came from a range of stakeholders. Mark Cutifani (CEO of Anglo American), Ray Offenheiser (President of Oxfam America), and Peter Bryant (Senior Fellow, Kellogg Innovation Network) all co-chaired the discussions. There was also representation from organizations such as Vale, AngloGold Ashanti, The Ford Foundation, Harvard University, Global Indigenous Solutions, and many other organizations.
Together, these different parties identified a set of priorities that could help shift the industry. The consensus was that mining needs to change proactively in order to design their own destiny – or someone or something else will.
Mining companies today face a complexity of problems: spiraling costs, government intervention, deepening pits, lower ore grades, and declining productivity are just some of the issues. Communities are not trusting mining, and this creates additional uncertainty. It is harder to find and start a mine than ever before. Combine this with today’s capital environment and struggling commodity prices, and it creates a very difficult picture.
Since the KIN Catalyst conference in 2012, the working group has developed a much more extensive framework for mining companies, called the Development Partner Framework (DPF). This framework is outlined in the above infographic. If you are looking to get involved, the organization can be contacted at [email protected]
For more information on the KIN Catalyst: Mining Company of the Future at the Kellogg Innovation Network, visit the website: https://www.kinglobal.org/catalyst.php
What do you think? Is this vision possible – and what are the biggest challenges facing the industry?
Other Infographics


Mining
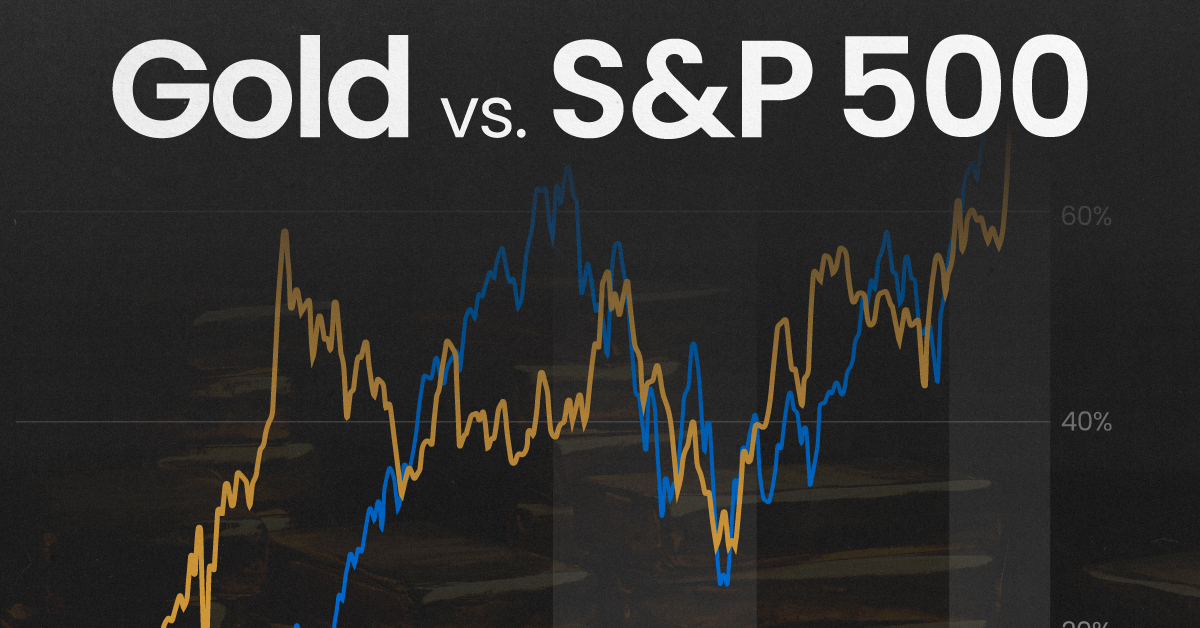
Gold vs. S&P 500: Which Has Grown More Over Five Years?
The price of gold has set record highs in 2024, but how has this precious metal performed relative to the S&P 500?

Gold vs. S&P 500: Which Has Grown More Over Five Years?
This was originally posted on our Voronoi app. Download the app for free on Apple or Android and discover incredible data-driven charts from a variety of trusted sources.
Gold is considered a unique asset due to its enduring value, historical significance, and application in various technologies like computers, spacecraft, and communications equipment.
Commonly regarded as a “safe haven asset”, gold is something investors typically buy to protect themselves during periods of global uncertainty and economic decline.
It is for this reason that gold has performed rather strongly in recent years, and especially in 2024. Persistent inflation combined with multiple wars has driven up demand for gold, helping it set a new all-time high of over $2,400 per ounce.
To put this into perspective, we visualized the performance of gold alongside the S&P 500. See the table below for performance figures as of April 12, 2024.
| Asset/Index | 1 Yr (%) | 5 Yr (%) |
|---|---|---|
| 🏆 Gold | +16.35 | +81.65 |
| 💼 S&P 500 | +25.21 | +76.22 |
Over the five-year period, gold has climbed an impressive 81.65%, outpacing even the S&P 500.
Get Your Gold at Costco
Perhaps a sign of how high the demand for gold is becoming, wholesale giant Costco is reportedly selling up to $200 million worth of gold bars every month in the United States. The year prior, sales only amounted to $100 million per quarter.
Consumers aren’t the only ones buying gold, either. Central banks around the world have been accumulating gold in very large quantities, likely as a hedge against inflation.
According to the World Gold Council, these institutions bought 1,136 metric tons in 2022, marking the highest level since 1950. Figures for 2023 came in at 1,037 metric tons.
See More Graphics on Gold
If you’re fascinated by gold, be sure to check out more Visual Capitalist content including 200 Years of Global Gold Production, by Country or Ranked: The Largest Gold Reserves by Country.

-

 Mining2 weeks ago
Charted: The Value Gap Between the Gold Price and Gold Miners
-

 Real Estate1 week ago
Ranked: The Most Valuable Housing Markets in America
-

 Business1 week ago
Charted: Big Four Market Share by S&P 500 Audits
-

 AI1 week ago
The Stock Performance of U.S. Chipmakers So Far in 2024
-

 Misc1 week ago
Almost Every EV Stock is Down After Q1 2024
-

 Money2 weeks ago
Where Does One U.S. Tax Dollar Go?
-

 Green2 weeks ago
Ranked: Top Countries by Total Forest Loss Since 2001
-

 Real Estate2 weeks ago
Visualizing America’s Shortage of Affordable Homes