Markets
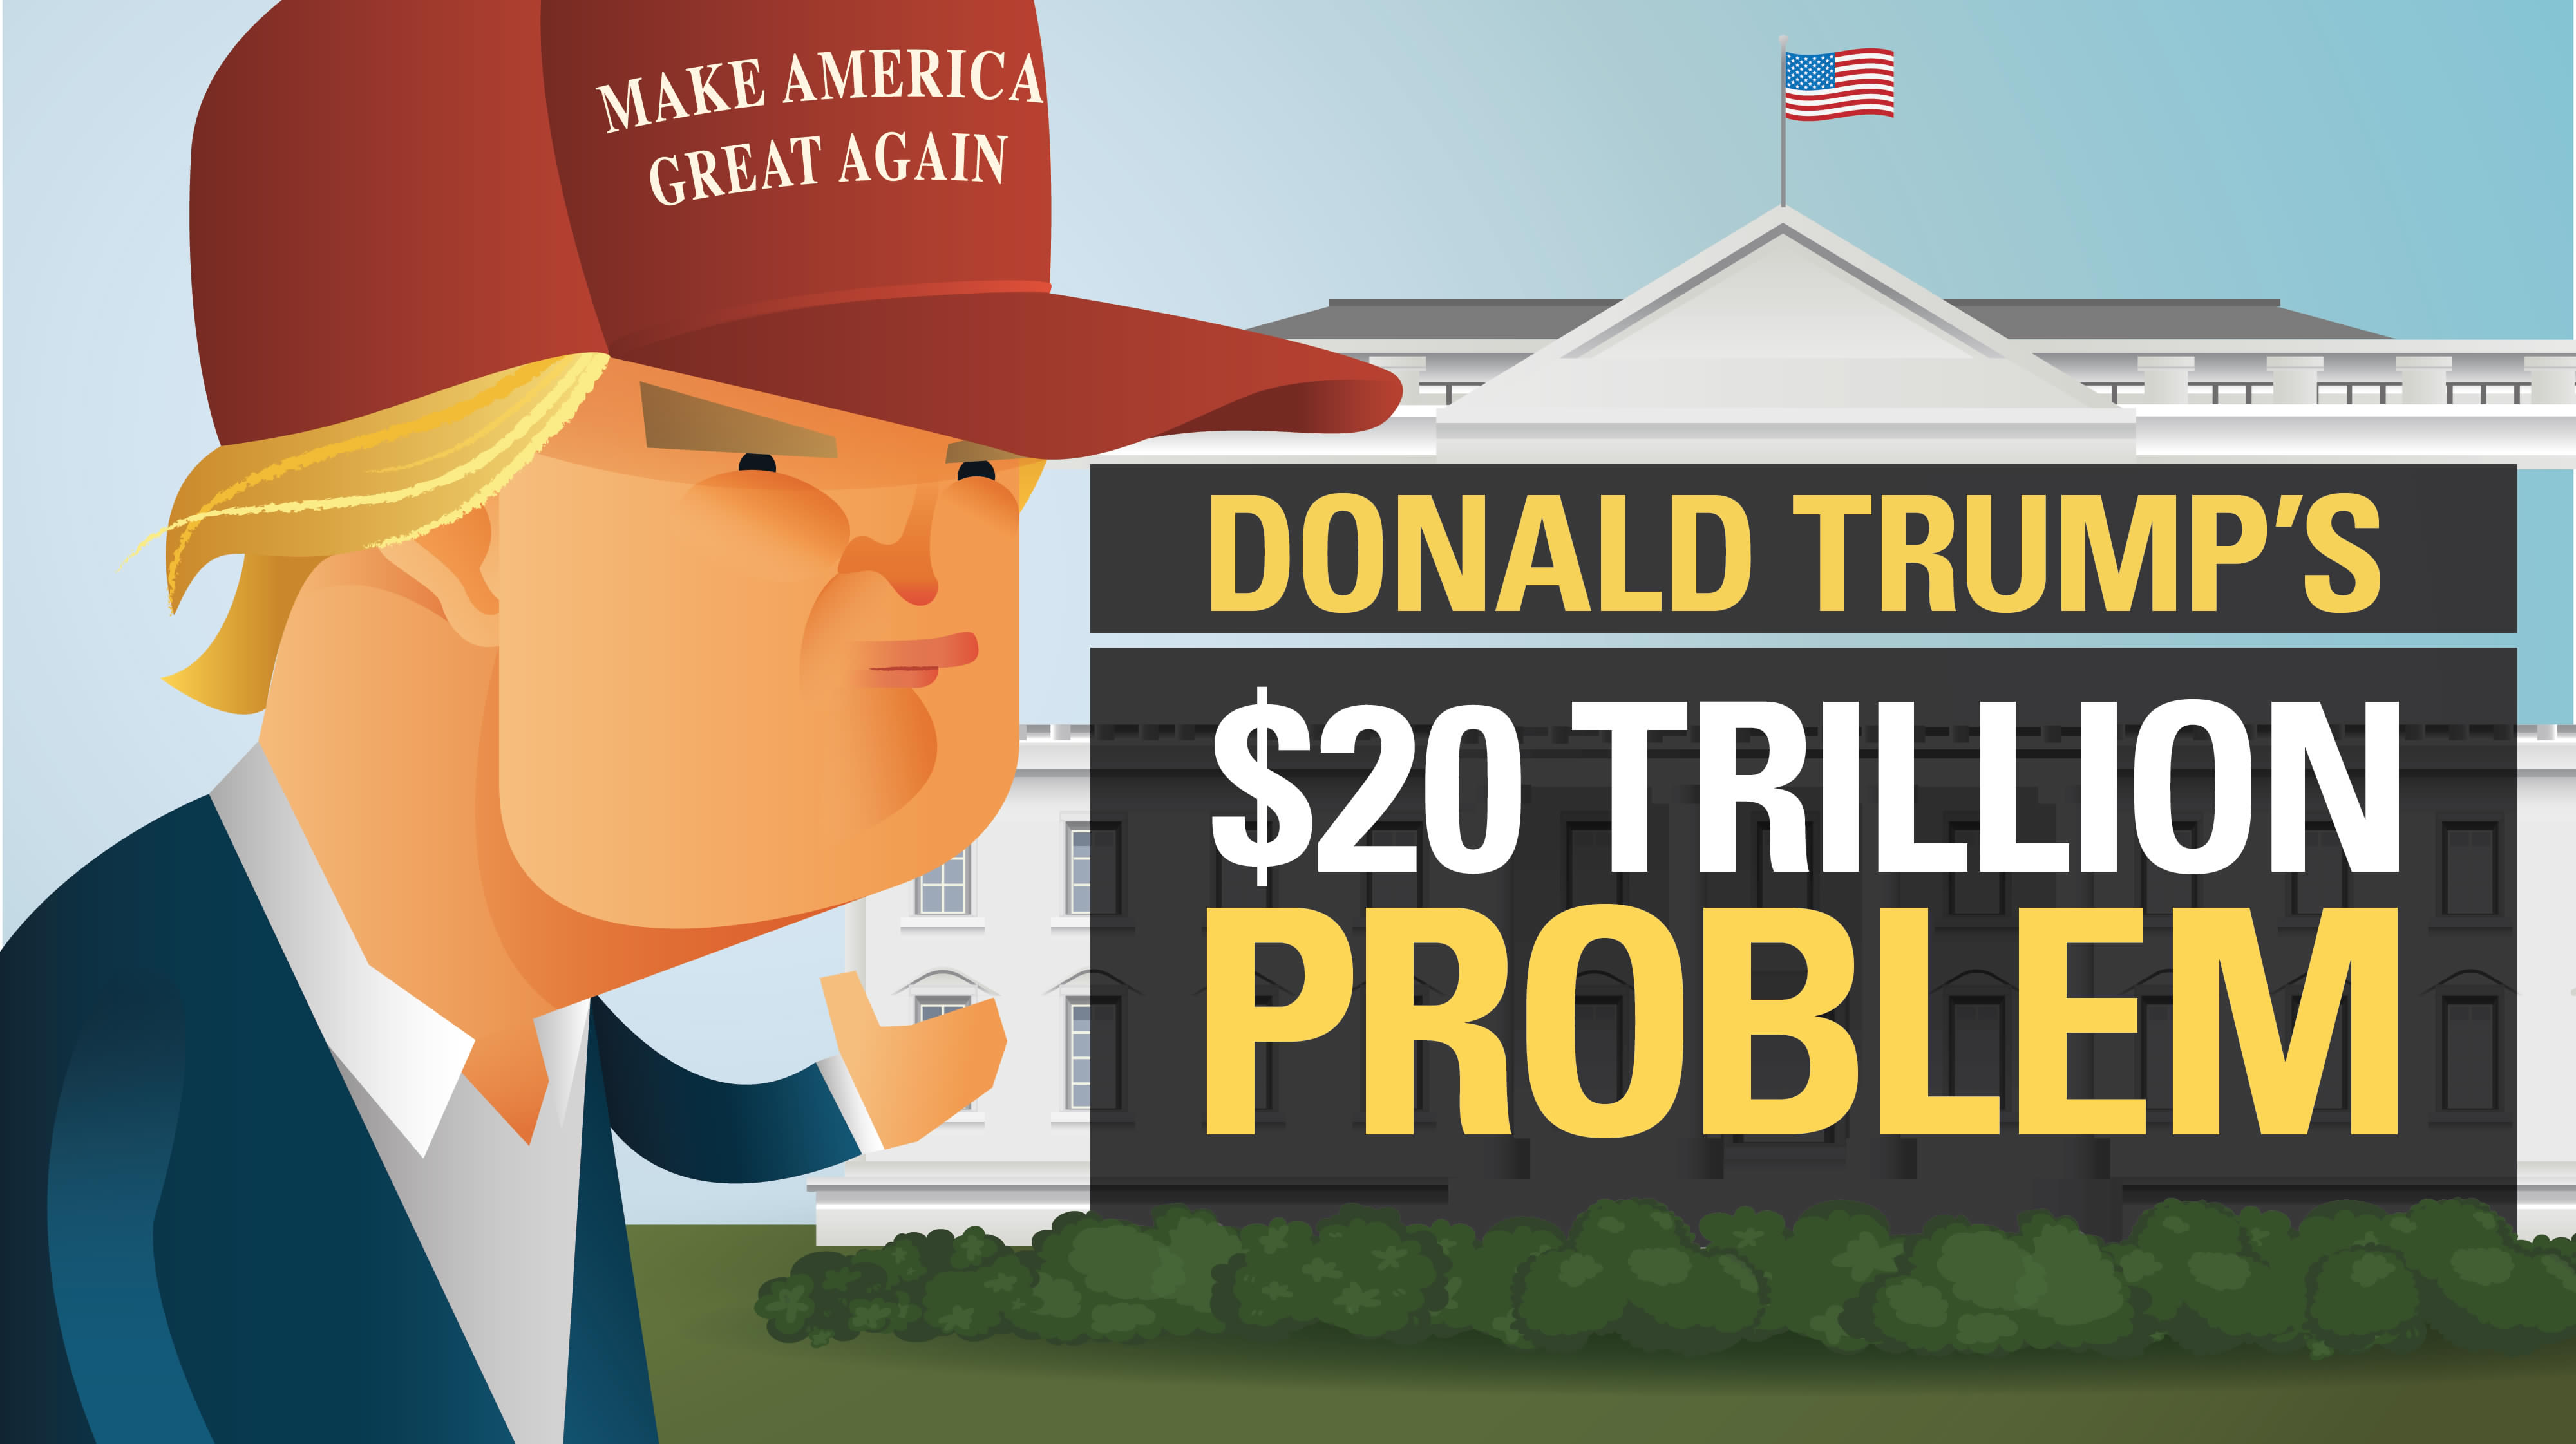
Video: Donald Trump’s $20 Trillion Problem
Presented by: 
The Money Project is an ongoing collaboration between Visual Capitalist and Texas Precious Metals that seeks to use intuitive visualizations to explore the origins, nature, and use of money.
Only a few days after Trump’s inauguration ceremony, the U.S. National Debt will creep across the important psychological barrier of $20 trillion.
It’s a problem that’s been passed down to him, but it certainly puts the incoming administration in a difficult place. The debt is burdensome by pretty much any metric, and the rate of borrowing has exceeded economic growth pretty much since the late 1970s.
How Trump deals with this escalating constraint will be a deciding factor in whether his administration crashes and burns – or ends up re-positioning America for greatness.
Donald Trump’s $20 Trillion Problem
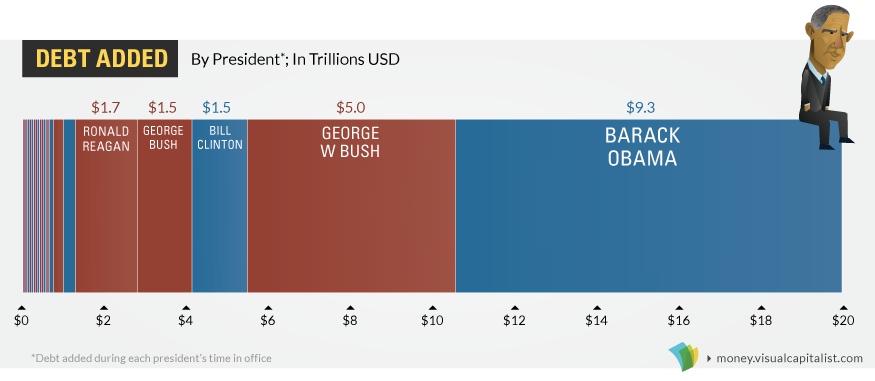
Partisans will squabble about who added what to the mounting debt, but the reality is that none of that really matters. Both parties have kicked the can down the road for the last 40 years, and that has culminated in the current situation:
Back in 1979, the debt-to-GDP ratio was a modest 31.8%, and the federal government only had an outstanding tab of $826 billion. Fast forward to today, and the perpetual borrowing has added up.
The debt-to-GDP is now 104.2%, with the total debt burden nearing the $20 trillion mark.
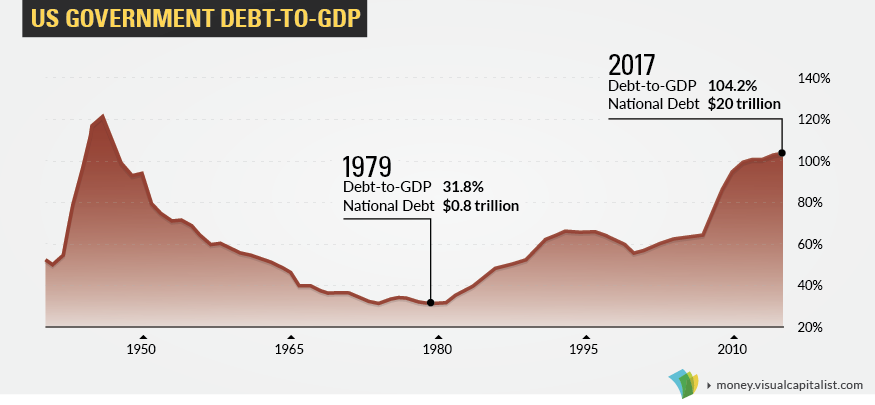
In absolute terms, the debt is the highest it has ever been. Using the common measure of debt-to-GDP, the debt is the highest it’s been in 70 years. The last time it soared past the 100% mark was during the final year of WWII.
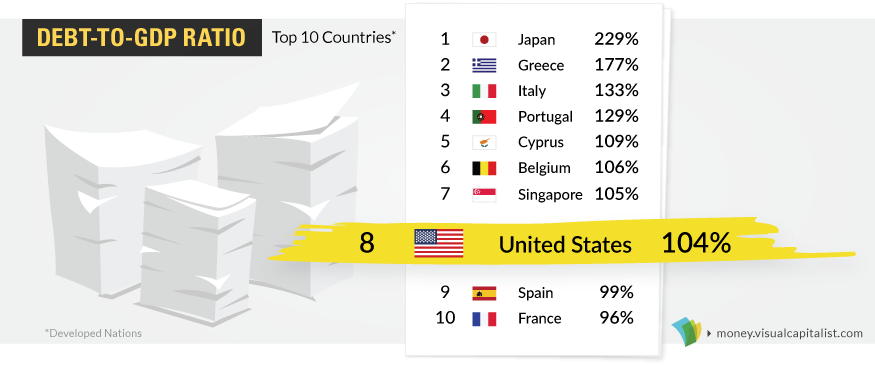
Granted, the situation isn’t as bad as Greece, Cyprus, or Japan – but it’s getting there:
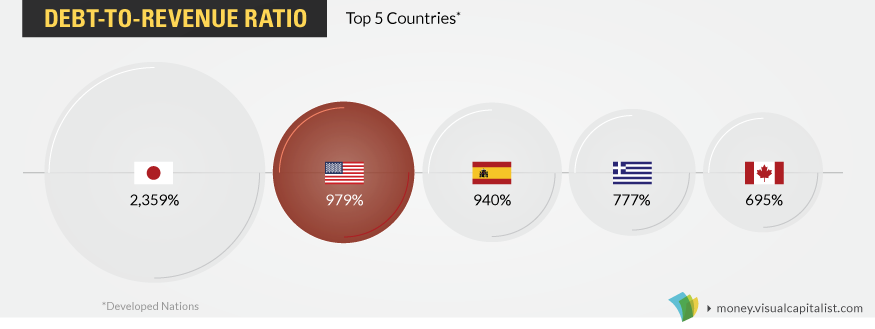
In terms of debt-to-revenue, a measure that compares the national debt to the amount of taxes taken in by the federal government, the U.S. has the 2nd highest debt out of 34 OECD countries:
On a “per person” basis, each person in the U.S. owes $61,300 – the second highest in the world. Per taxpayer, however, that amount balloons to $167,000.
Changing Rhetoric
So what does Trump think of all this debt business? It’s hard to say, because his rhetoric has changed.
At the start of his campaign, he made it clear that debt would be a top issue for his administration. In February 2016, Trump said that the U.S. was becoming a “large-scale version of Greece” and that tackling the debt would be “easy” with a more dynamic economy. In April 2016, he said he could pay off the debt after eight years in office.
This rhetoric aligns with the official GOP platform, which says that the national debt has “placed a significant burden on future generations”, calling for a “strong economy” and “spending restraint” to pay it down.
But since then, Trump’s views may have changed.
His most recent economic plans include $1 trillion in infrastructure and $5 trillion in tax cuts – and they could increase debt by anywhere from $5.3 to $11.5 trillion. He’s also said that the U.S. will never have to default because it can simply “print money”.
How Trump will choose to deal with the debt is a big question – and only time will tell if his actions will make America great again.
About the Money Project
The Money Project aims to use intuitive visualizations to explore ideas around the very concept of money itself. Founded in 2015 by Visual Capitalist and Texas Precious Metals, the Money Project will look at the evolving nature of money, and will try to answer the difficult questions that prevent us from truly understanding the role that money plays in finance, investments, and accumulating wealth.


Markets
U.S. Debt Interest Payments Reach $1 Trillion
U.S. debt interest payments have surged past the $1 trillion dollar mark, amid high interest rates and an ever-expanding debt burden.


U.S. Debt Interest Payments Reach $1 Trillion
This was originally posted on our Voronoi app. Download the app for free on iOS or Android and discover incredible data-driven charts from a variety of trusted sources.
The cost of paying for America’s national debt crossed the $1 trillion dollar mark in 2023, driven by high interest rates and a record $34 trillion mountain of debt.
Over the last decade, U.S. debt interest payments have more than doubled amid vast government spending during the pandemic crisis. As debt payments continue to soar, the Congressional Budget Office (CBO) reported that debt servicing costs surpassed defense spending for the first time ever this year.
This graphic shows the sharp rise in U.S. debt payments, based on data from the Federal Reserve.
A $1 Trillion Interest Bill, and Growing
Below, we show how U.S. debt interest payments have risen at a faster pace than at another time in modern history:
| Date | Interest Payments | U.S. National Debt |
|---|---|---|
| 2023 | $1.0T | $34.0T |
| 2022 | $830B | $31.4T |
| 2021 | $612B | $29.6T |
| 2020 | $518B | $27.7T |
| 2019 | $564B | $23.2T |
| 2018 | $571B | $22.0T |
| 2017 | $493B | $20.5T |
| 2016 | $460B | $20.0T |
| 2015 | $435B | $18.9T |
| 2014 | $442B | $18.1T |
| 2013 | $425B | $17.2T |
| 2012 | $417B | $16.4T |
| 2011 | $433B | $15.2T |
| 2010 | $400B | $14.0T |
| 2009 | $354B | $12.3T |
| 2008 | $380B | $10.7T |
| 2007 | $414B | $9.2T |
| 2006 | $387B | $8.7T |
| 2005 | $355B | $8.2T |
| 2004 | $318B | $7.6T |
| 2003 | $294B | $7.0T |
| 2002 | $298B | $6.4T |
| 2001 | $318B | $5.9T |
| 2000 | $353B | $5.7T |
| 1999 | $353B | $5.8T |
| 1998 | $360B | $5.6T |
| 1997 | $368B | $5.5T |
| 1996 | $362B | $5.3T |
| 1995 | $357B | $5.0T |
| 1994 | $334B | $4.8T |
| 1993 | $311B | $4.5T |
| 1992 | $306B | $4.2T |
| 1991 | $308B | $3.8T |
| 1990 | $298B | $3.4T |
| 1989 | $275B | $3.0T |
| 1988 | $254B | $2.7T |
| 1987 | $240B | $2.4T |
| 1986 | $225B | $2.2T |
| 1985 | $219B | $1.9T |
| 1984 | $205B | $1.7T |
| 1983 | $176B | $1.4T |
| 1982 | $157B | $1.2T |
| 1981 | $142B | $1.0T |
| 1980 | $113B | $930.2B |
| 1979 | $96B | $845.1B |
| 1978 | $84B | $789.2B |
| 1977 | $69B | $718.9B |
| 1976 | $61B | $653.5B |
| 1975 | $55B | $576.6B |
| 1974 | $50B | $492.7B |
| 1973 | $45B | $469.1B |
| 1972 | $39B | $448.5B |
| 1971 | $36B | $424.1B |
| 1970 | $35B | $389.2B |
| 1969 | $30B | $368.2B |
| 1968 | $25B | $358.0B |
| 1967 | $23B | $344.7B |
| 1966 | $21B | $329.3B |
Interest payments represent seasonally adjusted annual rate at the end of Q4.
At current rates, the U.S. national debt is growing by a remarkable $1 trillion about every 100 days, equal to roughly $3.6 trillion per year.
As the national debt has ballooned, debt payments even exceeded Medicaid outlays in 2023—one of the government’s largest expenditures. On average, the U.S. spent more than $2 billion per day on interest costs last year. Going further, the U.S. government is projected to spend a historic $12.4 trillion on interest payments over the next decade, averaging about $37,100 per American.
Exacerbating matters is that the U.S. is running a steep deficit, which stood at $1.1 trillion for the first six months of fiscal 2024. This has accelerated due to the 43% increase in debt servicing costs along with a $31 billion dollar increase in defense spending from a year earlier. Additionally, a $30 billion increase in funding for the Federal Deposit Insurance Corporation in light of the regional banking crisis last year was a major contributor to the deficit increase.
Overall, the CBO forecasts that roughly 75% of the federal deficit’s increase will be due to interest costs by 2034.

-

 Mining2 weeks ago
Charted: The Value Gap Between the Gold Price and Gold Miners
-

 Real Estate1 week ago
Ranked: The Most Valuable Housing Markets in America
-

 Business1 week ago
Charted: Big Four Market Share by S&P 500 Audits
-

 AI1 week ago
The Stock Performance of U.S. Chipmakers So Far in 2024
-

 Misc1 week ago
Almost Every EV Stock is Down After Q1 2024
-

 Money2 weeks ago
Where Does One U.S. Tax Dollar Go?
-

 Green2 weeks ago
Ranked: Top Countries by Total Forest Loss Since 2001
-

 Real Estate2 weeks ago
Visualizing America’s Shortage of Affordable Homes